
Reconvictions among adults sentenced to custody or community supervision across five provincial correctional programs, 2015/2016 to 2018/2019
by Chloe Pedneault, Seung C. Lee and Natalie J. Jones
Highlights
- In a cohort of nearly 70,000 adults released from full-time custody or starting an intermittent or community sentence across five provincial correctional programs in 2015/2016, 50% were reconvicted within three years.
- Within a three-year follow-up period, the most common types of new convictions were for administration of justice offences (39%) and property offences (27%). The least common types of new convictions were for violent offences (21%) and other Criminal Code or federal statute offences (21%).
- The cohort was divided into two groups based on the type of correctional supervision sentence that led to their inclusion in the study: custody (37%) or community (63%). The custody cohort was more likely to be reconvicted than the community cohort at any given point during the follow-up period, with risk of reconviction being the highest within the first three months and declining over time. For example, an estimated 30% of those in the custody cohort and 14% of those in the community cohort were reconvicted within three months.
- Men aged 18 to 34 had the highest incidence of any reconviction within three years (56%), followed by women of the same age group (51%). The three-year incidence of any reconviction was lower for men (44%) and women (37%) aged 35 and older.
- The three-year incidence of any reconviction was highest for those with 10 or more prior convictions (79%), followed by those with 5 to 9 prior convictions (54%), 2 to 4 prior convictions (34%), and 0 to 1 prior convictions (19%).
- For decades, academics, policy officials, and communities have called for better disaggregated data on the experiences of Indigenous (i.e., First Nations people, Métis and Inuit) and Black people in the criminal justice system. Specifically, disaggregated data could help to inform policies aimed at addressing the over-representation of Indigenous and Black people in the system, a pressing concern which has been attributed to the historical and ongoing harms caused by colonial policies and practices. Reconvictions may contribute to over-representation in the criminal justice system as new convictions can lead to prolonged and repeated involvement with all levels of the system, from policing to corrections.
- A larger proportion of Indigenous people (66%) were reconvicted within three years compared to non-Indigenous people (45%). After controlling for age, gender, type of correctional supervision and criminal history, the risk of reconviction was 30% higher on average for Indigenous people compared to non-Indigenous people.
- The proportion of the cohort with any reconviction within three years was similar for Black (49%) and White (48%) people. However, after controlling for age, gender, type of correctional supervision and criminal history, Black people had, on average, an 8% lower risk of being reconvicted than White people.
In partnership with community organizations and service providers, the criminal justice system plays an important role in preventing repeated offending, or recidivism. Recidivism impacts public safety and has a lasting impact on the victims, families and communities affected by these crimes. Furthermore, recidivism impacts the effectiveness of the criminal justice system as resources must be allocated to respond to repeat offending. As such, measuring recidivism is important for the development and evaluation of criminal justice policies and interventions, as well as informing the effective use of resources within and outside the criminal justice system.
This Juristat is the first to present Canadian findings on new convictions (or reconviction) following a provincial correctional sentence using integrated data from multiple justice sectors and jurisdictions (Text box 1). Specifically, it attempts to address questions such as “What proportion of adults who have received a provincial correctional sentence are reconvicted?”, “How quickly are they reconvicted?”, and “What characteristics are associated with a higher risk of reconviction?”. Answers to these questions can help to inform evidence-based polices and interventions, including where additional rehabilitation and reintegration supports may be needed.
Start of text box 1
Text box 1
National re-contact database
As recommended by the Office of the Correctional Investigator (2018), Public Safety Canada and the Canadian Centre for Justice and Community Safety Statistics (CCJCSS) collaborated to develop a national database that integrates administrative data from policing, criminal court and correctional services sectors to produce statistics on repeated contact (or re-contact) with the criminal justice system. The term re-contact is used to refer to repeated contact with the criminal justice system, rather than re-offending or recidivism, to emphasize that statistics based on administrative data only capture official interventions by the criminal justice system. In other words, official re-contact records underestimate the true prevalence of recidivism.
Though a national re-contact database has not yet been created, data from multiple justice sectors and jurisdictions have been integrated, and more data will be added as they become available. In addition, the linked criminal justice data will be integrated with other social data sources (e.g., health, tax, education, housing, and immigration) to facilitate a more nuanced understanding of the socioeconomic and other factors associated with re-contact, and the potential pathways in and out of the criminal justice system.
This project builds on preliminary studies conducted by the CCJCSS that examined re-contact among people involved with the criminal justice system in specific jurisdictions, including Saskatchewan (Boyce et al., 2018; Brennan & Matarazzo, 2016) and Nova Scotia (Allen, 2020; Ibrahim, 2019). These studies found that a subset of individuals is responsible for a disproportionate share of police-reported crime, and that these individuals are more likely to be economically and socially marginalized than their counterparts with fewer police contacts.
For the current Juristat, reconviction was selected over other measures of re-contact (e.g., arrest, charge, incarceration, etc.) because it is one of the most commonly reported (e.g., Yukhnenko et al., 2019) and has the greatest potential impact on future socioeconomic opportunities (e.g., employment) and judicial decisions (Humphries et al., 2023; National Reentry Resource Center, n.d.). Because different measures of re-contact reflect different processes, they should not be directly compared. For instance, rates of reconviction will be lower than rates of re-arrest as not all arrests result in a conviction.
End of text box 1
This study is based on linked data from the Canadian Correctional Services Survey, Integrated Criminal Court Survey, and Canadian Vital Statistics – Death Database (see Data sources and methodology for more information). The study cohort consists of adults sentenced to custody or community supervision across five provincial correctional programs that currently report data to the Canadian Correctional Services Survey: Nova Scotia, Ontario, Saskatchewan, Alberta and British Columbia.Note Individuals included in the cohort were required to have experienced at least one of the following correctional eventsNote in 2015/2016:
- Release from full-time custody into the community (with or without conditions);
- Start of an intermittent sentence (i.e., a custody sentence that is served intermittently, such as on the weekends); or
- Start of a community supervision sentence (i.e., conditional sentence or probation).
Community sentences could not be immediately preceded by a custodial sentence; if they were, the custodial sentence was selected to represent the correctional event. For individuals with multiple correctional supervision events in 2015/2016, one event was randomly selected.
Reconviction was defined as any new federal statute conviction (in any province or territory) with an offence dateNote after release from full-time custody, or the start of an intermittent or community sentence, and before March 31, 2019 (or the date of death if it preceded the former). This study examined reconvictions for up to four years. Analyses are broken down by key demographic (i.e., gender and age) and criminal history characteristics (i.e., type of correctional supervision, number of prior convictions, and any prior convictions for a violent offence). Additionally, risk of reconviction was examined over time, including the extent to which age, gender, type of correctional supervision and criminal history characteristics predict reconviction.
Furthermore, this study attempts to respond to long-standing calls for better disaggregated data on the experiences of Indigenous (i.e., First Nations people, Métis and Inuit) and Black people in the criminal justice system (e.g., Commission on Systemic Racism in the Ontario Criminal Justice System, 1995; Government of Ontario, 2021; Millar & Owusu-Bempah, 2011; Truth and Reconciliation Commission of Canada, 2015b). Specifically, this study presents reconviction findings disaggregated by select population groups, including Indigenous, Black and other racialized groups.
It is important to note that the data used in this study did not allow for the analysis of many factors that are known to be associated with reconviction and criminal justice outcomes more generally, including education, employment, income, stable and suitable housing, community/social support and substance use (Bonta & Andrews, 2023; Institute for Research on Public Policy, 2018). Furthermore, the potential impact of correctional supervision, programming and community-based services on reconvictions was beyond the scope of this study. The inclusion of these factors in future work may highlight additional differences between and within the groups examined.
This article was produced with funding support from Public Safety Canada.
Section 1: Cohort characteristics
Most of the study cohort was starting a community sentence and consisted largely of younger men
The cohort was divided into two groups based on the type of correctional supervision that led to their inclusion in this study: custody and community. Custody supervision includes full-time custody and intermittent sentences; community supervision includes conditional sentences and probation. Across all five provinces, nearly two thirds of the cohort was starting a community supervision sentence (63%), and the rest was released from full-time custody or starting an intermittent sentence (37%). Additionally, the study cohort consisted mostly of men (82%) and younger adults (Table 1; see Appendix A for a provincial breakdown). Together, adults under the age of 35 represented more than half (56%) of the study cohort.
Custody cohort had a long criminal history – often violent in nature
Across all five provinces, 80% of people in the cohort had more than one prior convictionNote (Table 1; see Appendix A for a provincial breakdown). Individuals in the custody cohort had a more extensive criminal history than those in the community cohort. For example, 59% of the custody cohort had 10 or more prior convictions, which is almost three times as much as in the community cohort (20%). Notably, more than half of the custody (68%) and community (58%) cohorts had a prior conviction for a crime against the person, which as a category includes criminal harassment, uttering threats, assault, sexual assault, offences in relation to sexual services and other sexual offences, robbery, attempted murder and homicide. As these crimes are violent in nature (including physical and/or psychological violence), the term violent offence is used when referring to crimes against the person throughout this article.
Higher proportion of deaths in the custody cohort than in the community cohort
For this study, the end of the observation period was March 31, 2019, or the date of death if it preceded the former. It was important to identify whether people in the cohort died prior to the end of the study as they are no longer at risk of being reconvicted after their death. A slightly larger proportion of the custody cohort (6%) died during the study period compared to the community cohort (4%) (Table 1; see Appendix A for a provincial breakdown). The cause and location of death was beyond the scope of the current study but will be explored in future studies.
Section 2: Incidence of reconviction
Over one third of the cohort had a new conviction within a year
Incidence of reconviction is the proportion of individuals who were reconvicted within a given period. Across all five provinces, 37% of the cohort was reconvicted within one year, 45% within two years, and 50% within three years (Chart 1, see Appendix B for a provincial breakdown). Regardless of the follow-up period, a larger proportion of the custody cohort was reconvicted compared to the community cohort. For example, nearly twice as many of those with a custody sentence (53%) had a new conviction within one year compared to those sentenced to community supervision (28%) (Table 2).
Chart 1 start

Data table for Chart 1
| Type of correctional supervision | Fixed follow-up period | ||
|---|---|---|---|
| One year | Two years | Three years | |
| percent | |||
| Custody | 53 | 62 | 66 |
| Community | 28 | 36 | 40 |
| All | 37 | 45 | 50 |
|
Note: This chart presents data for the 2015/2016 cohort of adults supervised by five provincial correctional programs: Nova Scotia, Ontario, Saskatchewan, Alberta and British Columbia. Type of correctional supervision is based on the correctional sentence that led to the individual's inclusion in this study. Custody supervision includes full-time custody and intermittent sentences; community supervision includes conditional sentences and probation. Reconviction is defined as any new federal statute conviction (in any province or territory) with an offence date after release from full-time custody or start of an intermittent or community sentence and before the end of the fixed follow-up period (i.e., one, two, or three years). Source: Statistics Canada, Canadian Centre for Justice and Community Safety Statistics, Linked Canadian Correctional Services Survey, Integrated Criminal Court Survey and Canadian Vital Statistics – Death Database. |
|||
Chart 1 end
Reconvictions more common for non-violent offences than for violent offences
When considering the different types of convictions incurred by individuals over a three-year follow-up period, over one in five (21%) individuals had at least one new conviction for a violent offence (Table 2). However, reconvictions were more common for non-violent offences. Specifically, after three years, 27% of individuals in the cohort had a new conviction for a property offenceNote and 21% had a new conviction for another Criminal Code or federal statute offence.Note Furthermore, administration of justice offences represented the most common type of new conviction, with 39% of the cohort having at least one new conviction for an administration of justice offence within three years.
Administration of justice convictions include breach of probation, failure to comply with an order, failure to appear, and being unlawfully at large. These convictions encompass acts that are not criminal in themselves, such as breaking curfew, arriving late to a court proceeding or consuming alcohol, but they are treated as criminal offences because they are included as conditions of release (Department of Justice Canada, 2018). Notably, after one year, 25% (31% for community and 20% for custody) of those with at least one new conviction were reconvicted only of administration of justice offences, meaning that they had no other type of conviction within this timeframe. After two years, 18% (23% for community and 13% for custody) of those with at least one new conviction had only administration of justice convictions, with this proportion decreasing to 15% (19% for community and 10% for custody) after three years.
Although the current study did not examine the sentencing outcomes of reconvictions, administration of justice convictions often result in a custody sentence and may be accompanied by additional conditions (Burczycka & Munch, 2015). As such, it can be difficult for someone to break the cycle of reconviction if they struggled to follow their conditions of release, even if they have otherwise been law-abiding. Many reasons have been proposed in the literature for why some people have difficulties following these conditions, including lack of transportation and family support, substance use issues, mental health problems, and cognitive functioning (e.g., Orsi & April, 2013). These circumstances can make it more difficult to follow certain conditions of release.
Younger adults had a higher incidence of reconviction than older adults
Consistent with the well-documented relationship between age and crime (e.g., Allen, 2016; Hanson, 2002; Sampson & Laub, 2003), 18-to-19-year-olds had the highest three-year incidence of reconviction (60%) and those 60 years and older had the lowest incidence (20%) (Chart 2; Table 3). However, the relationship between age and reconviction was not completely linear. The age group with the second highest three-year incidence of reconviction consisted of 25-to-29-year-olds (56%) followed by 30-to-34-year-olds (55%), both of which had a higher incidence of reconviction than young adults aged 20 to 24 (53%). When different types of new convictions were examined separately, only the incidence of new convictions for violent offences declined as expected from youngest to oldest (Table 3). Given the relatively small number of 18-to-19-year-olds in the cohort, and the similar incidences of reconviction across the rest of the cohort aged 34 and younger, individuals aged 18 to 34 were grouped and compared to those 35 and older in subsequent analyses involving age.
Chart 2 start

Data table for Chart 2
| Age group | Any New Conviction |
|---|---|
| percent | |
| 18 to 19 years | 60 |
| 20 to 24 years | 53 |
| 25 to 29 years | 56 |
| 30 to 34 years | 55 |
| 35 to 39 years | 53 |
| 40 to 44 years | 47 |
| 45 to 49 years | 42 |
| 50 to 54 years | 35 |
| 55 to 59 years | 28 |
| 60 and older | 20 |
|
Note: This chart presents data for the 2015/2016 cohort of adults supervised by five provincial correctional programs: Nova Scotia, Ontario, Saskatchewan, Alberta and British Columbia. Age group reflects age on the date of release from full-time custody or the start of an intermittent or community sentence. Reconviction is defined as any new federal statute conviction (in any province or territory) with an offence date after release from full-time custody or start of an intermittent or community sentence and before the end of the fixed three-year follow-up period. Source: Statistics Canada, Canadian Centre for Justice and Community Safety Statistics, Linked Canadian Correctional Services Survey, Integrated Criminal Court Survey and Canadian Vital Statistics – Death Database. |
|
Chart 2 end
About 1 in 4 younger men had a new conviction for a violent offence within three years
Men aged 18 to 34 had the highest incidence of any reconviction within three years (56%), followed by women of the same age group (51%) (Chart 3). The three-year incidence of any reconviction was lower for men and women aged 35 and older (44% and 37% respectively). The largest differences in the types of new convictions between men and women were for violent offences and other Criminal Code and federal statute offences, with a larger proportion of men having new convictions for these types of offences. For example, the three-year incidence of any new conviction for a violent offence was 1.6 times higher among men aged 18 to 34 (27%) relative to women aged 18 to 34 (17%). The discrepancies between men and women were smaller for new property and administration of justice convictions.
Chart 3 start

Data table for Chart 3
| Age group | Men | Women | ||||||||
|---|---|---|---|---|---|---|---|---|---|---|
| Any new conviction | Violent | Property | Other Criminal Code or federal statute | Administration of justice | Any new conviction | Violent | Property | Other Criminal Code or federal statute | Administration of justice | |
| percent | ||||||||||
| 18 to 34 years | 56 | 27 | 31 | 27 | 45 | 51 | 17 | 30 | 18 | 42 |
| 35 and older | 44 | 17 | 22 | 17 | 33 | 37 | 10 | 21 | 10 | 27 |
|
Note: This chart presents data for the 2015/2016 cohort of adults supervised by five provincial correctional programs: Nova Scotia, Ontario, Saskatchewan, Alberta and British Columbia. Age group reflects age on the date of release from full-time custody or the start of an intermittent or community sentence. Reconviction is defined as any new federal statute conviction (in any province or territory) with an offence date after release from full-time custody or start of an intermittent or community sentence and before the end of the fixed three-year follow-up period. Someone could have more than one type of new conviction, therefore, percentages for the different types of new convictions do not sum to the overarching category of any new conviction. This chart excludes individuals whose gender was unknown. Source: Statistics Canada, Canadian Centre for Justice and Community Safety Statistics, Linked Canadian Correctional Services Survey, Integrated Criminal Court Survey and Canadian Vital Statistics – Death Database. |
||||||||||
Chart 3 end
Most of those in the cohort with 10 or more prior convictions were reconvicted within three years
The three-year incidence of any reconviction was highest for those with 10 or more prior convictions (79%), followed by those with 5 to 9 prior convictions (54%), 2 to 4 prior convictions (34%), and 0 to 1 prior convictions (19%) (Chart 4). This pattern of findings was consistent regardless of the type of new conviction. Notably, after three years, more than half of those with 10 or more prior convictions had a new conviction for a property offence (52%), which was two times higher than the proportion among those with 5 to 9 prior convictions (26%). These findings are consistent with criminal history being one of the strongest predictors of reconviction (Bonta & Andrews, 2023).
Chart 4 start

Data table for Chart 4
| Number of prior convictions | Type of new conviction | ||||
|---|---|---|---|---|---|
| Any new conviction | Violent | Property | Other Criminal Code or federal statute | Administration of justice | |
| percent | |||||
| 0 to 1 prior convictions | 19 | 6 | 6 | 6 | 12 |
| 2 to 4 prior convictions | 34 | 12 | 13 | 12 | 24 |
| 5 to 9 prior convictions | 54 | 21 | 26 | 21 | 42 |
| 10 or more prior convictions | 79 | 37 | 52 | 38 | 66 |
|
Note: This chart presents data for the 2015/2016 cohort of adults supervised by five provincial correctional programs: Nova Scotia, Ontario, Saskatchewan, Alberta and British Columbia. Reconviction is defined as any new federal statute conviction (in any province or territory) with an offence date after release from full-time custody or start of an intermittent or community sentence and before the end of the fixed three-year follow-up period. Someone could have more than one type of new conviction, therefore, percentages for the different types of new convictions do not sum to the overarching category of any new conviction. Prior convictions were identified based on the date of the conviction in court for a 10-year period prior to and including the day on which the person was released from full-time custody or started an intermittent or community sentence. It is possible for someone to have 0 prior convictions if their only prior conviction occurred more than 10 years earlier. Source: Statistics Canada, Canadian Centre for Justice and Community Safety Statistics, Linked Canadian Correctional Services Survey, Integrated Criminal Court Survey and Canadian Vital Statistics – Death Database. |
|||||
Chart 4 end
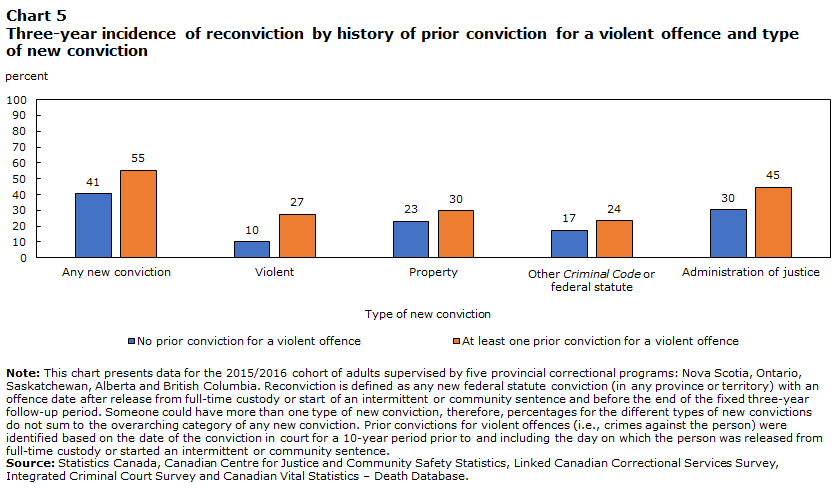
More than a quarter of those with a prior conviction for a violent offence were reconvicted of a new violent offence within three years
Individuals with at least one prior conviction for a violent offence were nearly three times more likely to be reconvicted for a new violent offence within three years (27%) compared to those without a history of this type of conviction (10%) (Chart 5). Individuals with a prior conviction for a violent offence also had a higher three-year incidence of reconviction for property offences (30% vs. 23%), other Criminal Code and federal statute offences (24% vs. 17%) and administration of justice offences (45% vs. 30%).
Chart 5 start
Data table for Chart 5
| History of prior conviction for a violent offence | Type of new conviction | ||||
|---|---|---|---|---|---|
| Any new conviction | Violent | Property | Other Criminal Code or federal statute | Administration of justice | |
| percent | |||||
| No prior violent conviction | 41 | 10 | 23 | 17 | 30 |
| At least one prior violent conviction | 55 | 27 | 30 | 24 | 45 |
|
Note: This chart presents data for the 2015/2016 cohort of adults supervised by five provincial correctional programs: Nova Scotia, Ontario, Saskatchewan, Alberta and British Columbia. Reconviction is defined as any new federal statute conviction (in any province or territory) with an offence date after release from full-time custody or start of an intermittent or community sentence and before the end of the fixed three-year follow-up period. Someone could have more than one type of new conviction, therefore, percentages for the different types of new convictions do not sum to the overarching category of any new conviction. Prior convictions for violent offences (i.e., crimes against the person) were identified based on the date of the conviction in court for a 10-year period prior to and including the day on which the person was released from full-time custody or started an intermittent or community sentence. Source: Statistics Canada, Canadian Centre for Justice and Community Safety Statistics, Linked Canadian Correctional Services Survey, Integrated Criminal Court Survey and Canadian Vital Statistics – Death Database. |
|||||
Chart 5 end
Section 3: Risk of reconviction over time
Risk of reconviction was highest in the first three months
The following analyses account for days in custody during the follow-up period, meaning that the measure of time counts only d ays in the community.Note At 0.20, the probability of the cohort being reconvicted was the highest in the first three months following release from custody or the start of an intermittent or community sentence (Table 4). In other words, the cohort had a 20% chance of being reconvicted within the initial three months. Among those who had remained conviction-free for the first three months, the probability of being reconvicted over the following three-month period was approximately halved to 0.11, meaning that the cohort had an 11% chance of being reconvicted between three to six months given that they had remained conviction-free up to that point. After this point, the probability of reconviction continued to decline more gradually over time given that the person had remained conviction-free. The same pattern of results was observed in both the custody and community cohorts. Although the custody cohort was less likely to remain conviction-free than the community cohort over time, both groups demonstrated a similar pattern such that the probability of being reconvicted was highest at the beginning of the follow-up period and declined over time (Table 4). This is illustrated by the relatively steep decline in the cumulative probability of remaining conviction-free over the first six months followed by a more gradual decline after this point (Chart 6).
Chart 6 start

Data table for Chart 6
| Months in the community | Type of correctional supervision | |
|---|---|---|
| Custody | Community | |
| Cumulative probability of remaining conviction-free | ||
| 0 | 1.0 | 1.0 |
| 3 | 0.7 | 0.9 |
| 6 | 0.6 | 0.8 |
| 9 | 0.5 | 0.7 |
| 12 | 0.5 | 0.7 |
| 15 | 0.4 | 0.7 |
| 18 | 0.4 | 0.7 |
| 21 | 0.4 | 0.7 |
| 24 | 0.4 | 0.6 |
| 27 | 0.4 | 0.6 |
| 30 | 0.4 | 0.6 |
| 33 | 0.3 | 0.6 |
| 36 | 0.3 | 0.6 |
| 39 | 0.3 | 0.6 |
| 42 | 0.3 | 0.6 |
| 45 | 0.3 | 0.6 |
| 48 | 0.3 | 0.6 |
|
Note: This chart presents data for the 2015/2016 cohort of adults supervised by five provincial correctional programs: Nova Scotia, Ontario, Saskatchewan, Alberta and British Columbia. Type of correctional supervision is based on the correctional sentence that led to the individual's inclusion in this study. Custody supervision includes full-time custody and intermittent sentences; community supervision includes conditional sentences and probation. Reconviction is defined as any new federal statute conviction (in any province or territory) with an offence date after release from full-time custody or start of an intermittent or community sentence and before March 31, 2019. The cumulative probability of remaining conviction-free was computed by three-month time intervals. Months in the community count only the days when the individual was not in custody. Source: Statistics Canada, Canadian Centre for Justice and Community Safety Statistics, Linked Canadian Correctional Services Survey, Integrated Criminal Court Survey and Canadian Vital Statistics – Death Database. |
||
Chart 6 end
These findings are consistent with results from other studies that have found that the risk of re-contact with the criminal justice system is highest early in the follow-up period (Brennan & Matarazzo, 2016; Harris & Hanson, 2004). For individuals released from custody, this early vulnerability has been attributed to challenges faced in the initial months after release, such as adjusting to intervention plans, securing employment, and establishing a stable residence (Flores et al., 2017; Hanson et al., 2018). Over time, however, this risk diminishes, possibly due to factors such as an increase in living stability (i.e., securing employment and housing), reduction in stressors inherent in transitioning to a new environment, and the adoption and honing of prosocial skills. Similarly, individuals starting a community supervision sentence must learn and adjust to conditions of release imposed by the court, for example, reporting to a probation officer, abstaining from drugs and alcohol, and avoiding certain places or people. In fact, not complying with these new conditions could lead to a new conviction for an administration of justice offence.
New administration of justice convictions occurred quickly
New administration of justice convictions occurred relatively quickly compared to the other types of convictions, with the cohort having a 15% chance of being reconvicted for an administration of justice offence within the first three months (Table 5). In contrast, it took approximately nine months for an estimated 15% of the cohort to have a new conviction for a property offence and about 18 months for 15% to have a new conviction for a violent offence or another Criminal Code or federal statute offence.Note This is also illustrated by the relatively steeper decline in the cumulative probability of remaining conviction-free for administration of justice offences compared to the other types of offences (Chart 7). Said differently, the cumulative probability of reconviction (i.e., 1 minus the cumulative probability of remaining conviction-free) was the highest for administration of justice offences over the follow-up period. The next most likely types of reconvictions were for property offences, followed by violent offences and other Criminal Code or federal statute offences; the latter two having an almost identity probability of reconviction at any point in time.
Chart 7 start

Data table for Chart 7
| Months in the community | Type of new conviction | |||
|---|---|---|---|---|
| Violent | Property | Other Criminal Code or federal statute | Administration of justice | |
| Cumulative probability of remaining conviction-free | ||||
| 0 | 1.0 | 1.0 | 1.0 | 1.0 |
| 3 | 1.0 | 0.9 | 1.0 | 0.9 |
| 6 | 0.9 | 0.9 | 0.9 | 0.8 |
| 9 | 0.9 | 0.8 | 0.9 | 0.7 |
| 12 | 0.9 | 0.8 | 0.9 | 0.7 |
| 15 | 0.9 | 0.8 | 0.9 | 0.7 |
| 18 | 0.8 | 0.8 | 0.8 | 0.7 |
| 21 | 0.8 | 0.8 | 0.8 | 0.6 |
| 24 | 0.8 | 0.8 | 0.8 | 0.6 |
| 27 | 0.8 | 0.7 | 0.8 | 0.6 |
| 30 | 0.8 | 0.7 | 0.8 | 0.6 |
| 33 | 0.8 | 0.7 | 0.8 | 0.6 |
| 36 | 0.8 | 0.7 | 0.8 | 0.6 |
| 39 | 0.8 | 0.7 | 0.8 | 0.6 |
| 42 | 0.8 | 0.7 | 0.8 | 0.6 |
| 45 | 0.8 | 0.7 | 0.8 | 0.6 |
| 48 | 0.8 | 0.7 | 0.8 | 0.6 |
|
Note: This chart presents data for the 2015/2016 cohort of adults supervised by five provincial correctional programs: Nova Scotia, Ontario, Saskatchewan, Alberta and British Columbia. Reconviction is defined as any new federal statute conviction (in any province or territory) with an offence date after release from full-time custody or start of an intermittent or community sentence and before March 31, 2019. Someone could have more than one type of new conviction within the follow-up period and, therefore, may be represented in more than one category. The cumulative probability of remaining conviction-free was computed by three-month time intervals. Months in the community count only the days when the individual was not in custody. Source: Statistics Canada, Canadian Centre for Justice and Community Safety Statistics, Linked Canadian Correctional Services Survey, Integrated Criminal Court Survey and Canadian Vital Statistics – Death Database. |
||||
Chart 7 end
Age and criminal history each predicted reconviction after controlling for other characteristics
The following analyses sought to determine which of the socio-demographic characteristics examined so far are the most important in predicting reconviction. Consistent with the incidence rates presented in the previous section, custody supervision, being younger, having more prior convictions, and having any prior conviction for a violent offence each independently predicted a higher risk of reconviction at any given point during the follow-up period (Table 6). For example, the hazard ratio (i.e., probability of an event occurring in one group compared to another group over time) comparing the risk of any reconviction for community versus custody supervision (controlling for the other characteristics in the model) was 1.32, meaning that risk of reconviction was on average 32% higher for the custody cohort than for the community cohort at any given point in the follow-up period. Additionally, younger adults (18 to 34) had a 25% higher risk of reconviction on average than older adults (35 and older). In terms of criminal history, individuals with 10 or more prior convictions were on average over six times more likely to be reconvicted than those in the cohort with no more than one prior conviction.
Gender did not independently predict any reconviction after controlling for other characteristics; however, there were some gender differences when analyses were further broken down by type of new conviction. Specifically, at any given point in the follow-up period, men were on average 34% more likely than women to have a new conviction for a violent offence and 45% more likely to have a new conviction for another Criminal Code or federal statute offence (Table 6). In contrast, women were on average 10% more likely than men to have a new conviction for a property offence and 5% more likely to have a new conviction for an administration of justice offence.
Section 4: Reconviction disaggregated by population group
Long-standing calls for better disaggregated data on the diverse experiences of Indigenous, Black and other racialized groups have been increasing in response to problems of social inequities, discrimination and systemic racism within Canadian society (Canadian Heritage, 2019; David & Mitchell, 2021; Commission on Systemic Racism in the Ontario Criminal Justice System, 1995; Government of Ontario, 2021; Millar & Owusu-Bempah, 2011; Truth and Reconciliation Commission of Canada, 2015b). Such detailed information is crucial in improving our understanding of these issues, but also for providing information for evidence-based policies, helping in the development of targets and benchmarks to monitor progress, and for providing information to assess the effectiveness of programs, services and initiatives.
In particular, disaggregated data on the experiences of Indigenous and Black people in the criminal justice system could help to inform policies aimed at addressing the over-representation of these groups at various stages within the system. The over-representation of Indigenous and Black people in the criminal justice system is a pressing concern which has been attributed to the historical and ongoing harms caused by colonial policies and practices, anti-Indigenous and anti-Black racism, and systemic discrimination (Text box 2). The impacts of colonialism manifest in various areas, such as creating and maintaining barriers to education, employment, and stable/suitable housing; in turn, these circumstances are often linked to disproportionately more interactions with the criminal justice system (Institute for Research on Public Policy, 2018). Furthermore, decades of studies, inquiries and court rulings have concluded that systemic discrimination in policing, courts and corrections contributes to the over-representation of Indigenous and Black people in the criminal justice system (Commission on Systemic Racism in the Ontario Criminal Justice System, 1995; National Inquiry into Missing and Murdered Indigenous Women and Girls, 2019; Truth and Reconciliation Commission of Canada, 2015b; R v Gladue, 1999; R v Ipeelee, 2012; Royal Commission on Aboriginal Peoples, 1996; Working Group of Experts on People of African Descent, 2017; Wortley & Owusu-Bempah, 2022).
Start of text box 2
Text box 2
Over-representation of Indigenous and Black people in the criminal justice system
Indigenous people
The term “Indigenous peoples” refers to three distinct groups – First Nations people, Métis and Inuit – with diverse histories, languages and cultural practices. In 2021, Indigenous people accounted for 5% of the total population in Canada, with First Nations people accounting for over half (58%) of the Indigenous population, Métis for just over one-third (35%), and Inuit for 4% (Statistics Canada, 2022, September 21).
Despite First Nations people, Métis and Inuit having diverse histories and experiences, Indigenous people as a group face similar challenges, including socioeconomic marginalization, racism and systemic discrimination. These challenges have been attributed to the historic and ongoing harms caused by colonial policies and practices, including the outlawing of Indigenous cultural practices, forced relocation, residential schools, and discriminatory child welfare policies (Royal Commission on Aboriginal Peoples, 1996; Truth and Reconciliation Commission of Canada, 2015b). Given this context, relative to non-Indigenous people in Canada, Indigenous people have disproportionately high rates of physical and mental health needs, and they more often face additional barriers to education, employment and higher incomes (Clark, 2019; Melvin, 2023). Indigenous people are also overrepresented in the child welfare system (Statistics Canada, 2022, September 21) and the criminal justice system (Truth and Reconciliation Commission of Canada, 2015b).
The over-representation of Indigenous people in the criminal justice system has been linked to the historic and ongoing impacts of colonialism, anti-Indigenous racism and systemic discrimination (e.g., Royal Commission on Aboriginal Peoples, 1996; Truth and Reconciliation Commission of Canada, 2015a; Truth and Reconciliation Commission of Canada, 2015b). Whereas many individuals who are involved with the criminal justice system are socially and economically marginalized, Indigenous people’s experiences are compounded by racism and systemic discrimination within and outside the criminal justice system (Royal Commission on Aboriginal Peoples, 1996; Truth and Reconciliation Commission of Canada, 2015b). Indeed, evidence suggests that systemic discrimination in policing, courts and corrections contributes to the over-representation of Indigenous people throughout the criminal justice system (Clark, 2019; National Inquiry into Missing and Murdered Indigenous Women and Girls, 2019; Truth and Reconciliation Commission of Canada, 2015b; R v Gladue, 1999; R v Ipeelee, 2012; Royal Commission on Aboriginal Peoples, 1996).
Compared to non-Indigenous people, Indigenous people are more likely to come into contact with the police as accused, victims and witnesses of crime (Cotter, 2022; David & Mitchell, 2021; National Inquiry into Missing and Murdered Indigenous Women and Girls, 2019). Additionally, while Indigenous people accounted for only 5% of the population in Canada, they represented 25% of all accused in criminal court in 2015/2016 (Saghbini et al., 2021). Indigenous people accused before the courts were also more likely than White people to be found guilty and more likely to be sentenced to custody (Saghbini et al., 2021). Indeed, statistics show that Indigenous people are overrepresented in the correctional system, particularly in custody (Robinson et al., 2023). Across five provincial correctional programs, the rate of incarceration in 2020/2021 was about 8.9 times higher for Indigenous compared to non-Indigenous people, a 14% increase from the previous year (7.8; Robinson et al., 2023). This rate, also known as the over-representation index, was highest in Saskatchewan (17.7), followed by Alberta (10.8), British Columbia (7.9), Ontario (6.3) and Nova Scotia (1.9). Indigenous people are also overrepresented in the federal correctional system, representing 27% of the total federal correctional population in 2020/2021 (Public Safety Canada Portfolio Corrections Statistics Committee, 2023).
Black people
In 2021, the Black population accounted for 4% of Canada's total population (Statistics Canada, 2022, October 26). Whereas 41% of the Black population was born in Canada, nearly a third were born in Africa (including Nigeria, Ethiopia and the Democratic Republic of the Congo) and 21% were born in the Caribbean and Bermuda (Statistics Canada, 2022, October 26). Black people in Canada have unique backgrounds, languages and experiences, which are reflected in the over 300 different ethnic or cultural origins reported in the 2021 Census (Statistics Canada, 2022, October 26).
In Canada, the Black population faces social and economic challenges which have been attributed to the historic and ongoing harms caused by colonial laws, policies and practices, including racial segregation and discriminatory immigration policies (Owusu-Bempah & Jeffers, 2022; Working Group of Experts on People of African Descent, 2017). Although slavery was abolished in 1834 (after over 200 years of slavery in colonies that would later become Canada), Black people continued to face racist policies and practices that limited their socioeconomic potential and perpetuated anti-Black racism and discrimination (McCullough & McRae, 2023; Mooten, 2021). Anti-Black racism and systemic discrimination are still evidenced today through socioeconomic marginalization (Houle, 2020), as well as the over-representation of Black people in the child welfare system (Owusu-Bempah & Jeffers, 2022; Ontario Association of Children's Aid Societies, 2016) and the criminal justice system (as both victims/survivors and accused/convicted) (Department of Justice Canada, 2022).
The over-representation of Black people in the criminal justice system has been attributed to the ongoing and historical impacts of colonialism, anti-Black racism and systemic discrimination (e.g., Commission on Systemic Racism in the Ontario Criminal Justice System, 1995; Working Group of Experts on People of African Descent, 2017; Wortley & Owusu-Bempah, 2022). Data show that Black people are disproportionately more likely than White people to have contact with the police and to face racial profiling and discrimination in these interactions (Cotter, 2022; Wortley & Owusu-Bempah, 2022). Black people are also overrepresented among those charged with a crime in Canada, with Black people accounting for 6% of all accused in criminal court in 2015/2016 while only representing 3% of the Canadian population that was 12 years of age and older in 2016 (Saghbini & Paquin-Marseille, 2023). Furthermore, compared to their White counterparts, Black people found guilty of a crime are more likely to receive a custodial sentence and, if sentenced to custody, are more likely to receive a long-term custodial sentence of two or more years (Saghbini & Paquin-Marseille, 2023). This is reflected in their over-representation in federal and provincial custody. For instance, in 2020/2021, Black people represented 9% of the total federal custody population despite representing only 4% of the Canadian adult population in 2021 (Department of Justice Canada, 2022). Over-representation of Black people varies by provincial correctional program, with Nova Scotia and Ontario having a relatively high proportion of Black adults admitted to custody compared to their respective provincial populations (although data are only available for Nova Scotia, Ontario, Alberta and British Columbia) (Department of Justice Canada, 2022).
End of text box 2
The current study presents disaggregated data on reconvictions among Indigenous, Black and other racialized groups with the intention of providing new evidence to help inform policies aimed at addressing the over-representation of Indigenous and Black people in the Canadian criminal justice system. As in the previous sections, the data used in the following analyses did not allow for the inclusion of many general factors that are known to be associated with reconviction, such as education, employment, income, stable and suitable housing, community/social support and substance use (Bonta & Andrews, 2023; Institute for Research on Public Policy, 2018). In addition, the data used in this study could not account for the broader contextual factors associated with the over-representation of Indigenous and Black people in the criminal justice system, including the legacy and sustained effects of colonialism (e.g., intergenerational trauma), racism and systemic discrimination. As such, the extent to which reconvictions are influenced by these factors could not be explored.
Indigenous identity refers to people under correctional supervision who identified as Indigenous. This information was available for all five provincial correctional programs included in this study. In contrast, information on racialized groups was only available for four of the five provincial correctional programs: Nova Scotia, Ontario, Alberta and British Columbia.
In this study, racialized groups are based on and measured using the ‘visible minority’ variable in accordance with Statistics Canada disaggregated data standards. Visible minority refers to whether a person is a visible minority or not, as defined by the Employment Equity Act. The Employment Equity Act defines visible minorities as "persons, other than Aboriginal peoples, who are non-Caucasian in race or non-white in colour". The visible minority population consists mainly of the following groups: South Asian, Chinese, Black, Filipino, Arab, Latin American, Southeast Asian, West Asian, Korean and Japanese. As part of ongoing efforts to modernize the national statistical system, the "visible minorities" standard is currently under review. To date, Statistics Canada has received feedback on the sensitivity and use of the term "visible minorities" when disseminating data. A commonly proposed alternative is "racialized groups," with various definitions and classifications. This is the term that is used in this report.
Information on Indigenous identity and racialized groups was self-reported by people upon intake to correctional services. It is possible that fear of unfair treatment and/or other forms of discrimination may have influenced someone’s willingness to disclose their identity. The proportion of the cohort whose Indigenous and/or racialized identity was unknown is indicated in the Notes where applicable. The following analyses are limited to individuals for whom Indigenous and/or racialized identity was available.
Section 4.1: Comparison of Indigenous and non-Indigenous groups
In the analyses that follow, reconviction rates are presented comparing Indigenous and non-Indigenous people for all five provincial correctional programs included in this study. Certain analyses are also presented by Indigenous identity group (First Nations people, Métis and Inuit) when the data allowed this level of analysis. It was not possible to create a comparison group of White people (i.e., people who identified as neither Indigenous nor with a racialized group) without having information on racialized groups, which was not available for the cohort from Saskatchewan. However, it was deemed important to present findings for the Indigenous population including Saskatchewan as, of the five provinces from which the study cohort was drawn, Saskatchewan has the largest proportion (17%) of Indigenous people according to the 2021 Census (Nova Scotia, 5.5%; Ontario, 2.9%; Alberta, 6.8%; British Columbia, 5.9%) (Statistics Canada, 2022, September 21).
1 in 4 people in the cohort were Indigenous
Overall, a quarter of the cohort was Indigenous. Saskatchewan had the highest relative proportion of Indigenous (73%) to non-Indigenous (27%) people, followed by Alberta (37% and 63%), British Columbia (29% and 71%), Ontario (13% and 87%) and Nova Scotia (7% and 93%).Note Information on Indigenous identity group was available for four of the five provincial correctional programs: Ontario, Saskatchewan, Alberta and British Columbia. Across these four provinces, Indigenous people were mostly First Nations people (84%), followed by Métis (15%) and Inuit (1%).Note
Indigenous people in the cohort had more prior convictions than non-Indigenous people
A larger proportion of Indigenous people in the cohort were supervised in custody (44%) compared to non-Indigenous people (35%). There are numerous circumstances and explanations as to why Indigenous people are over-represented in custody, including the historical and ongoing harms of colonialism, socioeconomic and cultural marginalization, and systemic discrimination (Truth and Reconciliation Commission of Canada, 2015a; Truth and Reconciliation Commission of Canada, 2015b). Relative to non-Indigenous people in the cohort, a larger proportion of Indigenous people were women (24% of Indigenous and 16% of non-Indigenous) and younger adults (i.e., 18 to 34; 64% of Indigenous and 53% of non-Indigenous). Indigenous people in the cohort also had a more extensive criminal history than non-Indigenous people. Specifically, half of the Indigenous cohort had 10 or more prior convictions compared to 30% of the non-Indigenous cohort. Additionally, approximately half as many Indigenous (10%) compared to non-Indigenous (23%) people in the cohort had only one (or zero) prior conviction. Furthermore, having a prior conviction for a violent offence was more common in the Indigenous (72%) compared to the non-Indigenous (59%) cohort. Given that evidence suggests that Indigenous people are more likely to come into contact with the police (Cotter, 2022) and that they are more likely to be convicted on criminal charges in court than White people (Saghbini et al., 2021), it is important to consider criminal history within the context of long-standing systemic bias within and outside the criminal justice system.
A larger proportion of the Indigenous cohort was reconvicted than the non-Indigenous cohort
The incidence of any reconviction after three years was approximately 1.5 times higher for Indigenous (66%) relative to non-Indigenous (45%) people in the cohort (see Text Box 3 for results disaggregated for First Nations people and Métis). A similar trend was observed across gender and age groups (Chart 8). For example, 66% of younger (18 to 34) Indigenous women and 49% of older (35 or older) Indigenous women were reconvicted within three years compared to 44% and 33% of non-Indigenous women, respectively. Younger Indigenous men had the highest incidence of reconviction, with nearly 3 in 4 (73%) having at least one new conviction within three years. In contrast, approximately 1 in 2 (51%) of the younger non-Indigenous men were reconvicted.
Chart 8 start

Data table for Chart 8
| Indigenous identity | Any new conviction by gender and age | |||
|---|---|---|---|---|
| Men | Women | |||
| 18 to 34 years | 35 or older | 18 to 34 years | 35 or older | |
| percent | ||||
| Indigenous | 73 | 60 | 66 | 49 |
| Non-Indigenous | 51 | 41 | 44 | 33 |
|
Note: This chart presents data for the 2015/2016 cohort of adults supervised by five provincial correctional programs: Nova Scotia, Ontario, Saskatchewan, Alberta and British Columbia. Indigenous refers to persons who are First Nations people, Métis and/or Inuit. Indigenous identity information is self-reported upon intake to correctional services. Age group reflects age on the date of release from full-time custody or the start of an intermittent or community sentence. Reconviction is defined as any new federal statute conviction (in any province or territory) with an offence date after release from full-time custody or start of an intermittent or community sentence and before the end of the fixed three-year follow-up period. This chart excludes individuals whose Indigenous identity and/or gender was unknown. Source: Statistics Canada, Canadian Centre for Justice and Community Safety Statistics, Linked Canadian Correctional Services Survey, Integrated Criminal Court Survey and Canadian Vital Statistics – Death Database. |
||||
Chart 8 end
These results are consistent with studies that have found that Indigenous people have higher re-arrest (Brennan & Matarazzo, 2016) and reconviction (Bonta et al., 2003; Stewart et al., 2019) rates than non-Indigenous people. Furthermore, the current findings suggest that, relative to non-Indigenous people, it may be particularly difficult for Indigenous people to break away from the criminal justice system once they have experienced correctional supervision. Some have suggested that this can be partially explained by the clash in worldviews between the mainstream criminal justice system and many Indigenous cultures (Clark, 2019). Whereas the mainstream criminal justice system is an adversarial one that tends to focus on punishment and finding of guilt, most Indigenous cultures tend to emphasize rehabilitation, empowerment and healing at both the individual and community levels (Clark, 2019). Indigenous communities have highlighted the importance of self-determination in shaping approaches to justice, including the implementation of Indigenous-led and community-based justice programs and services that reflect the cultural beliefs and values of the Indigenous communities they serve (Department of Justice Canada, 2023; Truth and Reconciliation Commission of Canada, 2015a). In line with this, research suggests that incorporating more culturally-informed programs for Indigenous people may help to reduce reconviction (Department of Justice Canada, 2017; Gutierrez et al., 2018).
Start of text box 3
Text box 3
Reconvictions among First Nations people and Métis
Analyses were also disaggregated by Indigenous identity group for the four provincial correctional programs for which Indigenous identity group was available (Ontario, Saskatchewan, Alberta and British Columbia). However, due to the small number of Inuit in the study cohort, data are only available for First Nations people and Métis. Additionally, these data should be interpreted with caution given the relatively smaller proportion of Métis (15%) relative to First Nations people (84%) within the Indigenous cohort.
Results showed that First Nations people (67%) had a slightly lower three-year incidence of reconviction than Métis (70%). When further broken down by type of new conviction, a slightly larger proportion of First Nations people than Métis had a new conviction for a violent offence (33% vs. 30%) and a smaller proportion had a new conviction for a property offence (34% vs. 43%). First Nations people also had a slightly lower three-year incidence of any new conviction compared to Métis for another Criminal Code or federal statute offence (28% vs. 33%) and any new administration of justice offence (56% vs. 58%).
End of text box 3
Regardless of criminal history, Indigenous people were more likely to be reconvicted for an administration of justice offence
A smaller proportion of both Indigenous and non-Indigenous people were reconvicted if they had fewer prior convictions. However, the three-year incidence of reconviction was still consistently higher for Indigenous than non-Indigenous people, regardless of the number of prior convictions. For instance, approximately one third of the Indigenous cohort (32%) with 0 to 1 prior convictions was reconvicted within three years compared to 18% of the non-Indigenous cohort. Of those with 10 or more prior convictions, 83% of the Indigenous cohort was reconvicted compared to 76% of the non-Indigenous cohort (Table 7).
Notably, of those with the fewest prior convictions (i.e., one or less), twice as many Indigenous (22%) as non-Indigenous (11%) people were reconvicted for an administration of justice offence within three years (Table 7). In other words, new administration of justice convictions were disproportionately incurred by Indigenous compared to non-Indigenous people, even when they had little criminal history prior to their involvement in corrections. This is in line with evidence that Indigenous people are more likely than non-Indigenous people to be convicted of administration of justice offences (Alberta Solicitor General and Public Security, 2012). Potential explanations for this discrepancy have been proposed by researchers, including inappropriate or unrealistic conditions (e.g., requiring someone with substance use issues to refrain from all drugs and alcohol) and a lack of culturally appropriate supports in the community (e.g., mental health services; Alberta Solicitor General and Public Security, 2012; Orsi & April, 2013).
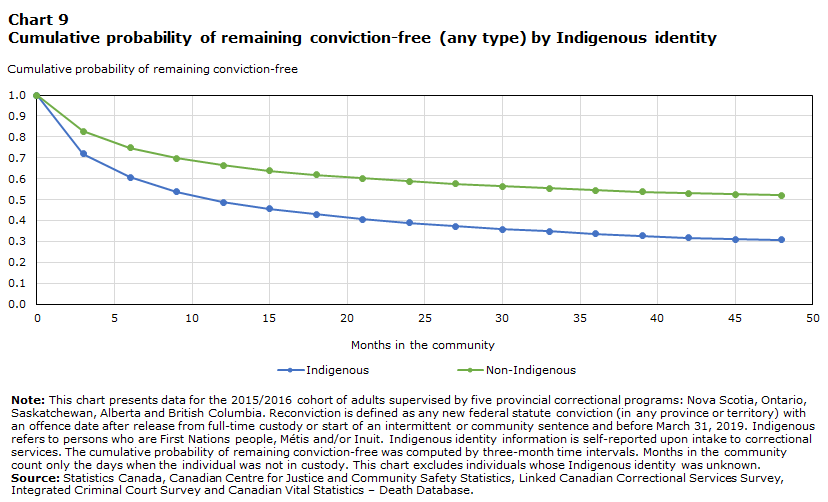
Risk of reconviction was higher for Indigenous people throughout the follow-up period
The probability of reconviction was higher for Indigenous than non-Indigenous people throughout the follow-up period, particularly within the first three months following release from full-time custody or the start of an intermittent or community sentence (Chart 9). Specifically, the Indigenous cohort had a 28% chance of being reconvicted within the first three months compared to the non-Indigenous cohort, which had a 17% chance of being reconvicted within the same timeframe. In fact, it took more than six months for 28% of the non-Indigenous cohort to be reconvicted, more than double the amount of time it took for this proportion to be reconvicted in the Indigenous cohort.
Chart 9 start
Data table for Chart 9
| Months in the community | Indigenous | Non-Indigenous |
|---|---|---|
| Cumulative probability of remaining conviction-free | ||
| 0 | 1.0 | 1.0 |
| 3 | 0.7 | 0.8 |
| 6 | 0.6 | 0.7 |
| 9 | 0.5 | 0.7 |
| 12 | 0.5 | 0.7 |
| 15 | 0.5 | 0.6 |
| 18 | 0.4 | 0.6 |
| 21 | 0.4 | 0.6 |
| 24 | 0.4 | 0.6 |
| 27 | 0.4 | 0.6 |
| 30 | 0.4 | 0.6 |
| 33 | 0.3 | 0.6 |
| 36 | 0.3 | 0.5 |
| 39 | 0.3 | 0.5 |
| 42 | 0.3 | 0.5 |
| 45 | 0.3 | 0.5 |
| 48 | 0.3 | 0.5 |
|
Note: This chart presents data for the 2015/2016 cohort of adults supervised by five provincial correctional programs: Nova Scotia, Ontario, Saskatchewan, Alberta and British Columbia. Reconviction is defined as any new federal statute conviction (in any province or territory) with an offence date after release from full-time custody or start of an intermittent or community sentence and before March 31, 2019. Indigenous refers to persons who are First Nations people, Métis and/or Inuit. Indigenous identity information is self-reported upon intake to correctional services. The cumulative probability of remaining conviction-free was computed by three-month time intervals. Months in the community count only the days when the individual was not in custody. This chart excludes individuals whose Indigenous identity was unknown. Source: Statistics Canada, Canadian Centre for Justice and Community Safety Statistics, Linked Canadian Correctional Services Survey, Integrated Criminal Court Survey and Canadian Vital Statistics – Death Database. |
||
Chart 9 end
Risk of reconviction remained higher for Indigenous than non-Indigenous people after controlling for age, gender, type of correctional supervision and criminal history characteristics
Further analyses were conducted to determine the risk of reconviction after controlling for other demographic and criminal history characteristics. After accounting for age, gender, type of correctional supervision and criminal history, the risk of reconviction was 30% higher on average for Indigenous people compared to non-Indigenous people at any given point during the follow-up period (Table 8). The relative difference in risk between these groups was the highest for new convictions for violent offences (38% higher), followed by administration of justice offences (33% higher) and other Criminal Code and federal statute offences (15% higher). There was no statistically significant difference in risk between Indigenous and non-Indigenous people for new convictions for property offences.
Section 4.2: Comparison of Indigenous, Black and other racialized groups with White people in the cohort
The following analyses compared Indigenous, Black and other racialized groups to White people in the cohort for the four provincial correctional programs for which information on both Indigenous identity and racialized groups was available. With respect to racialized groupsNote , 7% of the cohort was Black, with the other racialized groups (i.e., South Asian, Latin American, East or Southeast Asian, Arab or West Asian, and racialized group not specified) each representing less than 3% of the cohort (Table 9; see Appendix C for a provincial breakdown). Racialized groups other than Black were combined for reconviction analyses due to the small number in each group. Indigenous and White (i.e., those who identified as neither Indigenous nor with a racialized group) groups were included for comparison. Across the four provinces, 21% of the cohort was Indigenous, which is slightly lower than when all five provinces were considered (25%). This is primarily explained by the exclusion of Saskatchewan, which had the highest relative proportion of Indigenous people. Finally, White people represented 65% of the cohort.
Incidence of reconviction was similar between Black and White people in the cohort and was lowest for other racialized groups
When comparing Black and White people in the cohort, there was almost no difference in the one-year (35% and 36%), two-year (44% for both), and three-year (49% vs. 48%) incidence of any reconviction (Table 10). These findings are consistent with federal corrections data showing that Black people and White people return to federal custody at similar rates after warrant expiry (Office of the Correctional Investigator, 2022).
When looking at the different types of new convictions, convictions for property offences were slightly more common among the White cohort, whereas convictions for violent offences were slightly more common among the Black cohort. For example, 28% of the White cohort had a new conviction for a property offence after three years compared to 24% of the Black cohort, and 24% of the Black cohort had a new conviction for a violent offence compared to 19% of the White cohort (Table 10).
Other racialized groups had the lowest incidence of reconviction after one year (25%), two years (31%), and three years (35%), and this was true for all types of new convictions (Table 10).
Risk of reconviction was similar for Black people and White people throughout the follow-up period
Over the follow-up period, Indigenous people had the highest cumulative probability of reconviction (i.e., 1 minus the cumulative probability of remaining conviction-free), followed by Black people and White people; other racialized groups had the lowest probability of reconviction throughout the follow-up period (Chart 10). Notably, an almost identical proportion of Black people and White people were reconvicted over time. Specifically, an estimated 17% of Black and 19% of White people in the cohort were reconvicted within three months, 27% of both groups were reconvicted within six months, 32% of Black and 33% of White people within nine months, and so on until approximately half of both groups (52% of Black and 51% of White) were reconvicted within 48 months. Among the other racialized groups, an estimated 13% were reconvicted within three months, 19% within six months, 23% within nine months, and so on until an estimated 37% were reconvicted within 48 months.
As illustrated by the steeper decline in cumulative probability of remaining conviction-free for all groups at the start of the follow-up period (Chart 10), probability of reconviction was the highest in the first three months and declined over time. For example, probability of reconviction was at least 1.5 times higher in the first three months compared to the following three-month period for Black people (0.17 vs. 0.11) and people from other racialized groups (0.13 vs. 0.07), as well as for Indigenous (0.29 vs. 0.16) and White (0.19 vs. 0.10) people (probabilities not shown in Chart).
Chart 10 start

Data table for Chart 10
| Months in the community | Population group | |||
|---|---|---|---|---|
| Indigenous | Black | Other racialized group | White | |
| Cumulative probability of remaining conviction-free | ||||
| 0 | 1.0 | 1.0 | 1.0 | 1.0 |
| 3 | 0.7 | 0.8 | 0.9 | 0.8 |
| 6 | 0.6 | 0.7 | 0.8 | 0.7 |
| 9 | 0.5 | 0.7 | 0.8 | 0.7 |
| 12 | 0.5 | 0.6 | 0.7 | 0.6 |
| 15 | 0.5 | 0.6 | 0.7 | 0.6 |
| 18 | 0.4 | 0.6 | 0.7 | 0.6 |
| 21 | 0.4 | 0.6 | 0.7 | 0.6 |
| 24 | 0.4 | 0.5 | 0.7 | 0.6 |
| 27 | 0.4 | 0.5 | 0.7 | 0.5 |
| 30 | 0.4 | 0.5 | 0.7 | 0.5 |
| 33 | 0.4 | 0.5 | 0.7 | 0.5 |
| 36 | 0.3 | 0.5 | 0.7 | 0.5 |
| 39 | 0.3 | 0.5 | 0.6 | 0.5 |
| 42 | 0.3 | 0.5 | 0.6 | 0.5 |
| 45 | 0.3 | 0.5 | 0.6 | 0.5 |
| 48 | 0.3 | 0.5 | 0.6 | 0.5 |
|
Note: This chart presents data for the 2015/2016 cohort of adults supervised by four provincial correctional programs: Nova Scotia, Ontario, Alberta and British Columbia. Saskatchewan does not provide data on racialized groups, therefore, the cohort from Saskatchewan was excluded. Indigenous refers to persons who are First Nations people, Métis and/or Inuit. In this chart, the Indigenous category includes Indigenous persons who also identified with a racialized group (e.g., Black) as the data did not allow for these individuals to be examined separately. The other racialized group category includes South Asian, Latin American, East Asian, Southeast Asian, Arab, West Asian, and racialized group not specified. The concept of racialized groups was measured using the ‘visible minorities' standard. The Employment Equity Act defines visible minorities as “persons, other than Aboriginal peoples, who are non-Caucasian in race or non-white in colour.” Indigenous identity and racialized group information is self-reported by persons supervised upon intake to correctional services. White refers to individuals who identified as neither Indigenous nor with a racialized group. Reconviction is defined as any new federal statute conviction (in any province or territory) with an offence date after release from full-time custody or start of an intermittent or community sentence and before March 31, 2019. The cumulative probability of remaining conviction-free was computed by three-month time intervals. Months in the community count only the days when the individual was not in custody. This chart excludes individuals whose population group was unknown. Source: Statistics Canada, Canadian Centre for Justice and Community Safety Statistics, Linked Canadian Correctional Services Survey, Integrated Criminal Court Survey and Canadian Vital Statistics – Death Database. |
||||
Chart 10 end
After controlling for age, gender, type of correctional supervision and criminal history characteristics, Black people in the cohort were less likely to be reconvicted than White people
Analyses were also conducted to examine whether risk of reconviction is associated with select socio-demographic characteristics. After controlling for age, gender, type of correctional supervision and criminal history, the risk of any reconviction was 8% lower on average for Black compared to White people at any given point during the follow-up period (Table 11). In other words, whereas risk of reconviction was almost identical between Black and White people before controlling for these characteristics (as shown in Chart 10), the current analysis revealed that Black people were actually less likely to be reconvicted when these characteristics were held constant between groups. This is partially explained by the higher proportion of younger (18 to 34) men in the Black cohort (60%) relative to the White cohort (42%) as these demographic characteristics are associated with a higher risk of reconviction.
When further broken down by type of new conviction, Black people had a 20% lower risk of having a new property crime conviction, 12% lower risk of another Criminal Code or federal statute conviction, and 11% lower risk of an administration of justice conviction (Table 11). In contrast, relative to White people in the cohort, Black people had, on average, a 17% higher risk of incurring a new conviction for a violent offence.
These findings suggest that reconvictions may not be a leading factor in the overrepresentation of Black people in the correctional system, and that processes at other stages of the criminal justice system may contribute to a greater extent. Some examples of other potential contributors to the overrepresentation of Black people in the correctional system include disproportionately high rates of police contact, being overrepresented as accused in criminal court, and receiving disproportionately harsher and longer sentences upon conviction (Cotter, 2022; Saghbini & Paquin-Marseille, 2023; Wortley & Owusu-Bempah, 2022).
Risk of reconviction remained lower for other racialized groups than for White people after controlling for age, gender, type of correctional supervision and criminal history characteristics
After controlling for age, gender, type of correctional supervision and criminal history, the risk of any new conviction was 17% lower on average for other racialized groups relative to White people, and this pattern of results was consistent regardless of the type of new conviction (Table 11). Additionally, in line with the results presented earlier comparing Indigenous and non-Indigenous people, Indigenous people were on average 26% more likely to be reconvicted than White people after controlling for age, gender, type of correctional supervision and criminal history.
Summary
This study was a collaboration between Statistics Canada and Public Safety Canada as part of a larger project aiming to develop ongoing indicators of re-contact with the criminal justice system by linking national criminal justice and socioeconomic data. This is the first article to be published from this work. It is also the first study to provide statistics on new convictions following provincial correctional involvement in a cohort spanning multiple provinces.
Results showed that half of the study cohort was reconvicted within three years of being released from custody or starting an intermittent or community sentence. Individuals who served a custody sentence were more likely to have a new conviction and were reconvicted more quickly than those serving a community sentence. Administration of justice offences were the most common type of new conviction and new convictions for violent offences were the least common. Nonetheless, 1 in 5 people in the cohort had a new conviction for a violent offence within three years. Criminal history and age were found to be strong predictors of reconviction, regardless of the type of new conviction. Gender had a more complex relationship with reconviction. After accounting for age, type of correctional sentence and criminal history characteristics, men had a higher risk of being convicted of a new violent offence, as well as other Criminal Code or federal statute offences. In contrast women were more likely to be reconvicted for new property and administration of justice offences.
Given the over-representation of Indigenous and Black people in the criminal justice system, it was important to examine the experiences of these groups separately. Many factors contribute to the over-representation of these groups, including the historic and ongoing impacts of colonialism, racism and systemic discrimination. Results showed that Indigenous people were more likely to have a new conviction during the follow-up period and that they were reconvicted more quickly than non-Indigenous people. These findings suggest that reconviction may be a contributing factor in the over-representation of Indigenous people in the criminal justice system. Organizations and researchers have suggested that community-developed, trauma-informed and culturally appropriate programming could help to reduce reconviction, and that the programming that is currently available may not meet the needs of Indigenous people in the correctional system (Gutierrez et al., 2018; Trevethan & Maxwell, 2023). In line with this perspective, initiatives that have supported Indigenous communities in developing and implementing their own community-based justice programs have shown promising results (Department of Justice Canada, 2017).
Although Black people are also overrepresented in the criminal justice system, they had almost the same incidence of reconviction compared to White people. Furthermore, after controlling for age, gender, type of correctional supervision and criminal history characteristics, Black people had a lower risk of reconviction on average relative to their White counterparts. Together, these results suggest that reconviction may not be a key factor in the over-representation of Black people in the criminal justice system. Examining re-contact at other stages of the criminal justice process, including arrests and charges, could potentially provide more insight into the drivers behind the overrepresentation of Black people throughout the criminal justice system.
Importantly, the data used in this study did not allow for analyses to directly account for the historic and ongoing impacts of colonialism, racism, systemic discrimination, and the broader socioeconomic context that inevitably contribute to criminal justice system involvement and the overrepresentation of Indigenous and Black people in the system. Future studies will explore the intersections between these factors and the criminal justice system in order to quantify the impact of cross-group differences in factors such as education and employment on justice system re-contact. Subsequent Juristat articles and products using the integrated criminal justice data will also explore other measures of re-contact, including arrests and charges, as well as pathways through the system from policing to corrections.
Detailed data tables
Table 1 Cohort characteristics by type of correctional supervision
Table 3 Three-year incidence of reconviction by age group and type of new conviction
Table 6 Models predicting new convictions from demographic and criminal history factors
Table 9 Cohort population groups by type of correctional supervision
Appendix A Cohort characteristics by province and type of correctional supervision
Appendix C Cohort population groups by province and type of correctional supervision
Data sources and methodology
Canadian Correctional Services Survey
The Canadian Correctional Services Survey (CCSS) is an administrative survey conducted by the CCJCSS that collects data from correctional services across Canada, including characteristics of people being supervised and their legal hold statuses. The CCSS currently includes correctional service program data from British Columbia, Alberta, Saskatchewan, Ontario (adult data only), Nova Scotia and Newfoundland and Labrador (youth data only) beginning in 2015/2016. This report only includes data from adult correctional supervision programs and as such, data from Newfoundland and Labrador were excluded from this study.
Integrated Criminal Court Survey
The Integrated Criminal Courts Survey (ICCS) is an administrative survey conducted by the CCJCSS. It collects data on appearances and charges in youth courts and adult criminal courts. As of April 1, 2005, criminal courts in all ten provinces and three territories reported to the survey. However, information is not available from superior courts in Ontario, Manitoba, Saskatchewan and Prince Edward Island (until 2018/2019), nor from municipal courts in Québec. Together, these represent a very small proportion of all criminal court cases in Canada.
Canadian Vital Statistics – Death database
The Canadian Vital Statistics – Death (CVSD) database is an administrative survey that collects demographic and medical (cause of death) information annually and monthly from all provincial and territorial vital statistics registries on all deaths in Canada.
Linkage file: CCSS, ICCS and CVSD
The CCSS (2015/2016 to 2020/2021) was linked to the ICCS (2005/2006 to 2020/2021) and the CVSD (2015 to 2020) through the Social Data Linkage Environment (SDLE), a highly secure environment that facilitates the creation of linked population data files for social analysis. Specifically, each file is linked to a secure repository of personal identifiers in the SDLE, after which each person is assigned a unique, anonymous key that allows their data to be integrated with other files within the SDLE.
The target population for this study was drawn from the CCSS records that linked to the secure repository of personal identifiers in the SDLE (96%). Specifically, the target population consists of adults supervised by five provincial correctional programs (Nova Scotia, Ontario, Saskatchewan, Alberta and British Columbia) who experienced at least one of the following correctional events in fiscal year 2015/2016:
- Release from full-time custody into the community (with or without conditions);
- Start of an intermittent sentence (i.e., a custody sentence that is served intermittently, such as on the weekends);
- Start of a community supervision sentence (i.e., conditional sentence or probation).
Individuals from the CCSS were then linked to the ICCS through the SDLE. The linkage rate between the ICCS and the secure repository of personal identifiers in the SDLE is 81%. The relatively lower linkage rate between the ICCS and the SDLE is primarily due to jurisdiction-specific gaps in key personal identifiers required for record linkage (e.g., names, date of birth, gender, geography). When key personal identifiers were available, linkage rates were typically above 90%. Notably, Alberta only started reporting names to the ICCS in 2019/2020; therefore, a coded algorithm containing anonymized name information (i.e., Soundex) was used in the linkage instead of names prior to 2019/2020, resulting in a lower average linkage rate from 2005/2006 to 2018/2019. Similarly, Saskatchewan did not report names to the ICCS until 2009/2010 and Québec did not report names until 2012/2013, resulting in lower linkage rates for earlier years in these provinces. Additionally, average linkage rates were relatively lower in the Northwest Territories and Nunavut due to specific gaps and limitations in personal identifiers for certain years.
To minimize any potential bias introduced by varying linkage rates, individuals were excluded from the study cohort if they could not be linked to any convictions in the ICCS prior to their release from full-time custody or start of an intermittent or community sentence. Because everyone serving a sentence in the correctional system would be expected to have at least one criminal court conviction prior to their correctional supervision, the absence of any prior convictions could indicate that not enough information was available in the ICCS to link that person to their prior convictions as well as potential reconvictions. Between 96% and 98% of the target population supervised by provincial correctional programs in Nova Scotia, Ontario, Saskatchewan and British Columbia linked to at least one prior conviction. Because less detailed person-level information was available for Alberta ICCS data prior to 2019/2020, a smaller proportion of the study cohort from Alberta (86%) linked to a prior conviction in the ICCS.
Given that some individuals from the target population were excluded from the study cohort because they did not link to a prior conviction in the ICCS, differences between these individual and those who were retained in the cohort could impact the representativeness of the findings. Analyses showed that individuals who were excluded from the cohort due to not linking to the ICCS were more likely to have been sentenced to community supervision only (vs. custody), women (vs. men), non-Indigenous (vs. Indigenous), and 25 or older (vs. 18 to 24). As these characteristics have previously been associated with a lower risk of reconviction (e.g., Bonta et al., 2003; Stewart et al., 2019), it is possible that the study cohort represents a slightly higher risk population than the originally defined target population. Nevertheless, including individuals who did not link to a prior conviction in the ICCS would have introduced a downward bias in the estimate of reconviction rates. Indeed, reconviction rates were much lower than expected for this group.
Lastly, the study cohort was linked to the CVSD to identify deaths that occurred during the follow-up period. The linkage rate between the CVSD and the secure repository of personal identifiers in the SDLE is 99%.
References
Alberta Solicitor General and Public Security. (2012). A study of Aboriginal administration of justice offences as they relate to community supervision provided by probation officers in Alberta. Alberta Justice and Attorney General. https://open.alberta.ca/dataset/53799df7-debe-42c1-8b22-190baae2820a/resource/9cf496c7-7fba-4b23-bfc3-3a34eb4e8f63/download/2012-aajo-report-finalaug2012.pdf
Allen, M. (2016). Young adult offenders in Canada, 2014. Juristat. Statistics Canada catalogue no. 85-002-X. https://www150.statcan.gc.ca/n1/pub/85-002-x/2016001/article/14561-eng.htm
Allen, M. (2020). Socioeconomic circumstances of youth who participated in restorative justice in Nova Scotia, 2009/2010. Juristat. Statistics Canada catalogue no. 85-002-X. https://www150.statcan.gc.ca/n1/pub/85-002-x/2020001/article/00002-eng.htm
Bonta, J., & Andrews, D. A. (2023). The psychology of criminal conduct (7th ed.). Routledge.
Bonta, J., Rugge, T., & Dauvergne, M. (2003). The reconviction rate of federal offenders. Solicitor General Canada. https://www.publicsafety.gc.ca/cnt/rsrcs/pblctns/rcnvctn-rt-fdrl/index-en.aspx
Boyce, J., Brennan, S. & Te, S. (2018). Economic profiles of offenders in Saskatchewan. Juristat. Statistics Canada catalogue no. 85-002-X. https://www150.statcan.gc.ca/n1/pub/85-002-x/2018001/article/54976-eng.htm
Brennan, S. & Matarazzo, A. (2016). Re-contact with the Saskatchewan justice system. Juristat. Statistics Canada catalogue no. 85-002-X. https://www150.statcan.gc.ca/n1/pub/85-002-x/2016001/article/14633-eng.htm
Burczycka, M. & Munch, C. (2015). Trends in offences against the administration of justice. Juristat. Statistics Canada catalogue no. 85-002-X. https://www150.statcan.gc.ca/n1/pub/85-002-x/2015001/article/14233-eng.htm
Canadian Heritage. (2019). Building a Foundation for Change: Canada's Anti-Racism Strategy 2019-2022. https://www.canada.ca/en/canadian-heritage/campaigns/anti-racism-engagement/anti-racism-strategy.html
Chartrand, V. (2019). Unsettled times: Indigenous incarceration and the links between colonialism and the penitentiary in Canada. Canadian Journal of Criminology and Criminal Justice, 61(3), 67-89. https://doi.org/10.3138/cjccj.2018-0029
Clark, S. (2019). Overrepresentation of Indigenous people in the Canadian criminal justice system: Causes and responses. Department of Justice Canada. https://www.justice.gc.ca/eng/rp-pr/jr/oip-cjs/index.html
Cotter, A. (2022). Experiences of discrimination among the Black and Indigenous populations in Canada, 2019. Juristat. Statistics Canada catalogue no. 85-002-X. https://www150.statcan.gc.ca/n1/pub/85-002-x/2022001/article/00002-eng.htm
Commission on Systemic Racism in the Ontario Criminal Justice System. (1995). Report of the Commission on Systemic Racism in the Ontario Criminal Justice System. Queen's Printer for Ontario. https://archive.org/details/reportracismont00comm/page/n21/mode/2up
David, J.-D. & Jaffray, B. (2022). Homicide in Canada, 2021. Juristat. Statistics Canada catalogue no. 85-002-X. https://www150.statcan.gc.ca/n1/pub/85-002-x/2022001/article/00015-eng.htm
David, J.-D. & Mitchell, M. (2021). Contacts with the police and the over-representation of Indigenous peoples in the Canadian criminal justice system. Canadian Journal of Criminology and Criminal Justice, 63(2), 23-45. https://doi.org/10.3138/cjccj.2020-0004
Department of Justice Canada. (2017). Evaluation of the Aboriginal Justice Strategy December 2016. https://www.justice.gc.ca/eng/rp-pr/cp-pm/eval/rep-rap/2016/ajs-sja/ajs-sja.pdf
Department of Justice Canada. (2018). Administration of justice offences. Research at a Glance. https://www.justice.gc.ca/eng/rp-pr/jr/rg-rco/2018/mar03.html
Department of Justice Canada. (2022). Overrepresentation of Black people in the Canadian criminal justice system. https://www.justice.gc.ca/eng/rp-pr/jr/obpccjs-spnsjpc/index.html
Department of Justice Canada. (2023). Indigenous Justice Strategy: What we learned Wave 1 Justice Canada-led engagement. https://www.justice.gc.ca/eng/csj-sjc/ijr-dja/ijs-sja/rep-rap/wave1-phase1/summary-sommaire.html
Flores, A. W., Holsinger, A. M., Lowenkamp, C. T., & Cohen, T. H. (2017). Time-free effects in predicting recidivism using both fixed and variable follow-up periods: Do different methods produce different results.Criminal Justice and Behavior, 44(1), 121-137. https://doi.org/10.1177/0093854816678649
Government of Ontario. (2021). Data Standards for the Identification and Monitoring of Systemic Racism. Government of Ontario. https://www.ontario.ca/document/data-standards-identification-and-monitoring-systemic-racism
Gutierrez, L., Chadwick, N., & Wanamaker, K. A. (2018). Culturally relevant programming versus the status quo: A meta-analytic review of the effectiveness of treatment of Indigenous offenders. Public Safety Canada. https://publications.gc.ca/collections/collection_2021/sp-ps/PS18-40-2018-eng.pdf
Hanson, R. K. (2002). Recidivism and age: Follow-up data from 4,673 sexual offenders.Journal of Interpersonal Violence, 17(10), 1046-1062. https://journals.sagepub.com/doi/10.1177/08862605-0201710-02
Hanson, R. K., Harris, A. J. R., Letourneau, E., Helmus, L. M., & Thornton, D. (2018). Reductions in risk based on time offense-free in the community: Once a sexual offender, not always a sexual offender.Psychology, Public Policy, and Law, 24(1), 48-63. https://doi.org/10.1037/law0000135
Harris, A. J. R., & Hanon, R. K. (2004). Sex offender recidivism: A simple question. Public Safety Canada. https://www.publicsafety.gc.ca/cnt/rsrcs/pblctns/sx-ffndr-rcdvsm/index-en.aspx
Houle, R. (2020). Changes in the socioeconomic situation of Canada’s Black population, 2001 to 2016. Ethnicity, Language and Immigration Thematic Series (Catalogue no. 89-657-X2020001). Statistics Canada. https://www150.statcan.gc.ca/n1/pub/89-657-x/89-657-x2020001-eng.htm
Humphries, J. E., Ouss, A., Stavreva, K., Stevenson, M., & van Dijk, W. (2023). Conviction, incarceration, and recidivism: Understanding the revolving door. Social Science Research Network. http://dx.doi.org/10.2139/ssrn.4507597
Ibrahim, D. (2019). Youth re-contact with the Nova Scotia justice system, 2012/2013 to 2014/2015. Juristat. Statistics Canada catalogue no. 85-002-X. https://www150.statcan.gc.ca/n1/pub/85-002-x/2019001/article/00003-eng.htm
Institute for Research on Public Policy. (2018).Rethinking Criminal Justice in Canada. https://doi.org/10.26070/b66q-1d11
McCullough, S. & McRae, M. (2023). The story of Black slavery in Canadian history. Canadian Museum for Human Rights. https://humanrights.ca/story/story-black-slavery-canadian-history
Melvin, A. (2023). Postsecondary educational attainment and labour market outcomes among Indigenous peoples in Canada, findings from the 2021 Census. Insights on Canadian Society (Catalogue no. 75-006-X). Statistics Canada. https://www150.statcan.gc.ca/n1/pub/75-006-x/2023001/article/00012-eng.htm
Millar, P., & Owusu-Bempah, A. (2011). Whitewashing criminal justice in Canada: Preventing research through data suppression. Canadian Journal of Law and Society, 26(3), 653-661. https://doi.org/10.3138/cjls.26.3.653
Mooten, N. (2021). Racism, discrimination and migrant workers in Canada: Evidence from the literature. Immigration, Refugees and Citizenship Canada. https://www.canada.ca/en/immigration-refugees-citizenship/corporate/reports-statistics/research/racism-discrimination-migrant-workers-canada-evidence-literature.html
National Inquiry into Missing and Murdered Indigenous Women and Girls (2019). Reclaiming power and place: The final report of the National Inquiry into Missing and Murdered Indigenous Women and Girls. https://www.mmiwg-ffada.ca/final-report/
National Reentry Resource Center (n.d.). Building second chances: Tools for local reentry coalitions. Bureau of Justice Assistance: U.S. Department of Justice. https://nationalreentryresourcecenter.org/sites/default/files/inline-files/buildingSecondChancesReentryToolkit_508.pdf
Office of the Correctional Investigator (2018). Office of the Correctional Investigator Annual Report 2017-2018 https://oci-bec.gc.ca/en/content/office-correctional-investigator-annual-report-2017-2018
Office of the Correctional Investigator (2022). Office of the Correctional Investigator Annual Report 2021-2022. https://oci-bec.gc.ca/en/content/office-correctional-investigator-annual-report-2021-2022
Ontario Association of Children's Aid Societies. (2016). One vision one voice: Changing the Ontario child welfare system to better serve African Canadians. https://www.oacas.org/programs-and-resources/onevisiononevoice/
Orsi, M. & April, S. (2013). Administration of justice offences among Aboriginal people: Court officials’ perspective. Department of Justice Canada. https://publications.gc.ca/collections/collection_2018/jus/J4-77-2013-eng.pdf
Owusu-Bempah, A., & Jeffers, S. (2022). Black youth and the criminal justice system: Summary report of an engagement process in Canada. Department of Justice Canada. https://www.justice.gc.ca/eng/rp-pr/jr/bycjs-yncjs/index.html
Public Safety Canada Portfolio Corrections Statistics Committee. (2023). 2021 Corrections and Conditional Release Statistical Overview. Public Safety Canada. https://www.publicsafety.gc.ca/cnt/rsrcs/pblctns/ccrso-2021/index-en.aspx
R v. Ipeelee, 2012 SCC 13 (CanLII), [2012] 1 SCR 433. https://www.canlii.org/en/ca/scc/doc/2012/2012scc13/2012scc13.html
R v. Gladue, 1999 CanLII 679 (SCC), [1999] 1 SCR 688. https://www.canlii.org/en/ca/scc/doc/1999/1999canlii679/1999canlii679.html
Robinson, P., Small, T., Chen, A., and Irving, M. (2023). Over-representation of Indigenous persons in adult provincial custody, 2019/2020 and 2020/2021. Juristat. Statistics Canada catalogue no. 85-002-X. Statistics Canada. https://www150.statcan.gc.ca/n1/pub/85-002-x/2023001/article/00004-eng.htm#r22
Royal Commission on Aboriginal Peoples. (1996). The report of the Royal Commission on Aboriginal Peoples. https://www.bac-lac.gc.ca/eng/discover/aboriginal-heritage/royal-commission-aboriginal-peoples/Pages/final-report.aspx
Saghbini, C., Bressan, A., & Paquin-Marseille, L. (2021). Indigenous people in criminal court in Canada: An exploration using the relative rate index. Department of Justice Canada. https://www.justice.gc.ca/eng/rp-pr/jr/eurri-efitr/index.html
Saghbini, C., & Paquin-Marseille, L. (2023). Black people in criminal courts in Canada: An exploration using the relative rate index. Department of Justice Canada. https://www.justice.gc.ca/eng/rp-pr/jr/rrbb-bbrr/index.html
Sampson, R. J., & Laub, J. H. (2003). Life-course desisters? Trajectories of crime among delinquent boys followed to age 70.Criminology, 41(3), 555-592. https://onlinelibrary.wiley.com/doi/10.1111/j.1745-9125.2003.tb00997.x
Statistics Canada (2022, September 21). Indigenous population continues to grow and is much younger than the non-Indigenous population, although the pace of growth has slowed. The Daily. https://www150.statcan.gc.ca/n1/daily-quotidien/220921/dq220921a-eng.htm
Statistics Canada. (2022, October 26). The Canadian census: A rich portrait of the country's religious and ethnocultural diversity. The Daily. https://www150.statcan.gc.ca/n1/daily-quotidien/221026/dq221026b-eng.htm
Statistics Canada. (2023). Report and draft recommendations: Police-reported Indigenous and racialized identity statistics via the Uniform Crime Reporting Survey. Statistics Canada. https://www.statcan.gc.ca/en/consultation/2021/ucrs/report
Stewart, L. A., Wilton, G., Baglole, S., & Miller, R. (2019). A comprehensive study of recidivism rates among Canadian federal offenders (Research Report R-426). Correctional Service of Canada. https://www.csc-scc.gc.ca/research/005008-r426-en.shtml
Trevethan, S., & Maxwell, E. (2023). Crime prevention in Indigenous communities: An examination of culturally-relevant programs and culturally-competent evaluation approaches. Public Safety Canada. https://www.publicsafety.gc.ca/cnt/rsrcs/pblctns/2023-r009/index-en.aspx
Truth and Reconciliation Commission of Canada. (2015a). Honouring the truth, reconciling for the future: Summary of the final report of the Truth and Reconciliation Commission of Canada. https://publications.gc.ca/collections/collection_2015/trc/IR4-7-2015-eng.pdf
Truth and Reconciliation Commission of Canada. (2015b). Truth and Reconciliation Commission of Canada: Calls to action. https://publications.gc.ca/collections/collection_2015/trc/IR4-8-2015-eng.pdf
Working Group of Experts on People of African Descent. (2017). Report of the Working Group of Experts on People of African Descent on its mission to Canada. United Nations Human Rights Council. https://digitallibrary.un.org/record/1304262?ln=en
Wortley, S., & Owusu-Bempah, A. (2022). Race, police stops, and perceptions of anti-Black police discrimination in Toronto, Canada over a quarter century. Policing: An International Journal, 45(4), 570-585. https://www.emerald.com/insight/content/doi/10.1108/PIJPSM-11-2021-0157/full/html
Yukhnenko, D. Sridhar, S. & Fazel, S. (2019). A systematic review of criminal recidivism rates worldwide: 3-year update. Wellcome Open Research, 4(28). https://pubmed.ncbi.nlm.nih.gov/31544154/
- Date modified: