
Socioeconomic circumstances of youth who participated in restorative justice in Nova Scotia, 2009/2010

Archived Content
Information identified as archived is provided for reference, research or recordkeeping purposes. It is not subject to the Government of Canada Web Standards and has not been altered or updated since it was archived. Please "contact us" to request a format other than those available.
by Mary Allen
Youth growing up in difficult social and economic circumstances can face significant challenges. Poor socioeconomic conditions have an impact on child development, including children’s health as well as their readiness to learn (Conference Board of Canada n.d., Ferguson et al. 2007, Thomas 2006). Research has also found a link between literacy levels and educational attainment and the socioeconomic status of families and conditions in the communities where they live (Cartwright and Allen 2002, Frenette 2007). In addition, education levels and economic conditions also have a measurable impact on employment and future earnings potential (Berzin and De Marco 2009).
Many of the same social and economic factors have been found to play a role in youth involvement in crime and delinquency. A range of individual, family and community level factors either put youth at risk of delinquent behaviour, or act as protective factors to inhibit that behaviour. Research from other countries has identified various factors that potentially influence individuals’ paths to criminality, such as school attachment and aspirations, parental supervision, discipline, abuse or neglect, and delinquent peer groups, as well as neighbourhood factors related to low-income, crowded households and residential mobility (Farrington and Loeber 2000, Shader 2004). Canadian studies have identified similar factors in delinquency: academic performance and commitment, educational aspirations, family relationships and peer influences, as well as the characteristics of the neighborhoods where youth live (Charron 2011, Yessine 2011, Zeman and Bressan 2006).
Altogether, the interaction and cumulative nature of these and other factors can negatively impact the prospects of young people from marginalized backgrounds, and in particular those who commit crimes. In addition to the background factors that may have led youth to offend, how youth in conflict with the law are dealt with by the police and courts can also have long-term consequences. In particular, involvement in the criminal justice system—especially incarceration and long custodial sentences—has been shown to disrupt transitions into the adult roles associated with reduced delinquent behaviour and is instead associated with repeat offending (Massoglia and Uggen 2010, Holman and Zeidenburg 2013, Wilson and Hoge 2013).
In Canada, it has long been recognized that youth accused of crime should be treated differently by the justice system than their adult counterparts. The Youth Criminal Justice Act (YCJA) governs the treatment of youth offenders in Canada (aged 12 to 17).Note Its declaration of principle states that “the youth justice system is intended to protect the public by (i) holding young persons accountable through measures that are proportionate to the seriousness of the offence and the degree of responsibility of the young person, (ii) promoting the rehabilitation and reintegration of young persons, and (iii) supporting crime prevention by referring young persons to programs or agencies in the community to address the circumstances underlying their offending behaviour.” This is particularly important given that most adult offenders first offend as youth and intervention at an early age is seen as an effective way to reduce crime overall (Yessine 2011).
In this context, the development of effective programming for young offenders by the criminal justice system, as well as other agencies working with these youth, requires an understanding of the circumstances these youth tend to come from and the prospects they face. While there is much research on the factors behind delinquent behaviour, little research has been done in Canada to measure the actual characteristics of young offenders and their life circumstances. Moreover, there has been little research that examines the differences between male and female offenders. This is important because differences in the circumstances of male and female offenders may suggest the need for different gender-based approaches to policies and programs.
This Juristat article takes advantage of new statistical methods and access to new data sources to provide a more detailed picture of a set of youth in conflict with the law who participated in restorative justice (RJ) in Nova Scotia in 2009/2010.Note Using administrative data provided by the Nova Scotia Restorative Justice Program (NSRJP), this study looks at their socioeconomic circumstances both at the time of their RJ contact and as they transitioned into adulthood. In particular, the analysis examines the educational attainment of these youth, their family circumstances, employment and other sources of income, as well as selected experiences with the health system. In addition, the study takes a gender-based approach to identify important differences in the circumstances of the young men and women who participated in RJ.Note It should be noted that this study was restricted by the nature of available data on youth in conflict with the law: data was only available for offenders referred to restorative justice; information on a full cohort of youth in conflict with the law was not available.
The study also provides information on the comparable circumstances of a similarly aged cohort of Nova Scotia youth in order to show the degree to which the young offenders in this study were socially or economically marginalized compared to youth in general. This comparison is not an evaluation of the effectiveness of restorative justice programs as RJ programs are primarily focussed on addressing harm and finding resolution to a specific criminal incident and reducing the risk of re-offending, and are just one part of a multisystem approach to helping these young people. The disadvantages faced by these youth are a major challenge for social agencies in general and RJ is but one approach in preventing that disadvantage from getting worse.
It should also be noted that the information on this group of youth is not necessarily representative of youth in conflict with the law generally. It is not possible to identify if and how the situations and experiences of youth in conflict with the law who participated in RJ differed from those who did not. While RJ youth may have much in common with youth in conflict with the law generally, it is important to note that the characteristics that lead them to be referred to restorative justice programs in the first place, such as their criminal history or the circumstances of the incident, may be different from other youth in conflict with the law. RJ participants may have different risk factors compared to the many youth who are treated more leniently by police because of their age, or the nature of their crimes, or compared to those who proceed through the courts. Moreover, the study did not have information on other individual and family factors, community conditions, or other personal experiences or social interventions that might affect the circumstances of the RJ participants in early adulthood. For example, we do not have specific information about any mental health or developmental issues, academic performance, family background, peer group influences, school experiences, or support from social services or other agencies.
This article was made possible with funding from the Department of Public Safety Canada.
Start of text box 1
Text box 1
Restorative justice programs for youth
This study is based on available data on youth in conflict with the law who were referred to the Nova Scotia Restorative Justice Program (NSRJP) in 2009/2010. This text box provides a description of restorative justice and the NSRJP.
Under the YCJA, before a youth can be charged with a criminal offence in Canada, police and prosecutors must consider whether it is sufficient for the youth to be dealt with by other means (alternative measures). Restorative justice (RJ) in one of the alternative measures used to address youth offending and is an important tool for helping these youth, their victims, and their communities. RJ seeks to repair the harm done by the offender, offer healing for victims and the community, restore relationships, and reintegrate the offender into the community and prevent re-offending. Restorative justice programs are part of a broader system working to assist youth in conflict with the law, a particularly vulnerable group, in the context of the YCJA. While clearly not a single solution to the challenges that these youth face, RJ programs play a role in helping them.
The restorative justice process brings the relevant parties together (i.e. offender, victim, community members) to determine what happened, what the impact or harm was, and what can be done to address that harm to ensure a just outcome. A plan is developed and agreed upon by all parties; the completion of the plan leads to the RJ file being closed as successful. The extent and details of these plans will vary on a case-by-case basis. They may range from having successful discussions at the first meeting, to making a formal or informal apology, seeking treatment, making some form of restitution, and/or providing a personal or community service to those impacted. Parties other than the offender may have responsibilities detailed in the plan as well.
The nature of RJ programs differs across the country. A restorative justice program for youth was introduced in Nova Scotia as a pilot project in 1999 and then expanded across the province in 2001. A pilot program was introduced for adults in 2011 and was subsequently expanded province-wide in 2016. The Nova Scotia Restorative Justice Program is administered by eight community-based agencies. Note Youth can be referred at any point in the criminal justice process: pre- or post-charge, during sentencing, and after sentencing (corrections).Note Those accused of sexual offences or intimate partner violence are not accepted into these programs. In order to be eligible for the NSRJP, youth must freely consent to participate (not be forced) and must accept responsibility for the offence. In addition, the Crown must believe that there would be sufficient evidence to successfully prosecute the case (Nova Scotia Department of Justice 2018). More information on the current NSRJP can be found at Nova Scotia Restorative Justice Program.
Research has shown that RJ programs have an impact on reoffending. A recent report on “Youth re-contact with the Nova Scotia justice system 2012/2013 to 2014/2015” found that youth who went through the court system were more likely to have recontact with police than youth who were diverted from the courts into the NSRJP (Ibrahim 2019).
End of text box 1
Characteristics of youth referred to restorative justice
Age and gender profile of youth referred to the NSRJP similar to all youth accused
Information was not available to determine whether the socioeconomic circumstances of youth in conflict with the law who were referred to the NSRJP differed from other youth who had contact with the police or courts. However, basic information from the Uniform Crime Reporting Survey suggests that youth who were referred to the NSRJP for 2009/2010 were similar in terms of age, gender, and offence characteristics to all Nova Scotia youth accused by police in 2009.Note
The restorative justice administrative files include information on 944 youth aged 12 to 17 who were referred to the NSRJP with cases starting between April1, 2009 and March 31, 2010.Note The age and gender distribution of these youth was very similar to all youth accused by police in 2009.Note
About two-thirds (68%) of youth referred to RJ were male, slightly lower than among all youth accused of crimes in Nova Scotia (72%). In addition, just over half of the youth referred to RJ (54%) were aged 16 or 17, compared to 52% of all youth accused. There was little difference in the age distribution by gender, and the peak ages for girls (16) and boys (17) in RJ programs were similar to peak ages of offending among youth in Nova Scotia generally (Table 1).Note Note
No major difference in offence types between youth referred to restorative justice and youth accused of crime generally
The main types of crimes committed by the youth who were referred to RJ were typical of the offences generally committed by youth at the time. According to information from the administrative records of the Nova Scotia Restorative Justice Program, 60% of the youth referred to RJ in 2009/2010 had committed property crimes, while almost one-quarter (24%) of the youth referred to RJ had committed a violent offence. Most of those youth referred to RJ for violent offences had committed common assault (13% of RJ participants). Youth were less frequently referred to RJ for all other Criminal Code offences (8%) such as weapons possession, Criminal Code traffic offences, or violations related to the administration of justice such as failure to comply with an order. Another 8% of RJ youth were referred for drug crimes or violations of other federal statutes including the YCJA (Table 1).
Overall, the most frequent offences referred to RJ were the same as those committed by youth generally: mischief, theft of $5,000 or under, and common assault. Moreover, differences in the distribution of offences among male and female RJ participants also reflected youth crime generally. As with youth accused generally, the study found that there was a notable difference between the males and females referred to RJ by type of offence. Half (51%) of the female RJ referrals had committed theft of $5,000 or under; another 15% had committed common assault. Among male participants, the most frequent crimes committed were theft of $5,000 or under (19%), mischief (16%), breaking and entering (15%), and common assault (12%).
Overall, however, youth referred to RJ were somewhat more likely to have committed property crimes (60% versus 49% of all youth accused of crime), and slightly less likely to have committed a violent crime (24% versus 25%). This difference in the proportion committing property crimes is due to the fact that, among non-violent offenders, other non-violent crimes (not property) make up a smaller proportion of offences, mostly because relatively few RJ referrals are for violations related to the administration of justice.
Start of text box 2
Text box 2
Note on changes in youth crime since 2009
Youth crime rates in Canada have fallen substantially since 2009. As a result, the findings from this analysis may not apply to more recent RJ participants. Nationally, the rate of youth accused of crime fell 48% between 2009 and 2018 (Chart 1). The decrease was even greater in Nova Scotia (-59%). The decrease was greatest for property crime, which fell 69% in Nova Scotia over the same time period.
Chart 1 start
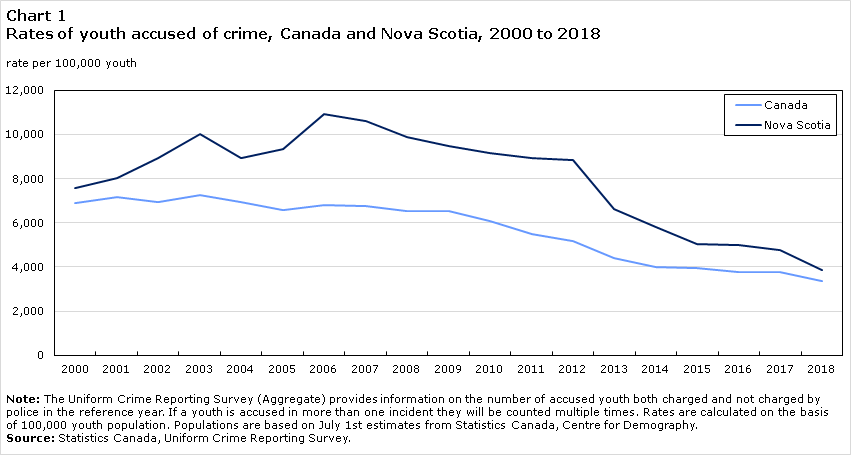
Data table for Chart 1
| Canada | Nova Scotia | |
|---|---|---|
| rate per 100,000 youth | ||
| 2000 | 6,914 | 7,594 |
| 2001 | 7,159 | 8,013 |
| 2002 | 6,945 | 8,937 |
| 2003 | 7,280 | 10,035 |
| 2004 | 6,959 | 8,932 |
| 2005 | 6,596 | 9,332 |
| 2006 | 6,809 | 10,940 |
| 2007 | 6,770 | 10,589 |
| 2008 | 6,537 | 9,877 |
| 2009 | 6,515 | 9,478 |
| 2010 | 6,078 | 9,150 |
| 2011 | 5,486 | 8,926 |
| 2012 | 5,165 | 8,837 |
| 2013 | 4,392 | 6,629 |
| 2014 | 4,016 | 5,818 |
| 2015 | 3,946 | 5,053 |
| 2016 | 3,767 | 4,990 |
| 2017 | 3,766 | 4,753 |
| 2018 | 3,372 | 3,861 |
|
Note: The Uniform Crime Reporting Survey (Aggregate) provides information on the number of accused youth both charged and not charged by police in the reference year. If a youth is accused in more than one incident they will be counted multiple times. Rates are calculated on the basis of 100,000 youth population. Populations are based on July 1st estimates from Statistics Canada, Centre for Demography. Source: Statistics Canada, Uniform Crime Reporting Survey. |
||
Chart 1 end
Between 2009/2010 and 2017/2018, the incarceration rate for young persons in Nova Scotia provincial correctional services declined by 48%. In fact, over this period, the average daily count of youth in sentenced secure custody in Nova Scotia decreased from 5.9 youths in 2009/2010 to 1.2 youths in 2017/2018.
Not only has the decline in police-reported youth crime had an impact on the types of offences involving youth, with relatively fewer youth accused of property crime, but it also had an impact on the age profile of individuals accused of crime. In 2009, rates of individuals accused of crime were notably higher among older youth than among young adults in their 20s. However, this is no longer the case. It is important to recognize, therefore, that the profile of youth committing crimes and participating in RJ has changed over the past decade, and the findings in this article, which is based on 2009/2010 data, may not be the same for youth participating in the NSRJP in more recent years.
End of text box 2
Start of text box 3
Text box 3
Analysis of socioeconomic characteristics using linked data
New methods of data analysis and access to new data sources have allowed the Canadian Centre for Justice and Community Safety Statistics (CCJCSS)Note at Statistics Canada to pull together information from a variety of sources in order to look at what happens to offenders after their first observed contact with police. Previously, information was only available on whether individuals accused in criminal incidents were charged, or, in the case of youth, what alternative measures were used by police.
However, the ability to link data to other sources has broadened opportunities for research. In some studies, the CCJCSS has been able to link individuals to more than one incident as well as examine their pathways through the justice system from police to courts to corrections. A 2016 study, for example, examined the justice system contact of offenders in Saskatchewan, with a focus on any re-contact they had with the justice system (Brennan and Matarazzo 2016). A similar analysis examined a cohort of youth in contact with police in Nova Scotia in 2012/2013 (Ibrahim 2019). Methods have also been developed to permit linking of individual information from various data sources such as tax files and Census records while protecting their privacy.
The current Juristat article examines the socioeconomic characteristics of a cohort of youth aged 12 to 17 who participated in the Nova Scotia Restorative Justice Program (NSRJP) in 2009/2010 both around the time of their offences and later when they were young adults. It links administrative records from the NSRJP to the 2006 Canadian Marginalization Index (CAN-Marg), the 2009 and 2015 T1 Family File (T1FF), the 2016 Census of Population, as well as administrative records from the Canadian Institute for Health Information’s Discharge Abstract Database (DAD) and National Ambulatory Care Reporting System (NACRS) for 2008 through 2016 (see the “Data sources” and “Methodology” sections). The 2009/2010 NSRJP data was not linked to police or courts data. Therefore, information on the experience of these youth in the criminal justice system is not available.
The cohort examined in this article is sometimes referred to as the RJ cohort, RJ youth, and RJ participants (those accepted into the program).
Statistics Canada’s commitment to data security and protection of confidentiality
As part of Statistics Canada’s mandate, guaranteeing the security of sensitive statistical information is a top priority. The following measures are implemented in adherence to Statistics Canada’s Directive on Microdata Linkage.
- Access to data for Statistics Canada employees requires justification and approval by senior management (Director and above). Employee access to data is also time bound and tracked.
- Information technology (IT) environment is secure:
- access by Statistics Canada employees is controlled by user ID and security groups;
- access by employees is limited to variables they need;
- direct identifiers are only available to the few employees working to anonymize the data or conducting record linkages; and
- direct identifiers are always kept in separate files.
- Based on confidentiality guidelines, only aggregate non-confidential data are released outside of Statistics Canada. Suppression or rounding rules are applied to the aggregate data to minimize risk of disclosure.
End of text box 3
Circumstances of restorative justice youth participants in 2009
Many of the youth who participated in RJ in 2009/2010 came from socioeconomically marginalized areas
Previous research has found that socioeconomic circumstances are an important factor in youth crime (Charron 2011, Farrington and Loeber 2000). In that context, this study found that many of the RJ participants were living in disadvantaged situations at the time they were accepted into the NSRJP.
The Canadian Marginalization Index (CAN-Marg) uses data from the 2006 Census of Population to provide measures for various dimensions of marginalization (Matheson et al. 2012). The CAN-Marg Index is calculated for very small areas (Dissemination Areas or DAs).Note The present analysis uses the dimension of the CAN-Marg index which measures material deprivation. The CAN-Marg dimension for material deprivation speaks to socio-economic privilege (or lack thereof) in the areas of housing, education, income and employment. It takes into account a number of different factors, including: high school completion rates, lone parent families, unemployment rates, low income, and homes needing major repairs. An individual is considered to come from the most marginalized areas for this measure if they live in a DA that falls within the most marginalized DAs in Canada (the bottom 20% (quintile) on the marginalization index nationally).
According to the CAN-Marg Index, a large proportion of the young offenders who were accepted into RJ in 2009/2010 came from locations with the highest levels of material deprivation. At the time of their referral to restorative justice in 2009/2010, 43% of youth who participated in restorative justice lived in a location that was in the bottom quintile for the CAN-Marg 2006 material deprivation measure. This compared to 34% of all Nova Scotia youth, for both males and females, of a similar age.Note The gap was more evident for female RJ participants (48%) than for males (41%) (Table 2).
Many of the female 16- and 17-year-olds who participated in RJ were not living with parents in 2009
Linkages to tax data provided information on some socioeconomic circumstances for the oldest youth who participated in restorative justice. The T1 Family File (T1FF) provides information on youth who filed a tax return or who were reported as dependents in their parents’ tax files (“child non-filer”).Note Information is also available to identify youth who filed a return and were living with a parent (“child filer”). Those who filed returns but were not living with parents are considered “non-child filers”. These findings, together with the fact that many of them lived in marginalized areas, suggest that among RJ participants, girls may be particularly vulnerable from an economic standpoint.
Using the T1FF for 2009, 41% of 16- and 17-year-old RJ participants who were accepted into the program were linked to an income tax return, with little difference by gender. Although information from the T1FF includes individuals who did not file taxes, but were dependents of a filer, complete identifiers required to link to these non-filers was generally not available for the RJ analytical file; for this reason, it was not possible to link most non-filing RJ participants to their families in the tax information.Note This means that the study had no reliable information on the living situations of those who did not themselves file a tax return. However, even with the information that is available, one difference is notable. A relatively high proportion of girls who participated in restorative justice appeared to be no longer living with their parents: one in five female RJ participants were “non-child filers”, that is, they filed taxes but were not identified as living with a parent (20% vs 9% of male RJ participants).Note As context, among all Nova Scotian 16- and 17-year-old youths, 6% were identified as non-child filers, not living with parents, with little difference by gender (Table 2).
Information from the 2009 T1FF also shows that a high proportion of the RJ 16- and 17-year-olds who were linked to a tax file were in low-income situations (with families or alone). Note Half of the tax filing girls (50%) and 31% of the boys were living in a low-income situation. In comparison, among 16- and 17-year-old Nova Scotians who filed taxes, 22% were living in low income, with no significant difference by gender.
Among 16- and 17-year-olds, there was little difference between the RJ participants who reported employment income in 2009 (35%) and similarly aged Nova Scotia youth (32%).Note Very few of the RJ participants at this point in time reported government transfers such as social assistance benefits. In other words, at this age, RJ youth and Nova Scotia youth in general were equally likely to be employed—the main difference between them, instead, was whether or not they lived on their own or with their parents.
Start of text box 4
Text box 4
Characteristics of restorative justice processes
Most referrals to restorative justice are by police or prosecutors
In 2009/2010, youth could be referred to the Nova Scotia Restorative Justice Program at any stage in the criminal justice system, with more serious cases referred later in the criminal justice process.Note Over half (57%) of the referrals for youth to RJ were from police (pre-charge) and another 37% of referrals were by Crown prosecution. Relatively few referrals (6%) were from courts or corrections (Table 3).Note Girls were more likely to be referred by police than boys (64% compared to 54% of boys), while boys were more likely to be referred by prosecutors (39% vs 32% of girls). This is consistent with previous analysis which showed that girls are generally less likely to be charged by police than boys (Allen and Superle 2016). Younger individuals were more likely to have been referred by police, while referrals by prosecutors were more common among the oldest youth referred to restorative justice in 2009/2010.
Almost all youth were successful in some component of their RJ case
Of the 944 youth referred to the NSRJP in 2009/2010, 897 youth (95%) were accepted into the program.Note All further analysis in this article is restricted to those who were accepted into RJ (RJ participants). To be accepted, a youth must take responsibility for the offence and voluntarily choose to participate. Reasons for not participating may include not being able to contact the offender, or a youth choosing not to participate or take responsibility. Most of the youth who were accepted into the program succeeded in some or all of the requirements set out in their plan (94%). Success rates were high, regardless of the offence that led to their referral (Table 3). A successful file is one where some or all of the requirements set out in the plan were completed successfully.
The time it took to complete the RJ process varied considerably across participants. The median length of time between the start and end date of the RJ process was 132 days (just over four months), but one-quarter of cases (25%) took 90 days or less. Almost half (49%) of files took between three and six months (91 to 180 days) to complete, 23% took six months to a year, and 26 cases (3%) took longer than one year. There are a number of factors which might have an impact on the length of processes such as additional contact with police, or the obligations of the youth under the plan. For example, process length may be different for an apology compared to reparation or participating in a treatment program. It might also be influenced by the number of sessions, and the number and nature of persons involved in the process.
Most youth who completed an RJ process did not have any further contact with RJ in Nova Scotia
Information on youth who participated in restorative justice in 2009/2010 was linked to administrative data from the program for later years to determine whether they were referred again for another offence over a six-year period. Most (84%) of the youth who participated in RJ in Nova Scotia in 2009/2010 (and completed that file either successfully or not) did not have any further contact as youth with RJ in Nova Scotia.Note The remaining 16% had at least one further contact with RJ between 2009/2010 and 2014/2015, including 17 youth who had two or more re-contacts with RJ over this period. In total, 144 youth had a re-contact with RJ between 2009/2010 and 2014/2015.Note Overall, boys were more likely to have re-contact with RJ than girls (18% versus 13%).
Of the 144 youth who had a second contact with RJ in the 6 years of the study, 41 (28%) started a new RJ file less than 6 months after the completion of their first one.Note For about half (51%), the time between the two processes was over one year.
Re-contact with restorative justice was more frequent among serious offenders: 21% of offenders had re-contact when the first RJ offence was violent compared to 15% when the first offence was a property crime. When youth had re-contact with RJ, the majority of second processes or files was either less serious (35% of youth with re-contact) or a similar level of seriousness (23%).Note For another 42%, the second process or file was for a more serious offence.
Overall, 90% of second contacts with RJ succeeded in some or all of the requirements set out in their plan. Success rates for those whose first process or file was also successful were slightly higher (92%).
As this analysis did not link RJ participants to police data, information on further police contact that did not involve RJ was not available. However, findings from the analysis of youth who had contact with the police in 2012/2013 shows that of those who were diverted to RJ (with no court contact), the majority (54%) had no recontact with police in the following two years (Ibrahim 2019).
End of text box 4
Socioeconomic circumstances of restorative justice youth participants by adulthood
The marginalization and disadvantage that many RJ participants faced as youth continued to manifest in various ways as this group transitioned to adulthood. Looking at the ways in which the RJ cohort continued to experience this marginalization in adulthood helps to highlight the nature of the disadvantage faced by this population in both their youth and young adulthood, and illustrates some of the challenges that exist among the population served by RJ programs in Nova Scotia.
Using the Social Data Linkage Environment at Statistics Canada, this study linked information for the youth who participated in RJ in 2009/2010 when they were aged 12 to 17 with more recent information from the 2015 T1FF as well as to the 2016 Census of Population (See the “Data sources” and “Methodology” sections). These data sources provide information on the longer-term experiences of the RJ cohort, particularly their family status, educational attainment, income and income sources. By 2015, the youth who had participated in RJ in 2009/2010 had all reached adulthood, and were now young adults between 18 and 23 years old, an age where individuals have typically completed high school, pursued further education or entered the work force on a full-time basis.
It is important to remember that the objective of this article is not to evaluate the outcomes of the RJ participants as a measure of the effectiveness of the RJ program. Rather, the focus of this study is to provide a better understanding of the socioeconomic circumstances of these individuals in youth and young adulthood using new methods of administrative data linkage. The restorative justice process is not designed to directly impact or improve these specific outcomes, but is focused primarily on addressing the harm done in a specific incident, provide healing to victims and community, and to reduce the risk of reoffending. At the same time, RJ is one of many public programs such as social services, schools and heath care that serve to help these youth reintegrate into their communities.
Circumstances of male and female RJ participants very different in early adulthood
By the time they were young adults, the youth who had participated in restorative justice in 2009/2010 continued to face challenging circumstances. However, there were notable differences in these circumstances by gender.
By 2016, when they were aged 19 to 24, the young women who had participated as youth in NSRJP in 2009/2010 were typically in very different living situations when compared to the male participants. Most notably, information on the RJ participants who could be linked to the 2016 Census of Population shows that nearly half (48%) of the female RJ participants were living with a child (biological, step- or adopted) (Table 4), a much higher proportion than among male RJ participants (11%) or similarly aged Nova Scotian women (13%).Note
The high proportion of female RJ participants who were parents partly explained gender differences in income and employment in this analysis. It is important to note these gender differences when considering the statistics for the total RJ cohort, as the characteristics for the group overall tend to represent the larger number of male participants. For this reason, the socioeconomic circumstances of the RJ cohort are presented separately by gender.
Characteristics of female RJ participants in young adulthood
Almost half of female RJ participants had children by age 19 to 24
According to the 2016 Census of Population, over two-thirds (69%) of the female RJ participants were no longer living with a parent in 2016 (when they were aged 19 to 24). As noted above, almost half of the girls (48%) who had participated in restorative justice in 2009/2010 had children by the time they were young adults. Most of these young women (59% of those with children, or 28% of all female RJ participants) were lone parents. It should be noted, however, that almost a third (31%) of the female RJ participants who were lone parents were still living with a parent (Table 4).
As with their circumstances in 2009/2010, the situations of female RJ participants are not typical of young women in Nova Scotia. As context, among a similarly aged group of Nova Scotian women, 46% were still living with a parent according to the 2016 Census. Moreover, relatively few were themselves parents: 13% were living with a child and 7% were lone parents. The fact that so many of the female RJ participants are parents at this age is notable. Research suggests that early motherhood has an impact on educational attainment and labour market participation (Luong 2008).
One-third of female RJ participants had not completed high school by 2016
School performance and educational aspirations have been identified in research as risk factors for offending. They are also important factors in ongoing socioeconomic disadvantage. This seems to be the case for the offenders in this analysis. By age 19 to 24, when most people have graduated from high school, one-third (33%) of the females in the RJ cohort had not yet done so, although some had attended school at some point in the eight months prior to the Census.Note Another 41% of the female RJ participants had completed high school with no further education, and 28% had recently attended or already completed postsecondary education (Table 4).Note
The proportion of female RJ participants who had not completed high school by young adulthood was notably different from young women in Nova Scotia overall. Among a similarly aged cohort of Nova Scotia females, 7% had not completed high school. Instead, 19% had completed high school with no further education and three-quarters (74%) had attended or completed postsecondary education.Note
Many of the women who participated in restorative justice as youths were in low income situations and relying on government transfers as adults
Female RJ participants continued to live in challenging economic situations by the time they were young adults. Information from T1FF shows that a significant proportion of the females were living in low income situations in young adulthood. Tax information for 2015 was available for 83% of female RJ participants.Note More than half (54%) of these young women lived in low income situations in 2015, just slightly higher than was noted among the 16- and 17- year old female RJ participants in 2009, and a much higher proportion than among male RJ participants (35%). It was also notably high compared to a similarly aged cohort of young women in Nova Scotia (29%) (Table 4).
The high proportion of female RJ participants in low income situations at this age can only partly be explained by the large proportion of them who had children. Most young females in Nova Scotia who were identified as mothers at this age lived in low income situations in 2015. Looking only at those young women who reported federal child benefits (as an indicator of motherhood), the RJ participants were only slightly more likely to be living in low income situations than their Nova Scotia peers: 73% compared to 68% of similarly aged mothers in Nova Scotia.Note However, it should be noted that many of the female RJ participants who did not have children (did not report the federal child benefit) were also living in low income (38% compared to 24% of their Nova Scotia peers).
The high proportion of female RJ participants who had children did not explain the fact that female RJ participants were less likely to report employment earnings. While 59% of the female RJ cohort reported employment income compared to 83% of the Nova Scotia comparison group, there was still a similar difference among those who did not have children (did not report child benefits) (61% of female RJ participants versus 87% overall). Note Among those receiving federal child benefits, however, there was little difference between the female RJ participants and the Nova Scotia benchmark (55% of female RJ participants versus 59% overall.
Having children, however, did partly explain why female RJ participants were highly dependent on income from government transfers by the time they were young adults. The economic dependency ratio (EDR), which provides a measure of a group’s reliance on government transfers compared to employment income, was notably high for the female RJ participants (71.3) compared to a similar cohort of Nova Scotia females (20.3).Note Among the young women who did not report the federal child benefit, EDRs were much lower, but there was still a gap, although smaller, compared to the Nova Scotia benchmark (16.1 for RJ participants versus 9.7 overall). The EDR for all male RJ participants was 18.4. This demonstrates that the relatively high EDR among female RJ participants can be explained by very high EDRs among those with children. Among young mothers (reporting federal child benefits), the EDRs were very high for both the RJ cohort and the Nova Scotia Benchmark (238.7 versus 238.1 for the comparison group) as many of these women were not working and the child benefits represented a notable proportion of their overall income (35%).
Beyond federal child benefits, government transfers can be issued for various reasons, including receipt of social assistance and employment insurance. It is worth noting that a higher proportion of female restorative justice participants reported receiving social assistance benefits than was typical of Nova Scotia young women overall (24% versus 6%). Even among those who had children (reported federal child benefit), a notable difference in the receipt of social assistance remained (45% versus 27%).
Among the 22 and 23 year old females, the median before-tax income was slightly higher for the female RJ participants ($17,120) compared to the comparison group ($16,610), but, as already noted, the sources of this income differed.Note
Characteristics of male RJ participants by young adulthood
Over one third of male RJ participants had not completed high school by 2016
According to the 2016 Census of Population, almost half (49%) of the male RJ participants were still living with a parent when they were 19 to 24 years of age, a much higher proportion than among the female participants (31%), and closer to the proportion of male Nova Scotians of a similar age (53%). Male RJ participants were much less likely than female participants to be living with a child (biological, step-, or adopted) in 2016 (11% vs 48%). However, they were still almost three times more likely than similarly aged Nova Scotian men to be living with a child (11% versus 4%) (Table 4).
In 2016, 36% of the males who had participated in restorative justice in 2009/2010 had not yet completed high school, on par with female participants.Note It is worth noting that some of these males had attended school at some point in the eight months preceding the Census.Note As with the female restorative justice participants, education levels for males who participated in RJ were not as high as those of similarly aged young men in Nova Scotia generally. Male RJ participants were four times more likely to have not completed high school than Nova Scotian males of a similar age (36% versus 9%). In addition, while one-third (33%) of male RJ participants had recently attended or had completed postsecondary education, nearly two-thirds (62%) of similarly aged Nova Scotian males had some postsecondary education (Chart 2).
Chart 2 start
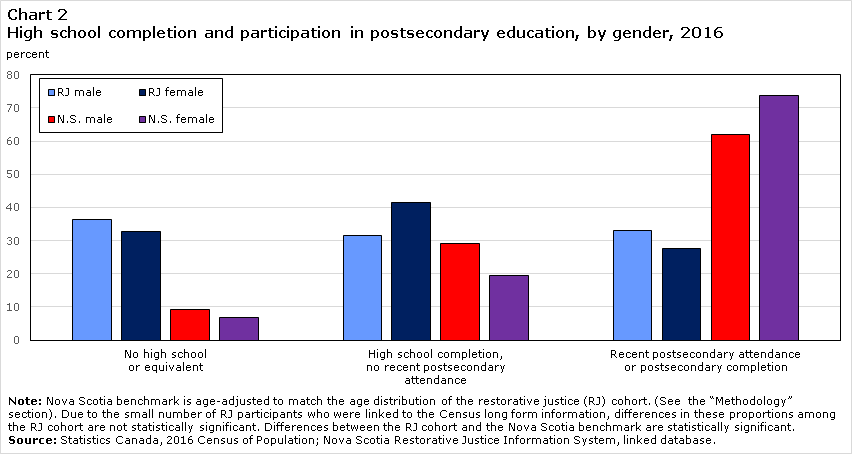
Data table for Chart 2
| RJ male | RJ female | N.S. male | N.S. female | |
|---|---|---|---|---|
| percent | ||||
| No high school or equivalent | 36 | 33 | 9 | 7 |
| High school completion, no recent postsecondary attendance | 31 | 41 | 29 | 19 |
| Recent postsecondary attendance or postsecondary completion | 33 | 28 | 62 | 74 |
|
Note: Nova Scotia benchmark is age-adjusted to match the age distribution of the restorative justice (RJ) cohort. (See the “Methodology” section). Due to the small number of RJ participants who were linked to the Census long form information, differences in these proportions among the RJ cohort are not statistically significant. Differences between the RJ cohort and the Nova Scotia benchmark are statistically significant. Source: Statistics Canada, 2016 Census of Population; Nova Scotia Restorative Justice Information System, linked database. |
||||
Chart 2 end
Male RJ participants less likely to report employment income than Nova Scotia males of the same age
Information from tax records also shows that the male RJ participants continued to face socioeconomic challenges as they made the transition into young adulthood. The T1 Family File tax records were linked for 72% of the male RJ participants. Note These records revealed that male RJ participants who filed tax returns were less likely than female participants to be in a low income situation by age 18 to 23 (35% compared to 54% of females), but still more likely than a similar cohort of Nova Scotia males (22%) (Table 4) (Chart 3).
Chart 3 start
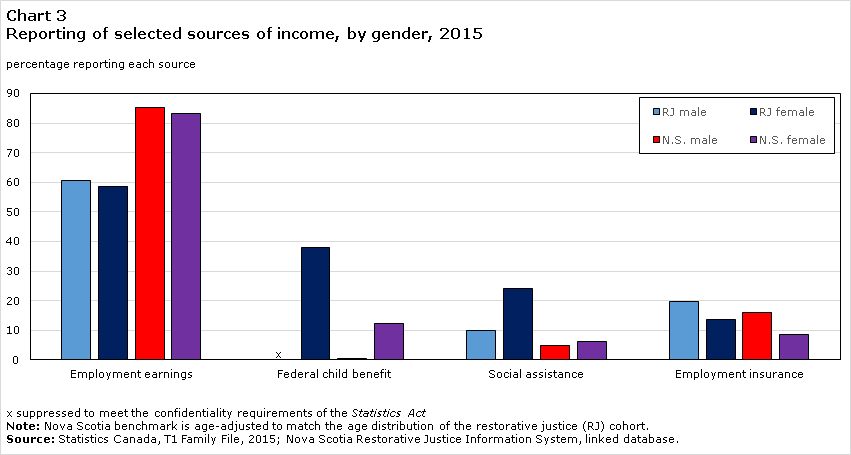
Data table for Chart 3
| RJ male | RJ female | N.S. male | N.S. female | |
|---|---|---|---|---|
| percent | ||||
| Employment earnings | 61 | 59 | 85 | 83 |
| Federal child benefit | Note x: suppressed to meet the confidentiality requirements of the Statistics Act | 38 | 1 | 12 |
| Social assistance | 10 | 24 | 5 | 6 |
| Employment insurance | 20 | 14 | 16 | 9 |
|
x suppressed to meet the confidentiality requirements of the Statistics Act Note: Nova Scotia benchmark is age-adjusted to match the age distribution of the restorative justice (RJ) cohort. Source: Statistics Canada, T1 Family File, 2015; Nova Scotia Restorative Justice Information System, linked database. |
||||
Chart 3 end
Overall, male RJ participants were less likely to report employment income (61%) than the male comparison group (85%). However, for those reporting employment income by age 22 and 23, when most young adults have completed their postsecondary education, there was little difference in median income. Tax records showed that median employment income for older male RJ participants were $18,820 compared to $18,170 for Nova Scotia males of the same age.Note However, given the low levels of educational attainment among the male RJ participants, they may lack the future earning potential of young Nova Scotia males generally.
Male RJ participants were less likely than their female counterparts to report income from government transfers (66% versus 79%), primarily because of the receipt of federal child benefits among women. They were also less likely to report receipt of government transfer payments than similarly aged Nova Scotia males (86%). However, male RJ participants were more likely to report employment insurance benefits (20%) compared to both the female RJ participants (14%) and the male Nova Scotia comparison group (16%). Another 10% of male RJ participants reported social assistance compared to 5% of similarly aged Nova Scotia males.
Consequently, male RJ participants relied more on government transfers relative to earnings than a similar cohort of Nova Scotia males, with a higher economic dependency ratio (EDR) (18.4 compared to 12.7).Note However, this EDR was considerably lower for restorative justice male participants (18.4) than for female RJ participants (71.3), which reinforces the fact that the females, a high proportion of whom were parents, were far more reliant on government transfers than on employment income.
Health system experiences of RJ participants
Restorative justice youth participants have high rates of hospitalization and emergency department visits
In addition to examining education, income and family characteristics, this study was also able to use information from health records to provide additional information on the vulnerability of the RJ cohort. The study examined information on contact with certain elements of the health care system, by linking to two datasets provided by the Canadian Institute for Health Information (CIHI) to Statistics Canada annually. The Discharge Abstract Database (DAD) is an administrative source of health information captured through discharge records submitted to CIHI from hospitals. The National Ambulatory Care Reporting System (NACRS) is a separate administrative data source that captures health information collected from records submitted to CIHI about visits to health care facilities for ambulatory care. (See the “Data sources” section). This analysis excluded DAD records related to day surgery and only used NACRS information on emergency department visits.
These data sources were used to examine inpatient hospitalization and emergency department visits, including the number of admissions and type of health condition diagnosis by RJ participants both before, and after, their 2009/2010 RJ experience. The type of diagnosis presented here is defined using each given discharge record’s diagnosis coding that is classified according to the standard, the International Statistical Classification of Diseases and Related Health Problems, 10th revision, Canadian Adaptation (ICD-10-CA). The diagnosis reported represents “the most responsible diagnosis,” which is the most significant diagnosed condition related to the stay and/or the condition accounting for the greatest length of stay.Note Data for this section are not included in the tables.
Although only 8% of the RJ participants had been hospitalized in 2008/2009 or 2009/2010, and 18% had at least one emergency department visit, the rate of these hospital visits was almost 2 times higher than for Nova Scotia youth of a similar age, and 2 times higher for emergency department visits.Note The difference was primarily among females.
In the years following their 2009/2010 involvement in the NSRJP, participants continued to have high rates of hospital and emergency room visits. From 2010/2011 to 2016/2017, 52% of female RJ participants and 19% of male RJ participants were hospitalized at least once. Over one quarter (28%) of the females and 7% of males were hospitalized more than once. Compared to Nova Scotia youth generally, hospitalization rates were about 2 times higher for female RJ participants and 1½ times higher for male RJ participants compared to their Nova Scotia counterparts.Note Rates of emergency room visits were about 1½ times higher for both male and female RJ participants.
The gender difference in hospitalization among RJ participants is almost completely explained by the high rates of pregnancy-related diagnoses among female RJ participants. Between 2010/2011 and 2016/2017, 43% of female RJ participants had a hospital visit related to a pregnancy.Note When these pregnancy-related diagnoses are excluded, hospitalization rates for male and female RJ participants were similar (Chart 4).
Chart 4 start
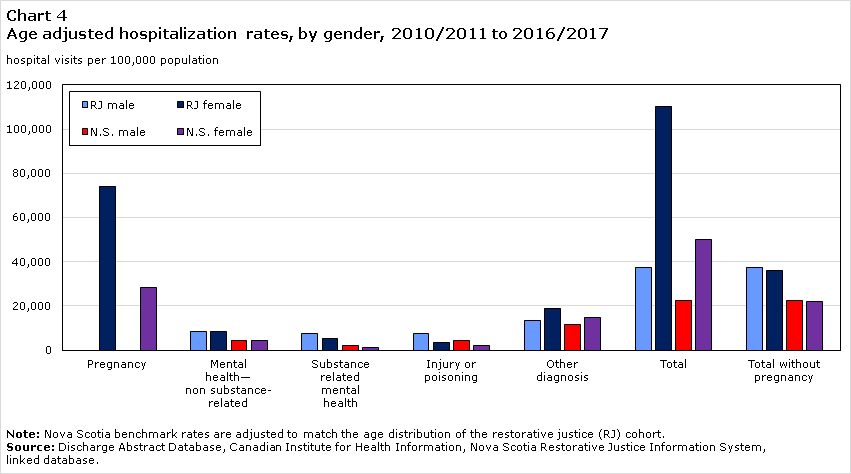
Data table for Chart 4
| Pregnancy | Mental health—non substance-related | Substance related mental health | Injury or poisoning | Other diagnosis | Total | Total without pregnancy | |
|---|---|---|---|---|---|---|---|
| hospital visits per 100,000 population | |||||||
| RJ male | Note ...: not applicable | 8,264 | 7,438 | 7,438 | 13,223 | 37,190 | 37,190 |
| RJ female | 74,138 | 8,621 | 5,172 | 3,448 | 18,966 | 110,345 | 36,207 |
| N.S. male | Note ...: not applicable | 4,213 | 2,163 | 4,283 | 11,772 | 22,432 | 22,432 |
| N.S. female | 28,140 | 4,204 | 1,067 | 2,180 | 14,684 | 50,274 | 22,134 |
|
... not applicable Note: Nova Scotia benchmark rates are adjusted to match the age distribution of the restorative justice (RJ) cohort. Source: Discharge Abstract Database, Canadian Institute for Health Information, Nova Scotia Restorative Justice Information System, linked database. |
|||||||
Chart 4 end
Hospitalization rates related to mental health issues (including substance-use related diagnoses) were 3 times higher among the RJ participants compared to Nova Scotians of a similar age.Note Among RJ participants, about one in ten was hospitalized or visited an emergency department at least once for a mental health issue between 2010/2011 and 2016/2017. There was no notable difference by gender (12% of females, 11% of males). Many of these mental health hospital or emergency department visits were related to substance use, including opioids, alcohol or other drugs: 6% of participants were hospitalized or visited an emergency department where the most serious diagnosis was substance-related between 2010/2011 and 2016/2017.Note
Summary
Societies recognize that investments in youth are an effective way to create healthy, safe, and prosperous communities. Youth who come into contact with the law are often among the most marginalized and vulnerable. In Canada, the YCJA mandates that youth in conflict with the law are dealt with in ways that recognize their unique situations and the factors underlying their behaviour. In this context, it is valuable to have good information on the background circumstances of these youth as well as an understanding of the prospects they face as a result of their individual, family and community characteristics.
This study provides insight into the characteristics and socioeconomic circumstances of a cohort of Nova Scotia youth who participated in the NSRJP in 2009/2010, showing not only the marginalized situations which may have contributed to their offending, but also some of the challenges they continued to face in young adulthood. In particular, it shows notable differences between the circumstances of male and female offenders who participated in the NSRJP.
While available data did not support an examination of youth in conflict with the law in general, in many ways, these young people who were referred to the NSRJP were typical of youth accused of crime in Nova Scotia at that time. They were similar in their age and gender, and also in the types of crime that they had committed.
Information on the 2009/2010 RJ participants from various sources provides a picture of a group of youth in conflict with the law faced with a variety of social and economic challenges both in adolescence and young adulthood. This is not surprising, as research has shown that socioeconomic vulnerability is an important factor in youth offending, and this same vulnerability is also associated with disadvantaged circumstances in young adulthood. The same conditions which may have contributed to their delinquency may also have set them up for difficult life transitions and continued socioeconomic marginalization in adulthood.
At the time of their 2009/2010 RJ involvement, a sizable proportion of the youth participants were living in areas that were considered marginalized in terms of material deprivation, a measure that takes into account levels of housing, education, income and employment. Similarly, many of these youth were living in low income families. Among older youth (aged 16 and 17), many were not living with their parents, particularly the girls.
The socioeconomic disadvantages many of the participants faced as adolescents were also evident in their young adulthood. By the time they were adults in 2015 and 2016, many of these youth still faced major challenges. Many of them were still living in low-income situations, but their disadvantage could now be seen in a broader range of measures such as education levels, family structure, income and experiences with the health system. However, these disadvantages were shown to be notably different for male and female RJ participants.
Almost half of the female RJ participants were living with a child by 2016 when the group was aged 19 to 24. This likely has some impact on the educational attainment and the earning potential of these young mothers. Unlike the males, most of the female RJ participants were no longer living with their parents and many of them were now relying highly on government transfers, particularly federal child benefits and social assistance. Although male RJ participants were considerably less likely than female participants to be living with a child, they were still more likely to be doing so than similarly-aged Nova Scotia males overall.
By young adulthood, the male RJ participants were in very different circumstances than the females. About half of them were still living with their parents. Most were working, and their median earnings were not notably different from Nova Scotians of a similar age. However, with lower levels of education compared to these peers, their future earnings prospects may not be as good. Already, compared to similarly aged young Nova Scotian males, the male RJ participants were less likely to be working, and more likely to report employment insurance benefits or social assistance.
The early adult circumstances for the young RJ participants examined in this article highlight the challenges faced by many of the youth in conflict with the law that the NSRJP works with. Many of the young offenders who participated in RJ in 2009/2010 lived in challenging situations both at the time of their offence and in young adulthood.
The findings in this report show that this is a group of young people who are particularly disadvantaged when compared to the circumstances of Nova Scotians of a similar age. Their situations are complex. While previous research has shown that restorative justice programs are associated with lower levels of recontact with police, the complexity of the factors that can impact offending behaviour and life transitions, as well as the fact that many of these youth receive assistance from other social programs, makes it impossible to determine whether RJ programs have an impact on the socioeconomic circumstances of participants by young adulthood or whether their situations would have been different had they gone to court. Further research linked to additional types of information on the background and experiences of youth in conflict with the law would be required to more fully understand what factors support desistence from crime and successful life transitions into adulthood.
Detailed data tables
Table 1 Characteristics of youth referred to restorative justice in Nova Scotia in 2009/2010
Table 2 Socio-economic characteristics of youth in restorative justice in Nova Scotia, 2009
Data sources
Nova Scotia Restorative Justice Information System
The Nova Scotia Department of Justice has provided the Centre for Justice and Community Safety Statistics at Statistics Canada with data pertaining to restorative justice. These data were captured in Nova Scotia's Restorative Justice Information System.
This study examines a cohort of youth who were referred to any of the 8 Nova Scotia restorative justice community agencies that deliver RJ under the Nova Scotia Restorative Justice Program (NSRJP) for a violation of the Criminal Code, Controlled Drugs and Substances Act or other federal statues such as the Youth Criminal Justice Act, with cases starting between April 1, 2009 and March 31, 2010. The study excludes Information on youth who were referred to the Mi’kmaw Customary Law Program of the Mi’kmaw Legal Support Network. Information on the restorative justice program managed by Dalhousie University are also excluded.
For those referrals where the first file/process was completed, individuals were followed for the next five years and any additional completed files/ processes were counted as re-contacts. As a result of this methodology, indigenous youth originally referred to the Mi’kmaw Customary Law Program, but then further referred to a NS RJ program are also excluded.
Canadian Marginalization Index
The Canadian Marginalization Index (CAN-Marg) is a geographically-based index produced by Matheson et al. (2012). Index scores are calculated by Dissemination Area (DA). A dissemination area (DA) is the smallest area for which Census information is disseminated, with an average population of 400 to 700 persons.
Using factor analysis, DA-level factor scores were calculated for each dimension using variables from the 2006 Census of Population. Within a dimension, ordered scores were assigned a quintile value, 1 through 5, where 1 represents the least deprived and 5 represents the most deprived.
For this analysis, scores for the material deprivation dimension of the Index were linked to the DA where RJ participants were living in 2009. Information for the CAN-Marg was available for 77% of the RJ participants. Linkages to the CAN-Marg were higher for younger males (aged 12 to 14) who comprised 26% of male RJ participants.
CAN-Marg measures for the Nova Scotia benchmark were produced by linking the CAN-Marg Index quintile information to DA counts of 12- to 17-year-old youth (by gender) from the 2006 Census of Population. The results were then adjusted to reflect the age-gender distribution of the RJ cohort.
Uniform Crime Reporting Survey
Information used to compare the offences of the RJ cohort to youth crime in Nova Scotia in 2009/2010 comes from the Uniform Crime Reporting Survey (UCR) for 2009. The UCR was developed in 1962 with the cooperation and assistance of the Canadian Association of Chiefs of Police. The data collected by the survey reflect reported crime that has been substantiated through a police investigation. The data come from all federal, provincial and municipal police services in Canada and involve offences under the Criminal Code and other federal statutes. Information is based on the most serious violation in the incident.
Information (Table 1) to compare the age, gender and offence profile of RJ participants to youth accused is based on the Incident-based UCR database which has information by individual criminal incident. In the UCR, an accused record is collected for each individual accused in the incident. If an individual is accused in more than one incident, that individual will be counted multiple times as one accused for each separate incident.
Chart 1 is based on information from the Aggregate UCR which provides aggregate counts of youth accused charged and not charged in the reference year. The method of counting for the two UCR databases is slightly different, but in both, an individual may be counted multiple times.
2016 Census of Population
The Census of Population, conducted every five years, gathers demographic, social, economic and cultural information on the Canadian population. All households are asked to provide basic demographics (household membership information only), while the remainder received the long-form to provide more detailed information for all household members. For additional information about the Census of Population, see the Guide to the Census of Population, 2016 (Statistics Canada Catalogue no. 98-304-X) and the Dictionary, Census of Population, 2016 (Statistics Canada Catalogue no. 98-301-X).
Information on family structure and living with parents was collected from every household in Canada. Information on educational attainment and school attendance was used to derive the education categories used in this analysis. This information is from the 2016 Census long form questionnaire which went to 25% of the Canadian population. Data from the long-form questionnaire are weighted with adjustments for non-response to represent the full Canadian population.
Overall, 68% of RJ participants were linked to 2016 Census short form content and 18% were linked to the Census long form database. Males were more likely to be linked to Census records than females. In addition, linkage rates were higher for older youth.
Because of these differences in the linkage rates by gender and age, additional weights based on the age and gender specific linkage rates were derived to adjust the data from the Census so that it would reflect the overall age and gender distribution of the RJ participants.
It is worth noting that young adults are generally the most difficult group to reach with the Census. In the 2016 Census, net undercoverage for 20 to 24 year olds in Canada was 8.19% for males and 3.89% for females. This compared to an overall Canadian net undercoverage rate of 2.36%.Note Undercoverage for this young adult population has been attributed to high rates of residential mobility and the fact that many are making the transition from family home to independence. The Census counts individuals in their “usual place of residence”. However, some young adults may not be living in a permanent residence and there may be confusion about how and where they should be counted. This may be particularly true for the population of the RJ cohort whose characteristics show them to be more vulnerable than similarly aged Nova Scotians generally, more likely to have left the family home, and thus possibly less likely to be included in the Census.
Individuals who are usual residents of collective dwellings, such as nursing homes, rooming houses and correctional facilities are counted in the Census, but no information on family status or education is collected for them.
Data from the Census for the Nova Scotia benchmark group were adjusted to reflect the age-gender distribution of the RJ cohort which is predominantly male and biased toward older teens.
T1 Family File
Statistics Canada has produced the T1 Family File (T1FF) annually at Statistics Canada since 1982, for the purpose of recreating Canada’s population and family universe. Statistics Canada constructs the file by taking data on individuals who completed a T1 return of income for the reference year and combining those data with information on non-filing spouses and data on children from the Canada Child Tax Benefit (CCTB), vital statistics, and a historical file. It then groups individuals into census families by means of a complex methodology. This approach serves to create an annual file that covers approximately 95% of the Canadian population and contains basic tax and demographic information on the Canadian population.
For the analysis of 2009 income, 41% of 16- and 17-year-old RJ participants were linked to the T1FF. Most of these individuals were linked to tax returns filed by the youth. Because complete contact information was missing for most of the dependent (child non-filer) records in the T1FF used for the linkage, information on child non-filers was not available for the analysis. For this reason, information identifying individuals living in low-income situations is based on tax-filers only.
Overall, 75% of RJ participants were linked to the T1FF for 2015.The male RJ participants were less likely than the females to be linked to the T1 Family File (72% versus 83%). This may be related to the high proportions of females receiving federal child benefits which require the filing of a tax return. Linkage rates for females were relatively stable by age, but linkage percentages increased with age among the males.
Information for 2015 from T1FF for the Nova Scotia benchmark group has been adjusted to reflect the age-gender distribution of the RJ cohort which is predominantly male and biased toward older teens. Because the 2009 T1FF analysis was limited to 16- and 17-year-olds, where there is less bias, no age adjustment was done.
Discharge Abstract Database
The Discharge Abstract Database DAD captures a census of all acute care discharges from all public hospitals in Canada (except Quebec) as well as discharge records from some psychiatric, chronic rehabilitation and day surgery facilities. The DAD contains demographic, administrative and clinical information, including up to 25 diagnoses for a given discharge record, for approximately 3 million discharges annually. The data are provided to Statistics Canada annually by the Canadian Institute for Health Information (CIHI) for each hospital fiscal year (from April to March of the following year). Analysis in the present study excludes day surgery.
Rates for the Nova Scotia comparison group are based on the number of visits by individuals per 100,000 Nova Scotia youth who would have been aged 12 to 17 in 2009/2010.
Information from DAD for the Nova Scotia benchmark group has been adjusted to reflect the age-gender distribution of the RJ cohort which is predominantly male and biased toward older teens.
National Ambulatory Care Reporting System
The National Ambulatory Care Reporting System (NACRS) contains data from records submitted to CIHI for hospital-based and community-based ambulatory care including outpatient day surgery, outpatient and community-based clinics, and emergency departments. Client visit data are collected at time of service in participating facilities from each submitting jurisdiction. Analyses in the present study were limited to emergency department visits only.
Information on diagnosis is not available from all institutions reporting to NACRS.
Information from NACRS for the Nova Scotia benchmark group has been adjusted to reflect the age-gender distribution of the RJ cohort which is predominantly male and biased toward older teens.
Methodology
Social Data Linkage Environment
Linkages to the 2016 Census of Population, the T1 Family File, the Discharge Abstract Database and the National Ambulatory Care Reporting System was conducted at Statistics Canada using the Social Data Linkage Environment (SDLE), a highly secure linkage environment facilitating the creation of linked population data files for social analysis. For more information on the SDLE, see Overview.
Most participants who were not linked to a tax return (61% of females not linked to the T1FF and 55% of males) were also not linked to the Census. Information from the health data (DAD and NACRS) shows that this group is slightly less likely to have had a hospitalization or emergency room visit related to a mental health issue. There is no notable difference in the type of offences committed by these participants.
Age-gender adjustments for the Nova Scotia comparison group
Information on the Nova Scotia benchmark population from T1FF, the Census of Population, DAD and NACRS was adjusted by age and gender to reflect the age and gender distribution of the RJ cohort. As such, the Nova Scotia benchmark information represents the same age group, but with males and older individuals carrying higher weights to reflect the fact that the RJ cohort tends to be older, and the majority are male. Age-gender adjustments were not made for the comparison to youth accused data from UCR.
Disclosure control
To ensure the confidentiality of responses collected from the data sources used in this analysis, disclosure control guidelines specific to each data source were used in the reporting of information. As a result, when these data are summed or grouped, the total value may not match the sum of the individual values since the total and subtotals are independently rounded. Similarly, percentage distributions, which are calculated on rounded data, may not necessarily add up to totals.
To ensure the confidentiality of responses collected for the 2016 Census of Population, the Discharge Abstract Database (DAD) and the National Ambulatory Care Records System (NACRS), a random rounding process was used to alter the values reported in individual cells. For data from the T1 Family File (T1FF), values were regularly rounded. For all linked datasets, values were rounded before the calculation of percentages and ratios. Percentages are based on these rounded values and may not add up to totals.
References
Allen, Mary and Tamy Superle. 2016. “Youth crime in Canada, 2014.” Juristat. Statistics Canada Catalogue no. 85-002-X.
Berzin, Stephanie C. and Allison C. De Marco. 2009. “Understanding the impact of poverty on critical events in emerging adulthood.” Youth and Society. Vol. 41, no. 1.
Brennan, S. and A. Matarazzo. 2016. "Re-contact with the Saskatchewan justice system." Juristat. Statistics Canada Catalogue no. 85‑002‑X.
Cartwright, Fernando and Mary Allen. 2002. “Understanding the rural-urban reading gap.” Education, Skills and Learning Research Papers. Statistics Canada Catalogue no. 81‑595‑M.
Charron, Mathieu. 2011. “Neighbourhood characteristics and the distribution of crime in Toronto: Additional analysis on youth crime.” Crime and Justice Research Paper Series. Statistics Canada Catalogue no. 85-561-M.
Conference Board of Canada. n.d. “Child poverty.” How Canada Performs.
Farrington, David P. and Rolf Loeber. 2000. “Epidemiology of juvenile violence.” Child and Adolescent Psychiatric Clinics of North America. Vol. 9, Issue 4.
Ferguson, H.B., S. Bovaird and M.P. Mueller. 2007. “The impact of poverty on educational outcomes for children.” Paediatrics and Child Health. Vol. 12, no. 8.
Frenette, Marc. 2007. “Why are youth from lower-income families less likely to attend university? Evidence from academic abilities, parental influences, and financial constraints.” Analytical Studies Branch Research Paper Series. Statistics Canada Catalogue no. 11F019MIE.
Holman, Barry and Jason Zeidenburg. 2013. “Dangers of detention: The impact of incarcerating youth in detention and other secure facilities.” National Criminal Justice Reference Series. No. 247294. Office of Justice Programs.
Ibrahim, Dyna. 2019. “Youth re-contact with the Nova Scotia justice system, 2012/2013 to 2014/2015.” Juristat. Statistics Canada Catalogue no. 85‑002‑X.
Luong, May. 2008. “Life after teenage motherhood.” Perspectives on Labour and Income. Statistics Canada Catalogue no. 75-001-X.
Massoglia, Michael and Christopher Uggen. 2010. “Settling down and aging out: Toward an interactionist theory of desistance and the transition to adulthood.” American Journal of Sociology. Vol. 116, no. 2.
Matheson, F.I., J.R. Dunn, K.L.W. Smith, R. Moineddin and R.H. Glazier. 2012. “Development of the Canadian Marginalization Index: A new tool for the study of inequality.” Canadian Journal of Public Health. Vol. 103, suppl. 2. p. s12-s16.
Nova Scotia Department of Justice. 2018. The Nova Scotia Restorative Justice Program. (accessed January 20, 2020).
Shader, Michael. 2004. “Risk factors for delinquency: An overview.” US Department of Justice. Office of Juvenile Justice and Delinquency Prevention.
Thomas, Eleanor. 2006. “Readiness to learn at school among five-year-old children in Canada.” Children and Youth Research Paper Series. Statistics Canada Catalogue no. 89-599-M.
Wilson, Holly and Robert Hoge. 2013. “The effect of youth diversion programs on recidivism: A meta-analytic review.” Criminal Justice and Behaviour. Vol. 40, no. 5.
Yessine, A. 2011. “Risk Factors for Delinquency among Canadian Youth: Current knowledge and future directions.” Research Report: 2011-05. Public Safety Canada.
Zeman, Klarka and Angela Bressan. 2008. “Factors associated with youth delinquency and victimization in Toronto.” Crime and Justice Research Paper Series. Statistics Canada Catalogue no. 85-561-M.
- Date modified: