
Insights on Canadian Society
Postsecondary educational attainment and labour market outcomes among Indigenous peoples in Canada, findings from the 2021 Census

Overview of the study
This study uses data from the 2021 Census to report on postsecondary educational attainment and labour market outcomes among Indigenous adults aged 25 to 64 years. As First Nations people, Métis and Inuit are more likely to live in certain regions, which can impact their participation in both education and the labour market, the article examines patterns among those residing in remote areas, on reserve, and communities across Inuit Nunangat.
- Just under half (49.2%) of Indigenous adults had completed a postsecondary qualification in 2021. The most common highest level of education was the completion of a college, CEGEP or other non-university certificate or diploma. This was seen for both Indigenous men and women.
- Among Indigenous adults, the share with a postsecondary qualification was higher in areas closer to, or with greater access to economic centres. The difference between those living in easily accessible areas compared with very remote areas was greatest among Inuit (49.4% versus 21.7%).
- Compared with five years earlier, the share with a bachelor’s degree or higher increased for First Nations people (+1.6 percentage points (p.p.)), Métis (+2.5 p.p.) and Inuit (+0.9 p.p.). This occurred across all levels of remoteness, though some areas showed larger increases than others. Among First Nations people and Métis, greater increases were seen for those living in easily accessible areas when compared with very remote areas.
- The employment rate among Indigenous adults in 2021 was lower when compared with the non-Indigenous population (61.2% and 74.1%, respectively). However, the difference in employment rates between the Indigenous and non-Indigenous population disappeared when only considering those with a bachelor’s degree or higher (82.6% and 82.5%, respectively).
- Although Indigenous adults were, overall, less likely to be employed in professional occupations when compared with the non-Indigenous population (14.7% and 22.9%, respectively), Indigenous adults with a bachelor’s degree or higher were more likely to work in professional occupations than non-Indigenous adults (55.7% and 49.1%).
Acknowledgements
We extend our gratitude to colleagues, both internal and external to Statistics Canada, who lent their expertise in reviewing this paper. A very special thanks to the Congress of Aboriginal Peoples whose insights and perspectives have enriched this research.
Introduction
Over the past decade, educational attainment among the Indigenous population has improved, particularly among Indigenous women.Note Recent data from the 2021 Census show continued improvements in the proportion of First Nations people, Métis and Inuit who had completed high school, as well as those who had attained a bachelor’s degree or higher, compared with 2016.Note
However, for First Nations people, Métis and Inuit, educational attainment lags behind that of the non-Indigenous population.Note This is especially true for the attainment of a bachelor’s degree or higher. While the share of Indigenous people who had completed a bachelor’s degree or higher in 2021 improved from five years prior, the gap between the Indigenous and the Canadian-born non-Indigenous population continued to widen.Note
Indigenous people face a number of barriers to attaining higher levels of education, and these barriers may intersect and amplify challenges to participating in higher levels of education. Barriers can include, but are not limited to, inadequate financial resources or funding, the lack of culturally relevant curricula, a lack of confidence or feelings of unpreparedness, having personal or family responsibilities, experiences of racism and discrimination, and the effects of intergenerational trauma associated with residential schools.Note
In addition, when compared with the non-Indigenous population, Indigenous people are more likely to live in remote or northern communities, where there may be limited or no access to higher educationNote and participation in higher levels of education may require them to relocate.Note Those moving away from their home communities to urban areas may experience a large culture shock as well as feelings of loneliness and isolation, and the lack of culturally appropriate supports may further impact this transition.Note
It is well-established that there is an association between educational attainment and improved labour market outcomes, such as greater labour market participation, rates of employment and earnings for those with a higher level of education.Note There is also evidence that the association between completing higher levels of education and employment is stronger for Indigenous people when compared with the non-Indigenous population.Note Though employment rates and labour force participation rates for the Indigenous population fall below that of the non-Indigenous population, this gap narrows at higher levels of education.Note
This article uses data from the 2021 Census of Population to report on postsecondary educational attainment among Indigenous adults aged 25 to 64 years, including changes in educational attainment since 2016 (see box “Data sources, methods and definitions”). This article also describes labour market outcomes among Indigenous adults and highlights outcomes for those with higher levels of education.
Almost half of Indigenous adults had completed a postsecondary qualification in 2021
In 2021, just under half (49.2%) of Indigenous people aged 25 to 64 years had completed a postsecondary certificate, degree or diploma, a rate lower than that of non-Indigenous people (68.0%) (Table 1). Rates of postsecondary completion were 45.3% for First Nations people,Note 56.3% for Métis and 33.6% among Inuit.
Among Indigenous people with a postsecondary qualification, almost three in four (73.7%) had a postsecondary certificate or diploma below the bachelor level, where 46.0% had a college, CEGEP or other non-university certificate or diploma and 22.4% had an apprenticeship or trades certificate or diploma. Indeed, across all three Indigenous groups, completion of a college, CEGEP or other non-university certificate or diploma was the most commonly reported highest level of educational attainment for both men and women who had completed a postsecondary qualification.
Indigenous women were more likely to have completed a postsecondary qualification when compared with Indigenous men. More than half (53.5%) of Indigenous women had completed a postsecondary qualification, compared with 44.4% of Indigenous men. While a similar gender difference was also seen for the non-Indigenous population (5.7 percentage point (p.p.) difference), the difference was greater among Indigenous people (9.1 p.p. difference) due to larger gender differences among First Nations people (9.8 p.p. difference) and Métis (8.5 p.p. difference).
Both Indigenous and non-Indigenous men were more likely than women to have attained an apprenticeship or trades certificate or diploma; however, the share with this certification was higher among First Nations and Métis men than among Inuit and non-Indigenous men (15.0% and 18.2% versus 13.2% and 13.2%). In contrast, Indigenous women were more likely to have completed any other postsecondary qualifications than Indigenous men, including a bachelor’s degree or higher (16.4% for women compared with 9.0% among men). This trend was also present for non-Indigenous women and men.
| Highest level of education | Indigenous | First Nations (single identity) | Métis (single identity) | Inuit (single identity) | Non-Indigenous | ||||||||||
|---|---|---|---|---|---|---|---|---|---|---|---|---|---|---|---|
| Total | Men+ | Women+ | Total | Men+ | Women+ | Total | Men+ | Women+ | Total | Men+ | Women+ | Total | Men+ | Women+ | |
| percentage | |||||||||||||||
| No certificate, diploma or degree | 22.3 | 25.8 | 19.1 | 26.0 | 30.0 | 22.6 | 14.8 | 17.8 | 12.0 | 43.7 | 47.0 | 40.6 | 9.3 | 10.7 | 7.9 |
| High (secondary) school diploma or equivalency certificate | 28.5 | 29.8 | 27.4 | 28.6 | 29.9 | 27.5 | 28.9 | 30.4 | 27.6 | 22.7 | 21.7 | 23.6 | 22.7 | 24.2 | 21.3 |
| Postsecondary qualification (including certificate, diploma or degree) | 49.2 | 44.4 | 53.5 | 45.3 | 40.1 | 49.9 | 56.3 | 51.9 | 60.4 | 33.6 | 31.2 | 35.8 | 68.0 | 65.1 | 70.8 |
| Postsecondary certificate or diploma below bachelor level | 36.3 | 35.4 | 37.1 | 34.0 | 32.7 | 35.2 | 40.6 | 40.2 | 41.0 | 27.4 | 27.5 | 27.3 | 34.2 | 34.7 | 33.7 |
| Apprenticeship or trades certificate or diploma | 11.0 | 16.2 | 6.4 | 10.4 | 15.0 | 6.4 | 12.1 | 18.2 | 6.6 | 8.8 | 13.2 | 4.8 | 9.6 | 13.2 | 6.1 |
| College, CEGEP or other non-university certificate or diploma | 22.6 | 17.4 | 27.3 | 20.9 | 15.9 | 25.3 | 25.8 | 20.1 | 31.0 | 17.2 | 13.3 | 20.6 | 21.4 | 18.7 | 23.9 |
| University certificate or diploma below bachelor level | 2.6 | 1.8 | 3.4 | 2.7 | 1.8 | 3.5 | 2.7 | 1.9 | 3.4 | 1.4 | 0.9 | 1.9 | 3.2 | 2.8 | 3.7 |
| Bachelor's degree or higher | 12.9 | 9.0 | 16.4 | 11.3 | 7.4 | 14.7 | 15.7 | 11.7 | 19.5 | 6.2 | 3.7 | 8.5 | 33.8 | 30.4 | 37.1 |
|
Note: Given that the non-binary population is small, data aggregation to a two-category gender variable is sometimes necessary to protect the confidentiality of responses provided. In these cases, individuals in the category "non-binary persons" are distributed into the other two gender categories and are denoted by the "+" symbol. The category "Men+" includes men, as well as some non-binary persons. The category "Women+" includes women, as well as some non-binary persons. Source: Statistics Canada, Census of Population, 2021. |
|||||||||||||||
The share with postsecondary qualifications is lower in more remote areas
First Nations people, Métis and Inuit are more likely to live in certain geographic regions, which can impact their participation in formal education. Indeed, educational attainment has been shown to correlate with level of remotenessNote , a concept which describes the extent to which a municipality is remote, or far from neighbouring population centres (see box “Data sources, methods and definitions”).
The share of Indigenous people with a postsecondary qualification was higher in more accessible areas (Chart 1). This trend was observed among all Indigenous groups, but the difference between those living in easily accessible areas compared with very remote areas was greater among Inuit and First Nations people.Note This difference was particularly notable among Inuit, where those living in easily accessible areas (49.4%) were more than twice as likely to have a postsecondary qualification than their counterparts in very remote areas (21.7%).
Much of the regional variation in postsecondary attainment among Inuit can be attributed to the large share of Inuit living in Inuit Nunangat, of which all areas are classified as remote or very remote. In 2021, over two-thirds (69.0%) of Inuit lived in Inuit Nunangat, which is composed of four regions: Nunatsiavut (northern Labrador), Nunavik (northern Quebec), Nunavut and the Inuvialuit Region (northern Northwest Territories). For those living in Inuit Nunangat, there are limited opportunities to participate in higher levels of education, where those who pursue further education must often leave their community and their support system.Note
Indeed, in 2021, the share with a postsecondary qualification was over two times higher for Inuit living outside Inuit Nunangat when compared to Inuit living in Inuit Nunangat (52.8% versus 23.7%) (see Table A.2 in appendix). The gap in formal educational attainment between Inuit living inside and outside Inuit Nunangat was particularly notable for those with degrees at the bachelor’s level or higher, where Inuit living outside Inuit Nunangat were close to five times as likely to have a credential at the bachelor’s level or higher than Inuit living in Inuit Nunangat (13.0% and 2.7%).
In the case of First Nations people with Registered or Treaty Indian status, postsecondary attainment varies considerably depending on where they live. Among First Nations people with Registered or Treaty Indian status, 47.6% of those living off reserve held a postsecondary qualification compared with 34.0% of those living on reserve (see Table A.3 in appendix). The overall lower rate of postsecondary attainment on reserve partially reflects the geographic distribution of those living on reserve. Among First Nations people with Registered or Treaty Indian status living on reserve, approximately three in five (60.4%) live in a remote or very remote area, where there may be limited or no access to postsecondary opportunities. In contrast, for First Nations people with Registered or Treaty Indian status living off reserve, far fewer (20.8%) lived in remote or very remote areas. Across all levels of remoteness, the share with a postsecondary qualification was higher for First Nations people with Registered or Treaty Indian status living off reserve, when compared to their counterparts living on reserve.Note

Data table for Chart 1
| Indigenous identity | Easily accessible | Accessible | Less accessible | Remote | Very remote |
|---|---|---|---|---|---|
| percentage | |||||
| Indigenous | 54.7 | 52.8 | 49.1 | 42.9 | 27.0 |
| First Nations (single identity) | 51.5 | 49.2 | 45.7 | 39.7 | 26.7 |
| Métis (single identity) | 58.5 | 57.2 | 54.5 | 50.7 | 41.7 |
| Inuit (single identity) | 49.4 | 54.3 | 52.2 | 42.3 | 21.7 |
| Non-Indigenous | 70.0 | 64.1 | 60.7 | 56.0 | 54.0 |
| Source: Statistics Canada, Census of Population, 2021. | |||||
The share of Indigenous adults with a bachelor’s degree or higher increased from 2016, although the gap between the Indigenous and non-Indigenous population grew
Previous research has shown that the share of Indigenous adults with a postsecondary qualification has been increasing over time, where the magnitude of change varies by both type of postsecondary qualification as well as Indigenous group.Note
When comparing 2021 with five years earlier, the share with a postsecondary certificate or diploma below the bachelor level had declined among both Indigenous and non-Indigenous adults (-2.2 percentage points (p.p.) and -2.0 p.p., respectively), where change varied by type of credential. In 2021, the share of Indigenous people whose highest level of education was a university certificate or diploma below the bachelor’s level was unchanged from 2016 (0.0 p.p.)Note , whereas the share of Indigenous people with a college, CEGEP or other non-university certificate or diploma had declined slightly from 2016 (-0.4 p.p.). While the share with a college, CEGEP or other non-university certificate or diploma had changed little among Métis (+0.2 p.p.), declines occurred among First Nations people, Inuit as well as among the non-Indigenous population (-0.6, -1.5 and -1.0 p.p., respectively).Note
Among both Indigenous and non-Indigenous people, there were declines in the share whose highest level of education was an apprenticeship or trades certificate or diploma (-1.7 and -1.1 p.p., respectively). However, when looking specifically at the share of Indigenous people with an apprenticeship certificate, smaller declines were observed from five years earlier (-0.4 p.p.). Similar findings were seen among First Nations people, Métis, Inuit and the non-Indigenous population (-0.2, -0.4, -0.9 and -0.5 p.p., respectively).
In contrast, the share of Indigenous people with a bachelor’s degree or higher increased by 1.9 percentage points compared to 2016. The increase in the proportion with a bachelor’s degree or higher was seen for First Nations people (+1.6 p.p.)Note , Métis (+2.5 p.p.) and Inuit (+0.9 p.p.) (Chart 2). Though the share of Indigenous adults with a bachelor’s degree or higher increased from 2016 to 2021, the gap between the Indigenous and non-Indigenous population grew, as the share of the non-Indigenous population with a bachelor’s degree or higher outpaced the growth among the Indigenous population (+4.5 and +1.9 p.p., respectively).

Data table for Chart 2
| Indigenous identity and gender | 2016 | 2021 |
|---|---|---|
| percentage | ||
| Indigenous | ||
| Total | 11.0 | 12.9 |
| Women+ | 13.7 | 16.4 |
| Men+ | 8.0 | 9.0 |
| First Nations (single identity) | ||
| Total | 9.7 | 11.3 |
| Women+ | 12.4 | 14.7 |
| Men+ | 6.5 | 7.4 |
| Métis (single identity) | ||
| Total | 13.2 | 15.7 |
| Women+ | 15.9 | 19.5 |
| Men+ | 10.4 | 11.7 |
| Inuit (single identity) | ||
| Total | 5.3 | 6.2 |
| Women+ | 7.0 | 8.5 |
| Men+ | 3.4 | 3.7 |
| Non-Indigenous | ||
| Total | 29.3 | 33.8 |
| Women+ | 31.7 | 37.1 |
| Men+ | 26.9 | 30.4 |
|
Notes: Although sex and gender refer to two different concepts, the introduction of gender is not expected to have a significant impact on data analysis and historical comparability, given the small size of the transgender and non-binary populations. For more information on changes of concepts over time, please consult the Age, Sex at Birth and Gender Reference Guide, Census of Population, 2021. Given that the non-binary population is small, data aggregation to a two-category gender variable is sometimes necessary to protect the confidentiality of responses provided. In these cases, individuals in the category “non-binary persons” are distributed into the other two gender categories and are denoted by the “+” symbol. Prior to the 2021 Census, the category “men” referred to males and the category “women” referred to females. Starting in 2021, the category “men+” includes men, as well as some non-binary persons, and the category “women+” includes women, as well as some non-binary persons. Estimates in this figure have been adjusted to account for differences in incompletely enumerated reserves and settlements over time. Sources: Statistics Canada, Census of Population, 2016. Statistics Canada, Census of Population, 2021. |
||
These increases in the share of Indigenous people with a bachelor’s degree or higher occurred across all levels of remoteness, though some areas showed greater increases than others. For example, among First Nations people and Métis, greater increases were seen for those living in easily accessible areas (+1.8 and +2.1 p.p., respectively) when compared with very remote areas (+0.2 and +1.4 p.p., respectively).
Similarly, greater increases in the share with a bachelor’s degree or higher occurred for First Nations people with Registered or Treaty Indian status living off reserve when compared to those living on reserve (+1.6 and +0.6 p.p., respectively) as well as for Inuit living outside of Inuit Nunangat when compared with Inuit in Inuit Nunangat (+1.1 and +0.3 p.p., respectively).
While increases in postsecondary attainment among Indigenous people reflect increases in enrollment and graduation, some change over time may be due to response mobility. Response mobility describes the phenomenon by which people provide different responses over time to census questions about Indigenous identity.Note Response mobility can be influenced by a number of factors, such as legislative changes, court decisions, as well as changes in the respondents’ social environment and their understanding of their family history.Note Respondents with a high level of educational attainment who change the way they respond, from not identifying as Indigenous in past censuses to later identifying as Indigenous, can contribute to some (but not all) of the increases in educational attainment over time.
Employment rates among the Indigenous population fall below that of the non-Indigenous population, but rates are similar among those with higher levels of educational attainment
In 2020, the COVID-19 pandemic and resultant public health measures caused a significant downturn in employment and hours worked throughout Canada. Data from the Labour Force Survey indicated that following the initial phase of the pandemic, there was a trend of employment rates improving for Indigenous people living off reserve in the provinces. However, from March to May 2021, employment rates were still below pre-pandemic levels.Note
During the 2021 Census reference week, from May 2nd to May 8th, over three in five (61.2%) Indigenous adults aged 25 to 64 years were employed, where the proportion employed was 56.6% among First Nations peopleNote , 68.8% for Métis, and 55.2% for Inuit (Table 2).
The employment rate among Indigenous people was lower when compared with the non-Indigenous population (61.2% and 74.1%, respectively). However, the gap between the two groups varied greatly according to educational attainment, with the gap tending to narrow as the level of education increased. Specifically, the gap in employment rates was the greatest among those that had no certificate, diploma or degree (38.1% for Indigenous adults and 52.6% for non-Indigenous adults), while there was no gap among those with a bachelor’s degree or higher (82.6% for Indigenous adults and 82.5% for non-Indigenous adults) (Table 2). The higher employment rates for those with a higher level of education was particularly notable among First Nations people, where those with a bachelor’s degree or higher (80.8%) were more than twice as likely to be employed than those with no formal education (35.2%).
| Highest level of education | Indigenous | First Nations (single identity) | Métis (single identity) | Inuit (single identity) | Non-Indigenous |
|---|---|---|---|---|---|
| percentage | |||||
| Participation rate | |||||
| Total | 70.6 | 66.5 | 77.2 | 66.2 | 81.0 |
| No certificate, diploma or degree | 48.9 | 45.7 | 56.8 | 52.1 | 61.6 |
| High (secondary) school diploma or equivalency certificate | 68.5 | 64.7 | 74.1 | 72.5 | 74.8 |
| Postsecondary certificate or diploma below bachelor level | 79.4 | 77.2 | 82.3 | 78.4 | 83.7 |
| Bachelor’s degree or higher | 87.7 | 86.5 | 89.0 | 89.0 | 87.7 |
| Employment rate | |||||
| Total | 61.2 | 56.6 | 68.8 | 55.2 | 74.1 |
| No certificate, diploma or degree | 38.1 | 35.2 | 45.4 | 40.5 | 52.6 |
| High (secondary) school diploma or equivalency certificate | 58.0 | 53.6 | 64.5 | 60.8 | 66.3 |
| Postsecondary certificate or diploma below bachelor level | 70.4 | 67.5 | 74.3 | 67.3 | 76.9 |
| Bachelor’s degree or higher | 82.6 | 80.8 | 84.5 | 84.9 | 82.5 |
| Unemployment rate | |||||
| Total | 13.2 | 14.8 | 10.9 | 16.7 | 8.4 |
| No certificate, diploma or degree | 22.1 | 23.1 | 20.0 | 22.5 | 14.5 |
| High (secondary) school diploma or equivalency certificate | 15.3 | 17.1 | 13.0 | 16.1 | 11.3 |
| Postsecondary certificate or diploma below bachelor level | 11.3 | 12.5 | 9.6 | 14.1 | 8.1 |
| Bachelor’s degree or higher | 5.9 | 6.6 | 5.1 | 4.6 | 5.9 |
| Source: Statistics Canada, Census of Population, 2021. | |||||
Geographic differences in employment rates lessened for those with a bachelor’s degree or higher
The geographic differences in employment rates were lessened when considering those with a higher level of education. Among Indigenous adults overall, employment rates tended to decrease in more remote areas, where the lowest employment rates were seen among those living in very remote areas (Table 3).
However, for Indigenous people with a bachelor’s degree or higher, there was little difference in the employment rates across areas of remoteness (Chart 3). Among Métis, for example, this trend was reversed when considering those with a bachelor’s degree or higher, with the employment rate of those living in very remote areas being higher than that of those living in easily accessible areas (90.4% and 84.3%, respectively).
Similarly, the downward trend in employment rates with increasing remoteness was less pronounced for First Nations people and Inuit with higher levels of education.Note
| Level of remoteness | Indigenous | First Nations (single identity) | Métis (single identity) | Inuit (single identity) | Non-Indigenous |
|---|---|---|---|---|---|
| percentage | |||||
| Participation rate | |||||
| Easily accessible | 74.4 | 71.3 | 78.2 | 69.3 | 81.5 |
| Accessible | 71.4 | 66.6 | 77.4 | 71.9 | 79.8 |
| Less accessible | 69.6 | 65.3 | 76.3 | 76.1 | 78.7 |
| Remote | 66.7 | 62.8 | 75.3 | 70.9 | 78.0 |
| Very remote | 59.9 | 58.0 | 70.7 | 61.9 | 76.9 |
| Employment rate | |||||
| Easily accessible | 65.4 | 61.8 | 69.8 | 58.7 | 74.6 |
| Accessible | 62.0 | 56.1 | 69.1 | 61.2 | 73.6 |
| Less accessible | 60.3 | 55.2 | 68.2 | 65.2 | 72.4 |
| Remote | 56.8 | 52.5 | 66.6 | 60.8 | 71.0 |
| Very remote | 50.1 | 48.9 | 59.1 | 50.2 | 68.0 |
| Unemployment rate | |||||
| Easily accessible | 12.0 | 13.3 | 10.7 | 15.3 | 8.5 |
| Accessible | 13.2 | 15.7 | 10.7 | 14.9 | 7.9 |
| Less accessible | 13.4 | 15.4 | 10.6 | 14.4 | 8.1 |
| Remote | 14.8 | 16.3 | 11.5 | 14.2 | 9.0 |
| Very remote | 16.4 | 15.6 | 16.3 | 18.8 | 11.7 |
| Source: Statistics Canada, Census of Population, 2021. | |||||

Data table for Chart 3
| Indigenous identity | Easily accessible | Very remote |
|---|---|---|
| percentage | ||
| Indigenous | ||
| Total population | 65.4 | 50.1 |
| Bachelor's degree or higher | 83.4 | 83.0 |
| First Nations (single identity) | ||
| Total population | 61.8 | 48.9 |
| Bachelor's degree or higher | 82.3 | 82.3 |
| Métis (single identity) | ||
| Total population | 69.8 | 59.1 |
| Bachelor's degree or higher | 84.3 | 90.4 |
| Inuit (single identity) | ||
| Total population | 58.7 | 50.2 |
| Bachelor's degree or higher | 85.1 | 81.2 |
| Source: Statistics Canada, Census of Population, 2021. | ||
Lower levels of unemployment in Inuit Nunangat among Inuit with a bachelor’s degree or higher
The unemployment rate was also significantly lower among Indigenous adults who had attained a bachelor’s degree or a higher. During the 2021 Census reference week, 5.9% of Indigenous people with a bachelor’s degree or higher were unemployed, compared with 13.2% of Indigenous people overall. In addition, although the unemployment rate among the Indigenous population was higher than that of the non-Indigenous population (13.2% and 8.4%), the unemployment rate among those with a bachelor’s degree or higher was similar for Indigenous and non-Indigenous people (both at 5.9%) (Table 2).
Among First Nations people with Registered or Treaty Indian status who had a bachelor’s degree or higher, the unemployment rate was similar for those living on and off reserve (6.7% and 6.7%). Similarly, the trend in unemployment was lessened for Inuit with a bachelor’s degree or higher, where there was little difference in unemployment rates for Inuit living in Inuit Nunangat when compared to their counterparts living outside Inuit Nunangat (5.1% and 4.8%, respectively) (see Tables A.5 and A.6 in appendix).
Indigenous adults with a bachelor’s degree or higher were more likely to work in professional occupations than non-Indigenous adults
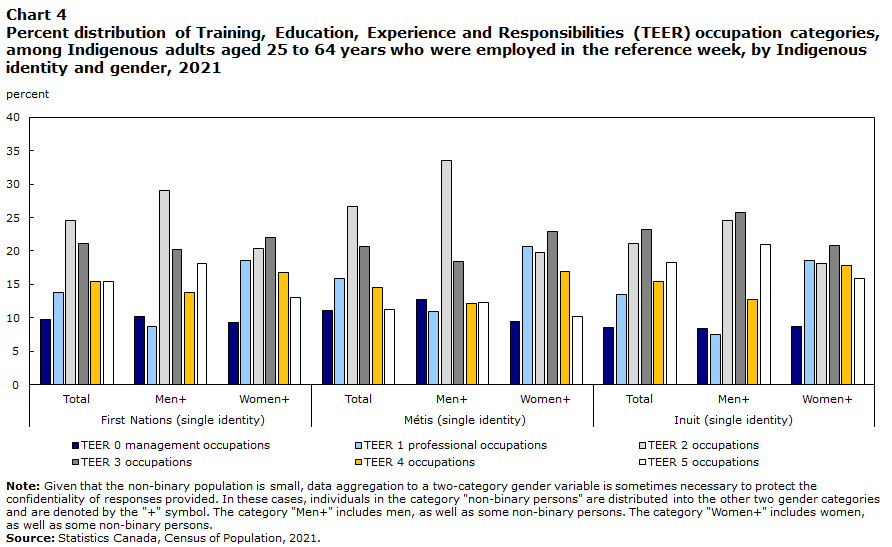
Among Indigenous adults who were employed in 2021, just over one in seven (14.7%) were employed in professional occupations (Training, Education, Experience and Responsibilities (TEER) category 1),Note which typically require a bachelor’s degree or higherNote , where the share in professional occupations was 13.8% for First Nations peopleNote , 15.9% for Métis and 13.4% among Inuit (Chart 4) (see box “Data sources, methods and definitions”). This compares to 22.9% among the non-Indigenous population.
Across all Indigenous groups, women (First Nations, 18.6%; Métis, 20.7%; Inuit, 18.6%) were approximately twice as likely to be employed in these professional occupations when compared with Indigenous men (First Nations, 8.6%; Métis, 10.9%; Inuit, 7.5%). This is in line with the fact that Indigenous women (16.4%) are more likely than their male counterparts (9.0%) to have an education at the bachelor’s level or higher. In contrast, when compared with their female counterparts, Indigenous men were more likely to work in TEER category 2 occupations, which would usually require a college diploma or apprenticeship training of two or more years or supervisory occupations.Note The higher share of men in these occupations may be due to the higher share of Indigenous men having attained an apprenticeship or trades certificate or diploma when compared to women (16.2% versus 6.4%).
Once again, the gap between the Indigenous and non-Indigenous populations disappears when only looking at those with an education at the bachelor’s level or above. First Nations peopleNote (54.8%), Métis (56.7%) and Inuit (56.5%) with a bachelor’s degree or higher were all more likely to work in professional occupations than non-Indigenous people (49.1%) and were equally likely to work in professional occupations when compared to the Canadian-born,Note non-Indigenous population (55.0%).
Furthermore, Indigenous adults were less likely to experience overqualification than non-Indigenous adults, that is, to have a higher level of education than what is typically required for the position they hold. In 2021, 9.4% of Indigenous adults with a bachelor’s degree or higher were overqualified,Note compared with 14.1% of the non-Indigenous population. Rates of overqualification for First Nations peopleNote (9.5%), Métis (9.4%) and Inuit (7.9%) were all below that of the non-Indigenous population. Nevertheless, the higher rate of overqualification among the non-Indigenous population may be partially explained by the inclusion of racialized and immigrant populations with foreign credentials, populations that have higher rates of overqualification than the non-racialized or Canadian-born population.Note For example, when the rate of overqualification among the Indigenous population is compared with that of the Canadian-born, non-Indigenous population, the rates of overqualification are similar at 9.4%.
Data table for Chart 4
| First Nations (single identity) | Métis (single identity) | Inuit (single identity) | |||||||
|---|---|---|---|---|---|---|---|---|---|
| Total | Men+ | Women+ | Total | Men+ | Women+ | Total | Men+ | Women+ | |
| percentage | |||||||||
| TEER level | |||||||||
| TEER 0 management occupations | 9.7 | 10.1 | 9.2 | 11.1 | 12.8 | 9.5 | 8.6 | 8.4 | 8.8 |
| TEER 1 professional occupations | 13.8 | 8.6 | 18.6 | 15.9 | 10.9 | 20.7 | 13.4 | 7.5 | 18.6 |
| TEER 2 occupations | 24.5 | 29.0 | 20.3 | 26.6 | 33.5 | 19.7 | 21.1 | 24.5 | 18.2 |
| TEER 3 occupations | 21.1 | 20.2 | 22.0 | 20.6 | 18.4 | 22.9 | 23.2 | 25.8 | 20.8 |
| TEER 4 occupations | 15.4 | 13.8 | 16.8 | 14.6 | 12.1 | 17.0 | 15.5 | 12.7 | 17.8 |
| TEER 5 occupations | 15.5 | 18.2 | 13.0 | 11.2 | 12.3 | 10.2 | 18.2 | 20.9 | 15.9 |
|
Note: Given that the non-binary population is small, data aggregation to a two-category gender variable is sometimes necessary to protect the confidentiality of responses provided. In these cases, individuals in the category "non-binary persons" are distributed into the other two gender categories and are denoted by the "+" symbol. The category "Men+" includes men, as well as some non-binary persons. The category "Women+" includes women, as well as some non-binary persons. Source: Statistics Canada, Census of Population, 2021. |
|||||||||
Conclusion
The share of Indigenous adults with a postsecondary qualification has been increasing over time, notably among those with a bachelor’s degree or higher.Note Results from this study indicate that though there were declines in the share of Indigenous adults reporting their highest level of education was a postsecondary certificate or diploma below bachelor level in 2021 when compared with five years earlier, the share with a bachelor’s degree or higher had increased across all Indigenous groups.
Increases in the share with a bachelor’s degree or higher among Indigenous people occurred across all levels of remoteness, on and off reserve for status First Nations people, as well as inside and outside of Inuit Nunangat for Inuit. However, the magnitude of change varied by geography, where the greatest increases occurred in regions where rates of educational attainment are already relatively high. Lower rates of educational attainment among Indigenous people living in more rural or remote areas, First Nations people living on reserve, and Inuit living in Inuit Nunangat have been well documented. Smaller increases in the rates of educational attainment for these groups contribute to a growing gap for those living in these regions. Although those living in more remote areas may face additional barriers to pursuing higher levels of education, they often benefit from a closer connection to their communities, cultures, traditions, languages, lands and resources.
Although the employment rate among Indigenous people was lower when compared with the non-Indigenous population, the gap between the two populations narrows considerably or disappears for those with a bachelor’s degree or higher. Similarly, Indigenous people with a bachelor’s degree or higher were more likely to be employed in professional occupations when compared with the non-Indigenous population, as well as less likely to be overqualified.
As past data have shown, there are significant differences in labour force outcomes between First Nations people, Métis and Inuit by level of remoteness, as well as differences between First Nations people living on and off reserve, and Inuit living inside and outside Inuit Nunangat. However, among those with a bachelor’s degree or higher, these differences are attenuated or in some cases reversed.
This study reported postsecondary educational attainment and labour force outcomes among First Nations people, Métis and Inuit using data from the 2021 Census. Although these data describe educational attainment and labour force outcomes as of May 2021, it is difficult to determine how these estimates were impacted by the COVID-19 pandemic and the resulting public health measures. Comparisons with prior census data and assessing trends over time is needed to evaluate how the pandemic impacted educational attainment and particularly labour force outcomes. Data from the 2022 Indigenous Peoples Survey will also provide a more comprehensive picture of how the pandemic impacted employment, work placements, training and courses among First Nations people living off reserve, Métis and Inuit.
Alexandria Melvin is an analyst with the Centre for Indigenous Statistics and Partnerships at Statistics Canada.
Start of text box
Data sources, methods and definitions
Data sources
Data in this article are from the 2021 Census of Population long-form questionnaire. In addition, comparisons over time were made using data from the long-form questionnaire of the 2016 Census. Further information on the 2021 Census and 2016 Census are available.Note Additional information on Census data quality, comparability for Indigenous peoplesNote and Census data related to educationNote is also available.
Methods
Comparisons between the 2021 Census and 2016 Census were conducted by adjusting for differences in incompletely enumerated reserves and settlements from one cycle to another.Note For example, if a census subdivision (CSD) that is classified as a reserve or settlement was incompletely enumerated for the 2021 or 2016 Census, it should be excluded from the tabulations for both years when comparisons between the two are made. As a result, adjusted estimates used for historical comparison may differ from those based on unadjusted data. In the 2021 Census, there were 63 incompletely enumerated reserves out of a total of 1,026 census subdivisions in Canada that were classified as on reserve. This was up from 14 incompletely enumerated reserves in 2016.
To ensure the confidentiality of responses collected for the 2021 Census and 2016 Census, a random rounding process is used to alter the values reported in individual cells. As a result, when these data are summed or grouped, the total value may not match the sum of the individual values since the total and subtotals are independently rounded. Similarly, percentage distributions, which are calculated on rounded data, may not necessarily add up to 100%. Because of random rounding, counts and percentages may vary slightly between different census products such as the analytical documents, highlight tables and data tables.
Definitions
Indigenous: Indigenous refers to whether the person identified with the Indigenous peoples of Canada. This includes those who identify as First Nations (North American Indian), Métis and/or Inuk (Inuit), and/or those who report being Registered or Treaty Indians (that is, registered under the Indian Act of Canada), and/or those who have membership in a First Nation or Indian band.
Data for Indigenous groups (First Nations, Métis or Inuit) refer to those who reported a single identity.
Gender: The sex variable in census years prior to 2021 and the two-category gender variable in the 2021 Census are combined in this analysis to make historical comparisons. Although sex and gender refer to two different concepts, the introduction of gender in 2021 is not expected to have a significant impact on data analysis and historical comparability, given the small size of the transgender and non-binary populations. For additional information on changes of concepts over time, please consult the Age, Sex at Birth and Gender Reference Guide, Census of Population, 2021.
Given that the non-binary population is small, data aggregation to a two-category gender variable is sometimes necessary to protect the confidentiality of responses. In these cases, individuals in the category “non-binary persons” are distributed into the other two gender categories. Unless otherwise indicated in the text, the category “men” includes men, as well as some non-binary persons, while the category “women” includes women, as well as some non-binary persons.
A fact sheet on gender concepts, Filling the gaps: Information on gender in the 2021 Census, is also available.
Remoteness: Statistics Canada’s Index of Remoteness was used to quantify the extent to which a CSD is remote, or far from neighbouring population centres. For each CSD, the remoteness index value was determined based on the CSD's relative proximity to all surrounding population centres within a radius that permits daily accessibility (measured in travel cost), as well as the size of those population centres (measured in population size).Note The remoteness index is a continuous index variable that provides a value for each CSD, ranging from 0 to 1, with 1 indicating the highest level of remoteness. The 2021 update of the classification of remoteness index was used to categorize remoteness index values. The Manual classification thresholds were used to classify remoteness index values into five categories of remoteness: easily accessible, accessible, less accessible, remote and very remote areas.Note
Training, Education, Experience and Responsibilities (TEER) category: A TEER category is defined by the amount and type of training and education required to enter and perform the duties of an occupation. It also takes into consideration the experience required and the complexity of responsibilities involved in the work. Each TEER category reflects commonly accepted paths to employment in an occupation.Note The TEER concept replaces the skill-level concept in the National Occupational Classification 2021.
Appendix
| Highest level of education | First Nations people (single identity) | First Nations people (single identity) with Registered or Treaty Indian status | First Nations people (single identity) without Registered or Treaty Indian status | ||||||
|---|---|---|---|---|---|---|---|---|---|
| Total | Men+ | Women+ | Total | Men+ | Women+ | Total | Men+ | Women+ | |
| percentage | |||||||||
| No certificate, diploma or degree | 26.0 | 30.0 | 22.6 | 29.1 | 33.2 | 25.5 | 17.3 | 20.7 | 14.3 |
| High (secondary) school diploma or equivalency certificate | 28.6 | 29.9 | 27.5 | 28.4 | 29.3 | 27.6 | 29.3 | 31.8 | 27.1 |
| Postsecondary certificate, diploma or degree | 45.3 | 40.1 | 49.9 | 42.5 | 37.5 | 46.8 | 53.4 | 47.5 | 58.6 |
| Postsecondary certificate or diploma below bachelor level | 34.0 | 32.7 | 35.2 | 32.1 | 31.0 | 33.1 | 39.5 | 37.7 | 41.0 |
| Apprenticeship or trades certificate or diploma | 10.4 | 15.0 | 6.4 | 9.6 | 14.3 | 5.6 | 12.6 | 17.1 | 8.7 |
| College, CEGEP or other non-university certificate or diploma | 20.9 | 15.9 | 25.3 | 19.7 | 14.9 | 23.9 | 24.5 | 18.8 | 29.3 |
| University certificate or diploma below bachelor level | 2.7 | 1.8 | 3.4 | 2.8 | 1.9 | 3.6 | 2.4 | 1.8 | 3.0 |
| Bachelor’s degree or higher | 11.3 | 7.4 | 14.7 | 10.4 | 6.6 | 13.7 | 13.9 | 9.7 | 17.5 |
|
Note: Given that the non-binary population is small, data aggregation to a two-category gender variable is sometimes necessary to protect the confidentiality of responses provided. In these cases, individuals in the category "non-binary persons" are distributed into the other two gender categories and are denoted by the "+" symbol. The category "Men+" includes men, as well as some non-binary persons. The category "Women+" includes women, as well as some non-binary persons. Source: Statistics Canada, Census of Population, 2021. |
|||||||||
| Highest level of education | All Inuit | Inuit Nunangat | Outside Inuit Nunangat | ||||||
|---|---|---|---|---|---|---|---|---|---|
| Total | Men+ | Women+ | Total | Men+ | Women+ | Total | Men+ | Women+ | |
| percentage | |||||||||
| No certificate, diploma or degree | 43.7 | 47.1 | 40.7 | 56.8 | 59.9 | 53.8 | 18.2 | 19.1 | 17.4 |
| High (secondary) school diploma or equivalency certificate | 22.7 | 21.8 | 23.6 | 19.5 | 17.9 | 21.0 | 29.0 | 30.1 | 28.1 |
| Postsecondary certificate, diploma or degree | 33.6 | 31.2 | 35.8 | 23.7 | 22.2 | 25.2 | 52.8 | 50.7 | 54.5 |
| Postsecondary certificate or diploma below bachelor level | 27.4 | 27.5 | 27.3 | 21.0 | 21.1 | 20.9 | 39.8 | 41.4 | 38.6 |
| Apprenticeship or trades certificate or diploma | 8.8 | 13.2 | 4.7 | 7.1 | 10.5 | 3.7 | 12.1 | 19.0 | 6.6 |
| College, CEGEP or other non-university certificate or diploma | 17.2 | 13.3 | 20.6 | 12.8 | 9.9 | 15.7 | 25.7 | 20.9 | 29.5 |
| University certificate or diploma below bachelor level | 1.4 | 0.9 | 1.9 | 1.1 | 0.7 | 1.5 | 2.1 | 1.4 | 2.6 |
| Bachelor’s degree or higher | 6.2 | 3.7 | 8.5 | 2.7 | 1.1 | 4.3 | 13.0 | 9.3 | 15.9 |
|
Note: Given that the non-binary population is small, data aggregation to a two-category gender variable is sometimes necessary to protect the confidentiality of responses provided. In these cases, individuals in the category "non-binary persons" are distributed into the other two gender categories and are denoted by the "+" symbol. The category "Men+" includes men, as well as some non-binary persons. The category "Women+" includes women, as well as some non-binary persons. Source: Statistics Canada, Census of Population, 2021. |
|||||||||
| Highest level of education | All First Nations people | On reserve | Off reserve | ||||||
|---|---|---|---|---|---|---|---|---|---|
| Total | Men+ | Women+ | Total | Men+ | Women+ | Total | Men+ | Women+ | |
| percentage | |||||||||
| No certificate, diploma or degree | 29.1 | 33.2 | 25.5 | 40.0 | 44.6 | 35.6 | 22.6 | 25.7 | 20.0 |
| High (secondary) school diploma or equivalency certificate | 28.4 | 29.3 | 27.6 | 26.0 | 25.5 | 26.5 | 29.8 | 31.7 | 28.3 |
| Postsecondary certificate, diploma or degree | 42.5 | 37.5 | 46.8 | 34.0 | 30.0 | 37.9 | 47.6 | 42.5 | 51.7 |
| Postsecondary certificate or diploma below bachelor level | 32.1 | 31.0 | 33.1 | 27.9 | 26.9 | 28.9 | 34.6 | 33.7 | 35.4 |
| Apprenticeship or trades certificate or diploma | 9.6 | 14.3 | 5.6 | 9.2 | 13.3 | 5.2 | 9.9 | 14.9 | 5.8 |
| College, CEGEP or other non-university certificate or diploma | 19.7 | 14.9 | 23.9 | 15.7 | 11.6 | 19.7 | 22.1 | 17.0 | 26.3 |
| University certificate or diploma below bachelor level | 2.8 | 1.9 | 3.6 | 3.0 | 2.0 | 4.1 | 2.6 | 1.8 | 3.3 |
| Bachelor’s degree or higher | 10.4 | 6.6 | 13.7 | 6.1 | 3.1 | 9.0 | 12.9 | 8.8 | 16.3 |
|
Note: Given that the non-binary population is small, data aggregation to a two-category gender variable is sometimes necessary to protect the confidentiality of responses provided. In these cases, individuals in the category "non-binary persons" are distributed into the other two gender categories and are denoted by the "+" symbol. The category "Men+" includes men, as well as some non-binary persons. The category "Women+" includes women, as well as some non-binary persons. Source: Statistics Canada, Census of Population, 2021. |
|||||||||
| Highest level of education | First Nations people (single identity) | First Nations people (single identity) with Registered or Treaty Indian status | First Nations people (single identity) without Registered or Treaty Indian status |
|---|---|---|---|
| percentage | |||
| Participation rate | |||
| Total - Highest certificate, diploma or degree | 66.5 | 63.9 | 73.9 |
| No certificate, diploma or degree | 45.7 | 43.9 | 54.3 |
| High (secondary) school diploma or equivalency certificate | 64.7 | 62.5 | 70.8 |
| Postsecondary certificate, diploma or degree | 79.5 | 78.5 | 81.9 |
| Postsecondary certificate or diploma below bachelor level | 77.2 | 75.9 | 80.2 |
| Bachelor’s degree or higher | 86.5 | 86.3 | 86.9 |
| Employment rate | |||
| Total - Highest certificate, diploma or degree | 56.6 | 53.7 | 64.8 |
| No certificate, diploma or degree | 35.2 | 33.4 | 43.8 |
| High (secondary) school diploma or equivalency certificate | 53.6 | 51.2 | 60.2 |
| Postsecondary certificate, diploma or degree | 70.8 | 69.4 | 74.2 |
| Postsecondary certificate or diploma below bachelor level | 67.5 | 65.7 | 71.7 |
| Bachelor’s degree or higher | 80.8 | 80.5 | 81.3 |
| Unemployment rate | |||
| Total - Highest certificate, diploma or degree | 14.8 | 15.9 | 12.3 |
| No certificate, diploma or degree | 23.1 | 24.0 | 19.3 |
| High (secondary) school diploma or equivalency certificate | 17.1 | 18.0 | 15.0 |
| Postsecondary certificate, diploma or degree | 10.9 | 11.6 | 9.5 |
| Postsecondary certificate or diploma below bachelor level | 12.5 | 13.4 | 10.6 |
| Bachelor’s degree or higher | 6.6 | 6.7 | 6.4 |
| Source: Statistics Canada, Census of Population, 2021. | |||
| Highest level of education | Total | On reserve | Off reserve |
|---|---|---|---|
| percentage | |||
| Participation rate | |||
| Total | 63.9 | 56.4 | 68.3 |
| No certificate, diploma or degree | 43.9 | 41.7 | 46.3 |
| High (secondary) school diploma or equivalency certificate | 62.5 | 56.5 | 65.6 |
| Postsecondary certificate or diploma below bachelor level | 75.9 | 71.8 | 77.9 |
| Bachelor’s degree or higher | 86.3 | 81.6 | 87.6 |
| Employment rate | |||
| Total | 53.7 | 47.1 | 57.7 |
| No certificate, diploma or degree | 33.4 | 32.6 | 34.2 |
| High (secondary) school diploma or equivalency certificate | 51.2 | 46.6 | 53.7 |
| Postsecondary certificate or diploma below bachelor level | 65.7 | 62.2 | 67.5 |
| Bachelor’s degree or higher | 80.5 | 76.3 | 81.8 |
| Unemployment rate | |||
| Total | 15.9 | 16.5 | 15.6 |
| No certificate, diploma or degree | 24.0 | 22.0 | 26.0 |
| High (secondary) school diploma or equivalency certificate | 18.0 | 17.6 | 18.1 |
| Postsecondary certificate or diploma below bachelor level | 13.4 | 13.4 | 13.4 |
| Bachelor’s degree or higher | 6.7 | 6.7 | 6.7 |
| Source: Statistics Canada, Census of Population, 2021. | |||
| Highest level of education | Total | Inuit Nunangat | Outside Inuit Nunangat |
|---|---|---|---|
| percentage | |||
| Participation rate | |||
| Total | 66.2 | 62.9 | 72.8 |
| No certificate, diploma or degree | 52.1 | 52.7 | 48.6 |
| High (secondary) school diploma or equivalency certificate | 72.5 | 72.9 | 71.9 |
| Postsecondary certificate or diploma below bachelor level | 78.4 | 77.9 | 78.9 |
| Bachelor’s degree or higher | 89.0 | 86.8 | 89.6 |
| Employment rate | |||
| Total | 55.2 | 51.8 | 61.8 |
| No certificate, diploma or degree | 40.5 | 41.2 | 36.1 |
| High (secondary) school diploma or equivalency certificate | 60.8 | 62.0 | 59.3 |
| Postsecondary certificate or diploma below bachelor level | 67.3 | 66.9 | 67.8 |
| Bachelor’s degree or higher | 84.9 | 82.5 | 85.3 |
| Unemployment rate | |||
| Total | 16.7 | 17.6 | 15.1 |
| No certificate, diploma or degree | 22.5 | 21.9 | 25.8 |
| High (secondary) school diploma or equivalency certificate | 16.1 | 15.0 | 17.4 |
| Postsecondary certificate or diploma below bachelor level | 14.1 | 14.1 | 14.2 |
| Bachelor’s degree or higher | 4.6 | 5.1 | 4.8 |
| Source: Statistics Canada, Census of Population, 2021. | |||
- Date modified: