
Experiences of discrimination among the Black and Indigenous populations in Canada, 2019
by Adam Cotter, Canadian Centre for Justice and Community Safety Statistics
Highlights
- According to the 2019 General Social Survey (GSS) on Canadians’ Safety, nearly half (46%) of Black people aged 15 years and older reported experiencing at least one form of discrimination in the past 5 years, compared to 16% of the non-Indigenous, non-visible minority population.
- Of all Black people, four in ten (41%) experienced discrimination based on their race or skin colour, about 15 times higher than the proportion among the non-Indigenous, non-visible minority population (3%).
- Experiences of discrimination were much more common among Canadian-born Black people (65%E) than among Black immigrants (36%).
- Data from the GSS show that a considerably higher proportion of Black people experienced discrimination in 2019 than in 2014 (46% versus 28%).
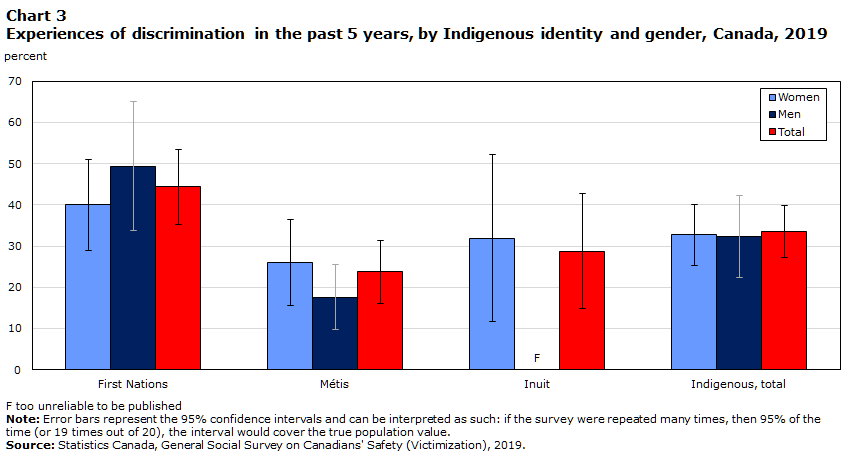
- Discrimination was more common among the Indigenous population than among populations who are both non-Indigenous and non-visible minority (33% versus 16%). More specifically, 44% of First Nations people had experienced discrimination in the 5 years preceding the survey, as had 24% of Métis and 29% of Inuit.
- Among those who were discriminated against, 21% of Indigenous people and 16%E of Black people said it was when dealing with police, compared with 4% of non-Indigenous, non-visible minority people who experienced discrimination.
- Experiences of discrimination were more common among Indigenous people in 2019 (33%) than they were in 2014 (23%).
Both socially and legally, Canada is a multicultural country (Canadian Multiculturalism Act; Berry 2013; Hyman et al. 2011). As a policy, multiculturalism has many goals, including recognizing and promoting the cultural and racial diversity of Canadian society, while emphasizing that this is a fundamental characteristic of Canadian identity and heritage; promoting the full and equal participation of individuals and communities in the development of Canadian society and assisting in the elimination of barriers to participation; and ensuring that individuals receive equal treatment and equal protection under the law, while respecting and valuing their diversity, among several others (Canadian Multiculturalism Act).
Despite the emphasis on multiculturalism, differential treatment and differential opportunity can still pose problems in a diverse society, and experiences of discrimination can have negative consequences for individuals (Berry 2013; Dion 2002). In Canada, discrimination on the basis of race, national or ethnic origin, colour, religion, age, sex, gender identity or expression, sexual orientation, marital status, family status, disability, or conviction for an offence which has been pardoned are formally prohibited by law (Canadian Human Rights Act).
The Canadian Human Rights Act is based on the underlying principle that all Canadians have the right to equal opportunity, regardless of these characteristics. In addition to federal legislation, each province and territory has their own human rights legislation as well. Furthermore, beyond the grounds specifically mentioned in law, Canadians may perceive discrimination on the basis of other factors, such as their language or physical appearance.
Discrimination or victimization based on individual characteristics that are visible parts of identity can also have broader ramifications beyond the individual who is targeted (Office for Democratic Institutions and Human Rights 2018; Perry 2010). These incidents or experiences can also impact the wider community to which the victims or targets belong, thereby negatively impacting society more broadly.
Using data from the 2019 General Social Survey (GSS) on Canadians’ Safety (Victimization), this Juristat article examines experiences of discrimination in daily life, with a particular focus on the experiences of the Black and First Nations, Métis, and Inuit populations living in Canada. Throughout the report, findings are compared to those who identified as neither Indigenous nor a member of a population group designated as visible minority in the Employment Equity Act – that is, primarily, those who identified as White or Caucasian.Note
This report was funded by Canadian Heritage, as part of the federal government’s Anti-Racism Strategy. In addition, it represents part of Statistics Canada’s ongoing commitment to publishing data that is disaggregated to the fullest extent possible.
Start of text box 1
Text box 1
Measuring discrimination in the General Social Survey on Victimization
In order to measure discrimination, the 2019 General Social Survey on Victimization asked respondents if, in the past 5 years, they had experienced discrimination or been treated unfairly by others in Canada because of their sex, ethnicity or culture, race or skin colour, physical appearance, religion, sexual orientation, gender identity or expression, age, physical or mental disability, language, or another reason. Those who said yes to one or more of these questions were considered to have experienced discrimination.
In addition, those who experienced discrimination for any reason were asked about certain situations in which the discrimination may have occurred: at a bank, store, or restaurant, while attending school or classes, in the work environment, when dealing with police, when dealing with the courts, when crossing the border into Canada, or in any other situation.
End of text box 1
Section 1: Discrimination among Canada’s Black population
The Black population living in Canada is diverse, and represents a population with varying backgrounds, ethnicities, experiences, and circumstances (Statistics Canada 2019; Do 2020). According to the 2016 Census of Population, the Black population represents 3.5% of the overall Canadian population, and is expected to represent between 5.0% and 5.6% of the population by 2036 (Statistics Canada 2019).
Nearly half of Black people in Canada experienced discrimination in the past 5 years
While about one in five (19%) Canadians 15 years of age and older had experienced some form of discrimination or unfair treatment in the five years preceding the 2019 GSS, this varied considerably between ethno-cultural groups. The prevalence of discrimination was almost three times higher among BlackNote people (46%) compared to non-Indigenous, non-visible minority people (16%; Table 1).
Half (49%) of Black women had experienced discrimination or unfair treatment in the past 5 years, as did more than four in ten (42%) Black men.Note In contrast, 20% of women and 13% of men who were neither Indigenous nor visible minorities were discriminated against.
The higher prevalence of discrimination among the Black population was in large part due to elevated levels of discrimination perceived to be motivated by race or skin colour or ethnicity or culture (Chart 1). For instance, four in ten (41%) Black people experienced discrimination or unfair treatment based on their race or skin colour in the five years preceding the survey, a proportion about 15 times higher than that of non-Indigenous, non-visible minority people (3%). Discrimination based on ethnicity or culture was experienced by more than one in four (27%) Black people, compared with 2% among the non-Indigenous, non-visible minority population.
Chart 1 start

Data table for Chart 1
| Reason for discrimination | BlackData table for Chart 1 Note † | Non-Indigenous, non-visible minority | ||
|---|---|---|---|---|
| percent | standard error | percent | standard error | |
| Race or skin colour | 41 | 4.8 | 3Note * | 0.2 |
| Ethnicity or culture | 27 | 5.0 | 2Note * | 0.2 |
| Language | 9 | 3.5 | 2Note * | 0.2 |
| Sex | 9 | 3.2 | 6 | 0.3 |
| Physical appearance | 9 | 2.0 | 5 | 0.3 |
| Religion | 8 | 3.0 | 2Note * | 0.2 |
| Age | 5 | 1.6 | 5 | 0.3 |
| Gender identity or expression | 2 | 0.7 | 1 | 0.2 |
| Sexual orientation | Note F: too unreliable to be published | Note F: too unreliable to be published | 1 | 0.1 |
| Physical or mental disability | Note F: too unreliable to be published | Note F: too unreliable to be published | 2 | 0.2 |
| Any other reason | Note F: too unreliable to be published | Note F: too unreliable to be published | 1 | 0.1 |
F too unreliable to be published
Source: Statistics Canada, General Social Survey on Canadians' Safety (Victimization), 2019. |
||||
Chart 1 end
In addition to race and ethnicity, discrimination on the basis of religion and language were also more common among Black people than among non-Indigenous, non-visible minority people.
As there is considerable overlap between the reasons why individuals are discriminated against, it may be difficult to disentangle the motivation for an incident of discrimination or unfair treatment. However, other individual and intersectional characteristics can influence the likelihood of facing discrimination. For example, seven in ten (70%E) Black people who had experienced discrimination in the past 5 years indicated that they had been discriminated against for more than one reason. In contrast, this was the case for 45% of non-Indigenous, non-visible minority people.
Discrimination more common among Canadian-born visible minority population
Beyond ethno-cultural groups, many other factors and characteristics can influence levels of discrimination. For example, among Black people, two-thirds (65%E) of those who were born in Canada had experienced some kind of discrimination in the past 5 years, nearly twice the proportion as among Black immigrants (36%; Table 2). A similar pattern, though to a lesser degree, was seen among those belonging to other visible minority groups; 35% of those born in Canada and 24% of those who were immigrants experienced some form of discrimination. In contrast, among non-Indigenous, non-visible minority people, there was no significant difference in the prevalence of discrimination between those who were immigrants (17%) and those who were not (16%).
Discrimination was also more commonly experienced among the relatively younger population. More than half (53%) of Black people between the ages of 15 to 44 had experienced discrimination in the 5 years preceding the survey, compared to about one-third (31%) of Black people aged 45 years and older.Note
Black people more often experience discrimination in stores, banks, or restaurants
In addition to varying levels of discrimination, there were differences in the context in which discrimination was experienced across ethno-cultural groups. For example, of those who experienced discrimination, Black (51%E) people more often experienced discrimination in a store, bank, or restaurant than did non-Indigenous, non-visible minority people (28%; Table 1).
Experiences of discrimination when dealing with the police were much more common among Black people. Among those who were discriminated against, the proportion who said it occurred when dealing with the police was four times higher among Black people (16%E) than non-Indigenous, non-visible minority people (4%). This difference is despite the fact that data from the GSS show Black people came into contact with police at similar levels as non-Indigenous, non-visible minority people (Cotter 2022; Ibrahim 2020).
Though more specific information or context of the circumstances of discrimination are not measured by the GSS, discrimination or differential treatment of Black and Indigenous people by the police has been noted elsewhere. For instance, research suggests that Black people in Canada are overrepresented as subjects of police stops and searches (Wortley and Owusu-Bempah 2011; Foster and Jacobs 2019; Ontario Human Rights Commission 2021).
There were no significant differences between the Black population and the non-Indigenous, non-visible minority population in terms of the proportion who experienced discrimination when attending school or classes, at work or when applying for a job or promotion, or when dealing with the courts.
Proportion of Black people experiencing discrimination due to race or skin colour has nearly doubled since 2014
The same questionsNote used to measure discrimination in the 2019 GSS on Victimization were also included in the 2014 GSS, which allows for an examination of experiences of self-reported discrimination over time.Note
In 2019, the proportion of Black people who reported experiencing discrimination was well above what was reported in 2014 (46% versus 28%; Chart 2). The key driver for the increase was the proportion who perceived discrimination based on their race or skin colour, which was almost two times higher in 2019 (41%) than in 2014 (23%). This increase precedes many significant demonstrations and events throughout 2020, which served to highlight many high-profile instances of misconduct, discrimination, or unfair treatment based on race.
Chart 2 start

Data table for Chart 2
| Reason for discrimination | 2014Data table for Chart 2 Note † | 2019 | ||
|---|---|---|---|---|
| percent | standard error | percent | standard error | |
| Race or skin colour | 23 | 2.1 | 41Note * | 4.8 |
| Ethnicity or culture | 20 | 2.0 | 27 | 5.0 |
| Language | 4 | 0.7 | 9 | 3.5 |
| Sex | 7 | 1.4 | 9 | 3.2 |
| Physical appearance | 6 | 1.1 | 9 | 2.0 |
| Religion | 3 | 1.0 | 8 | 3.0 |
| Age | 4 | 1.0 | 5 | 1.6 |
| Gender identity or expression | Note ..: not available for a specific reference period | Note ..: not available for a specific reference period | 2 | 0.7 |
| Sexual orientation | Note F: too unreliable to be published | Note F: too unreliable to be published | Note F: too unreliable to be published | Note F: too unreliable to be published |
| Physical or mental disability | Note F: too unreliable to be published | Note F: too unreliable to be published | Note F: too unreliable to be published | Note F: too unreliable to be published |
| Any other reason | 1 | 0.5 | Note F: too unreliable to be published | Note F: too unreliable to be published |
|
.. not available for a specific reference period F too unreliable to be published
Source: Statistics Canada, General Social Survey on Canadians' Safety (Victimization), 2014 and 2019. |
||||
Chart 2 end
Of note, discrimination also increased among the non-Indigenous, non-visible minority population over this time, albeit to a lesser extent (from 12% in 2014 to 16% in 2019).
Start of text box 2
Text box 2
Self-reported criminal victimization that was motivated by hate
Race or ethnicity accounts for motivation in half of self-reported hate-related incidents
Some of the same factors that are behind experiences of discrimination and unfair treatment can also serve as motivations for incidents of criminal victimization. According to the 2019 General Social Survey (GSS), 3% of all criminal incidents were perceived by the victim to be motivated by hatred—representing approximately 223,000 incidents. Violent incidents were more commonly believed to be hate motivated (6%).
Of all incidents perceived to be motivated by hate, over half (54%E) of respondents identified the offender’s hatred of the victim’s race or ethnicity as the motivation.Note Other commonly perceived motivators included language (32%E), sex (24%E), disability (23%E), and religion (19%E).Note
End of text box 2
Section 2: Discrimination among First Nations people, Métis, and Inuit
One in three Indigenous people experienced discrimination in the past 5 years
One-third (33%) of Indigenous people experienced discrimination in the 5 years preceding the survey, more than double the proportion for non-Indigenous, non-visible minority (16%; Table 1). Similar proportions of Indigenous women (33%) and men (32%) experienced discrimination. In both cases, these were higher proportions than what was observed among non-Indigenous, non-visible minority women (20%) and men (13%).
More specifically, 44% of First Nations people had experienced discrimination in the 5 years preceding the survey, as had 24% of Métis and 29% of Inuit (Chart 3).Note As was the case when looking at the overall Indigenous population, there were no statistically significant differences in the prevalence of discrimination between women and men among distinction groups.
Chart 3 start
Data table for Chart 3
| Gender | First Nations | Métis | Inuit | Indigenous, total | ||||
|---|---|---|---|---|---|---|---|---|
| percent | standard error | percent | standard error | percent | standard error | percent | standard error | |
| Women | 40 | 5.6 | 26 | 5.3 | 32 | 10.4 | 33 | 3.8 |
| Men | 49 | 8.0 | 18 | 4.0 | Note F: too unreliable to be published | Note F: too unreliable to be published | 32 | 5.0 |
| Total | 44 | 4.7 | 24 | 3.9 | 29 | 7.1 | 33 | 3.2 |
|
F too unreliable to be published Note: Error bars represent the 95% confidence intervals and can be interpreted as such: if the survey were repeated many times, then 95% of the time (or 19 times out of 20), the interval would cover the true population value. Source: Statistics Canada, General Social Survey on Canadians' Safety (Victimization), 2019. |
||||||||
Chart 3 end
Common reasons for the discrimination experienced by Indigenous people included ethnicity or culture (15%) and race or skin colour (14%). These proportions were approximately five times higher than among the non-Indigenous, non-visible minority population (2% and 3%, respectively).
In addition to race and ethnicity, Indigenous people were also more likely to perceive discrimination or unfair treatment due to their physical appearance (14%), physical or mental disability (7%), and religion (5%) than were non-Indigenous, non-visible minority people (5%, 2%, and 2%, respectively).
Seven in ten lesbian, gay, or bisexual Indigenous people experienced discrimination
While discrimination was more prevalent among Indigenous people, experiences of discrimination were not uniformly felt among all Indigenous people. For instance, 70%E of sexual minorityNote Indigenous people had been discriminated against or treated unfairly in the five years preceding the survey, more than twice the proportion of heterosexual Indigenous people (30%; Table 2).
Close to half (46%) of Indigenous people with a disability experienced discrimination, a proportion that was roughly twice as high as both the non-Indigenous, non-visible minority population with a disability (24%) and among Indigenous people who did not have a disability (22%).
One in five Indigenous people who experienced discrimination said it was when dealing with police
In addition to varying levels of discrimination, there were differences in the context in which discrimination was experienced across ethno-cultural groups. As was seen among the Black population, experiences of discrimination when dealing with the police were also more common among Indigenous people. Among those who were discriminated against, the proportion who said it occurred when dealing with the police was five times higher among Indigenous people (21%) than among non-Indigenous, non-visible minority people (4%).
Indigenous people were also more likely to have experienced discrimination in a bank, store, or restaurant, when compared to the non-Indigenous, non-visible minority population (42% versus 28%).
There were no significant differences between Indigenous people and non-Indigenous, non-visible minority people in terms of the proportion who experienced discrimination when attending school or classes, at work or when applying for a job or promotion, when crossing the border into Canada, or when dealing with the courts.
Increase in proportion of Indigenous people who experienced discrimination in past 5 years
Compared to the most recent previous GSS cycle in 2014, a higher proportion of Indigenous people stated that they had experienced discrimination or unfair treatment in Canada in the past 5 years in 2019 (33% versus 23%).Note
More specifically, a larger proportion of Indigenous people experienced discrimination based on their physical appearance in 2019 (14%) than in 2014 (8%; Chart 4). Discrimination on the basis of physical or mental disability was also more commonly perceived by Indigenous people in 2019 (7%) than it was in 2014 (3%).
Chart 4 start

Data table for Chart 4
| Reason for discrimination | 2014Data table for Chart 4 Note † | 2019 | ||
|---|---|---|---|---|
| percent | standard error | percent | standard error | |
| Race or skin colour | 13 | 1.4 | 14 | 2.0 |
| Ethnicity or culture | 13 | 1.4 | 15 | 2.0 |
| Language | 3 | 0.7 | 3 | 0.6 |
| Sex | 7 | 0.4 | 8 | 1.5 |
| Physical appearance | 8 | 1.1 | 14Note * | 2.0 |
| Religion | 2 | 0.5 | 5 | 1.5 |
| Age | 4 | 0.9 | 5 | 1.2 |
| Gender identity or expression | Note ...: not applicable | Note ...: not applicable | 3 | 0.9 |
| Sexual orientation | 2 | 0.6 | 2 | 1.1 |
| Physical or mental disability | 3 | 0.5 | 7Note * | 2.0 |
| Any other reason | 2 | 0.5 | 1 | 0.4 |
... not applicable
Source: Statistics Canada, General Social Survey on Canadians' Safety (Victimization), 2014 and 2019. |
||||
Chart 4 end
Start of text box 3
Text box 3
Experiences of discrimination among other population groups designated as
visible minority
In addition to the higher levels of discrimination experienced by Black and Indigenous people, when looking at other ethno-cultural groups designated as visible minorities in Canada, discrimination was also more prevalent among certain groups. Southeast Asian (39%E), Arab (32%E), Latin American (30%E), and Chinese (29%) people more commonly experienced discrimination for any reason, relative to the non-Indigenous, non-visible minority population (Chart 5).
Chart 5 start

Data table for Chart 5
| Population group or Indigenous identity | percent | standard error |
|---|---|---|
| South Asian | 22 | 2.7 |
| Chinese | 29Note * | 2.6 |
| Black | 46Note * | 4.7 |
| Filipino | 23 | 3.3 |
| Arab | 32Note E: Use with cautionNote * | 6.1 |
| Latin American | 30Note E: Use with cautionNote * | 5.2 |
| Southeast Asian | 39Note E: Use with cautionNote * | 7.3 |
| West Asian | F | 5.4 |
| Korean | F | 8.4 |
| Japanese | Note F: too unreliable to be published | 11.2 |
| Visible minority, n.i.e. | Note F: too unreliable to be published | 9.2 |
| Multiple visible minorities | Note F: too unreliable to be published | 7.9 |
| Non-Indigenous, non-visible minorityData table for Chart 5 Note † | 16 | 0.5 |
| First Nations, Métis, or Inuit | 33Note * | 3.2 |
|
E use with caution F too unreliable to be published
Source: Statistics Canada, General Social Survey on Canadians' Safety (Victimization), 2019. |
||
Chart 5 end
Among those belonging to a population group designated as a visible minorityNote , the most common motivations for discrimination or unfair treatment were race or skin colour (19%) and ethnicity or culture (17%). Close to three-quarters (72%) of visible minority people (excluding Black people) who experienced discrimination said that it was on the basis of multiple grounds included in the GSS on Victimization.
On the whole, 30% of women and 25% of men belonging to another group designated as visible minority reported experiencing discrimination in the past 5 years, a difference that was not statistically significant. In part owing to sample size, there were no statistically significant differences in terms of the proportion who experienced discrimination between women and men for any individual population group in 2019.
More than one in ten (12%) of those belonging to another group designated as a visible minority said that the discrimination they experienced was when crossing the border into Canada, six times higher than the proportion among non-Indigenous, non-visible minority people (2%).
Taken together, more than one-quarter (27%) of those belonging to population groups designated as visible minority (excluding Black people) experienced discrimination in 2019, marking an increase from 2014 (19%).
End of text box 3
Summary
Data from the General Social Survey on Victimization show that, relative to the non-Indigenous, non-visible minority population, Black and Indigenous people in Canada are more likely to face discrimination. This was particularly the case when it came to discrimination based on race, ethnicity, skin colour, or culture.
Not only were Black and Indigenous people more likely to report experiencing discrimination and unfair treatment in Canada than other population groups, the proportion who had faced such experiences has increased compared to 2014, when the General Social Survey on Victimization was last conducted.
The circumstances in which discrimination was faced also varied across population groups. Both Black and Indigenous people were far more likely to have experienced discrimination during an interaction with police, when compared to the non-Indigenous, non-visible minority population. In addition, discrimination in a store, bank, or restaurant was more commonly experienced by Black and Indigenous people.
Detailed data tables
Survey description
General Social Survey on Victimization
In 2019, Statistics Canada conducted the General Social Survey on Victimization for the seventh time. Previous cycles were conducted in 1988, 1993, 1999, 2004, 2009 and 2014. The main objective of the GSS on Victimization is to better understand issues related to the safety and security of Canadians, including perceptions of crime and the justice system, experiences of intimate partner violence, and how safe people feel in their communities. The target population was persons aged 15 and older living in the provinces and territories, except for those living full-time in institutions.
Data collection took place between April 2019 and March 2020. Responses were obtained by computer-assisted telephone interviews (CATI), in-person interviews (in the territories only) and, for the first time, the GSS on Victimization offered a self-administered internet collection option to survey respondents in the provinces and in the territorial capitals. Respondents were able to respond in the official language of their choice.
The sample size for the GSS on Victimization was 22,412 respondents, with a response rate of 37.6%. Respondents in the sample were weighted so that their responses represent the non-institutionalized Canadian population aged 15 and older.
Data limitations
With any household survey, there are some data limitations. The results are based on a sample and are therefore subject to sampling errors. Somewhat different results might have been obtained if the entire population had been surveyed.
For the quality of estimates the lower and upper bounds of the confidence intervals are presented. Confidence intervals should be interpreted as follows: if the survey were repeated many times, then 95% of the time (or 19 times out of 20), the confidence interval would cover the true population value.
References
Berry, J.W. 2013. Research on multiculturalism in Canada. International Journal of Intercultural Relations, 37, 663-675.
Canadian Human Rights Act. R.S.C., 1985, c. H-6.
Canadian Multiculturalism Act. R.S.C. 1985, c. 24 (4th Supp.)
Cotter, A. 2022. "Perceptions of and experiences with police and the justice system among the Black and Indigenous populations in Canada.” Juristat. Statistics Canada Catalogue no. 85-002-X.
Dion, K.L. 2002. The social psychology of perceived prejudice and discrimination. Canadian Psychology, 43(1), 1-10.
Do, D. 2020. Canada’s Black population: Education, labour and resilience. Ethnicity, Language and Immigration Thematic Series. Statistics Canada Catalogue no. 89-657-X2020002.
Foster, L. and Jacobs, L. 2019. Traffic Stop Race Data Collection Project II Progressing towards bias-free policing: Five years of race data on traffic stops in Ottawa. Accessed Dec 21.
Hyman, I., Meinhard, A., and Shields, J. 2011. The role of multiculturalism policy in addressing social inclusion processes in Canada. Working paper series, vol. 2011(3).
Ibrahim, D. 2020. “Public perceptions of the police in Canada’s provinces, 2019.” Juristat. Statistics Canada Catalogue no. 85-002-X.
Office for Democratic Institutions and Human Rights. 2018. Prosecuting Hate Crimes: A Practical Guide.
Ontario Human Rights Commission. 2021. Framework for change to address systemic racism in policing.
Perry, B. 2010. “Policing hate crime in a Multicultural society observations from Canada.” International Journal of Law, Crime and Justice. Vol. 38. p. 120 to 140.
Statistics Canada. 2019. Diversity of the Black population in Canada: An Overview. Statistics Canada Catalogue no. 89-657. Ottawa: Statistics Canada.
Wortley, S. and Owusu-Bempah, A. 2011. The usual suspects: Police stop and search practices in Canada. Policing and Society, 21(4), 395-407.
- Date modified: