
Ethnicity, Language and Immigration Thematic Series
Changes in the socioeconomic situation of Canada’s Black population, 2001 to 2016

Archived Content
Information identified as archived is provided for reference, research or recordkeeping purposes. It is not subject to the Government of Canada Web Standards and has not been altered or updated since it was archived. Please "contact us" to request a format other than those available.
By René Houle
Skip to text
Text begins
Acknowledgements
This report was written by René Houle, with the collaboration and input of many people. The author would first like to thank Jean-Pierre Corbeil, Éric Caron Malenfant, Hélène Maheux, Louis Cornelissen and Martin Turcotte from Statistics Canada’s Centre for Ethnocultural, Language and Immigration Statistics. Further thanks are addressed to Deniz Do, Isabelle Duncan, Marie Desnoyers, Dorcas Hindir, Nicolas Bastien and Filsan Hujaleh from the same team. They all contributed to different steps in the development and revision of the report, and enriched the analyses and improved the flow of the text.
The author would also like to recognize Carl E. James (professor, York University), Anne-Marie Livingstone (postdoctoral fellow, Harvard University), Malinda S. Smith (professor, University of Alberta), and the other members of the Working Group on Black Communities for their expert advice on this project.
The dissemination of this report would not have been possible without close collaboration with the Diversity and Sociocultural Statistics Client Services Section. In particular, the author would like to acknowledge Denis Thériault, Marie Comeau, Nathalie Villemure and Shelley Dansereau, who worked on data editing, translating and preparing numerous files for release.
Introduction
In the context of the United Nations International Decade for People of African Descent, this report seeks to provide a better understanding of the general socioeconomic condition of the Black population in Canada. It also follows up on a series of analytical documents published in 2019 and 2020 (Statistics Canada 2019; Statistics Canada 2020; Turcotte 2020) that especially highlight the diversity of the Black population, their relative youth compared with the rest of the Canadian population, some aspects of their socioeconomic situation, in particular regarding schooling among youth, as well as the perceptions and attitudes they hold toward the difficulties they may encounter.
Several other studies also helped document socioeconomic challenges common to Black populations, such as unemployment, poverty and income inequality (Block, Galabuzi and Tranjan 2019; Attaweel, Kasinitz and Dunn 2010), racism and discrimination (Maynard 2018; Waldron 2018), and unequal health outcomes (Nnorom, Onye et al. 2019).
Many recent studies on Canada’s Black population have explored the discrimination this population experiences. Discriminatory practices were noted in several social and economic areas, including the justice system and relations with police services (Maynard 2018), the immigration system, the child welfare system (Kikulwe 2016; Lavergne et al. 2009), the education system (James 2018; James 2019) and the nursing workforce (Calliste 1996). According to data from Cycle 28 of the 2014 General Social Survey on Victimization, approximately 24% of Black individuals aged 15 or older reported that they had experienced some form of discrimination because of their ethnicity, culture, race or skin colour in the five years preceding the survey. In comparison, 4.6% of the rest of the population had experienced such discrimination.Note 1
One of the main challenges faced by the Black population in Canada is postsecondary education among youth. Compared with other youth, Black youth are less likely to have attended a higher educational institution and to have earned a postsecondary diploma. This is especially prevalent among young Black men (Turcotte 2020). Studies suggest that factors contributing to this situation include certain teachers’ attitudes, behaviours and biases toward Black youth (James and Turner 2017).
There are two aspects of Black communities’ situation that are not addressed as often in the literature: changes in certain socioeconomic wellbeing indicators over time, and variations in these indicators among the Black population by sex, generation status, and region of origin or ancestry. Studies show that the Black population’s socioeconomic conditions may vary according to these characteristics. For example, some subgroups are more disadvantaged than others in terms of income (Attaweel, Kasinitz and Dunn 2010). The census of population can be used to provide information on the heterogeneity of the Black population on a historical basis.
The analyses in this report are based on data from the 2001, 2006 and 2016 censuses, as well as the 2011 National Household Survey (NHS). The population of interest is working-age adults having for the most part completed their studies, and thus comprises people aged 25 to 59. The Black population—defined as people who are part of the “Black” visible minority group—is disaggregated using four main characteristics: census year, sex, generation, and region or country of origin.
Three main research questions form the structure of this analytical report: Over the 15 years following the 2001 Census, how has the demographic and socioeconomic situation (family, education, employment, wages and low-income status) of the Black population changed, relative to other populations? Do the trends observed vary among the different subgroups that make up the Black population? To what extent is Black adults’ situation, in terms of educational and labour market outcomes, linked to family and socioeconomic conditions during childhood?
This report is divided into seven sections. Section 1 presents the immigration of Black populations to Canada in the past few decades. It especially addresses Black Caribbean and African immigration, as well as the main characteristics and some of the particularities of Black immigrants.
Section 2 covers education. It examines education levels among Canada’s Black population by sex, generation, and region of birth or ancestry, from 2001 to 2016.
These first two sections form the basis for the analyses in the subsequent ones.
Sections 3, 4 and 5 examine selected labour market participation indicators: Section 3 looks at employment and unemployment rates, Section 4 deals with employment sectors, and Section 5 looks at annual wages and overqualification rates.
Lastly, section 6 examines the low-income status of children younger than 15. In addition, Appendix tables A6 to A12 give an overview of the socioeconomic situation of Black populations for eight selected census metropolitan areas in the 2016 Census.
Section 1—Immigration of Black populations to Canada
Although Black people have lived in Canada since the beginning of colonization, the growth of the Black population to over 1 million people by 2016 was largely due to the arrival of immigrants from the Caribbean and, later, from sub-Saharan Africa. In 2016, 71% of the Black population aged 25 to 59 were immigrants, 19% were part of the second generation, and 5% were from the third generation or more. In addition, 5% were non-permanent residents (Table A1).
Caribbean families and immigration
During the 1960s, there was large-scale migration from the Caribbean after discriminatory immigration policies—based on national origin, racial group or religion—were abolished in Canada. In 1967, the points system was introduced to recruit more skilled workers (Green and Green 2004). The Caribbean immigrant population increased from barely 4,000 people in the 1951 Census to 12,400 in 1961, and to 68,000 in 1971. It surpassed 200,000 between 1981 and 1991 (Maheux and Houle 2016). From the 1950s to the 1970s, Caribbean immigrants—primarily from Jamaica and Haiti—came to Canada mainly as temporary workers, and women often found jobs as domestic workers or, later, as nurses. However, over the subsequent decades, the types of jobs they held broadened to include jobs in administration, the service sector and manufacturing (Thomas-Hope 2001).
One of the distinguishing characteristics of Caribbean immigration is its sex distribution. Studies have shown that, regardless of the destination country (United Kingdom, United States, Spain, etc.), most Caribbean migrants are women (Thomas-Hope 2001; Martinez Pizarro 2005). Canada is no exception: in 2016, 56% of Black people born in the Caribbean and Bermuda were women, while this proportion was 52% for all people born outside the country.
This characteristic of Caribbean immigration has often been linked to particular family systems found in the countries of this part of the world (Massey, Fischer and Capoferro, 2006). The typical Caribbean family is essentially characterized by a system dominated by the nuclear—the most common family structure—and matrilineal—rule of succession from the mother’s side, among other characteristics—family. This system is often said to be “matrifocal,” although this concept is not unanimously accepted (Blackwood 2005). “Matrifocality” is characterized by high rates of lone parenthood and households headed by women (Morrissey 1989), close mother–daughter relationships, relatively high incidences of common-law unions, and the presence of children from different fathers.Note 2 The matrifocal system is also often associated with an absent father during childhood, and the social and economic marginality of men (Quinlan and Flinn 2003; Quinlan 2006).
The role of family in Caribbean migration dynamics is not merely a matter of anthropological curiosity. Women from matrifocal societies often act as independent players in the migration process, while those from "patriarchal" societies are more likely to migrate as their spouses’ dependants. This migratory matrifocality is perhaps best illustrated by the fact that, according to the 2016 Census, among Black Caribbean immigrants admitted to Canada at age 25 or older since 1980, a higher proportion of men than women were admitted under the family sponsorship program (Table 1.1).Note 3 This situation is unique. In other immigrant communities in Canada, the proportion of women admitted through the family reunification program is generally more important than that of men.Note 4
Immigration from Africa
Immigration to Canada from sub-Saharan Africa is generally more recent than immigration from the Caribbean. Before the 1980s, most immigrants to Canada from Africa were of European or South Asian (primarily Indian) descent, and came mainly from Eastern Africa and Southern Africa. Since the 1990s, the number of Black immigrants to Canada from Africa has increased (Maheux and Houle 2016). As a result, in 2016, the number of Black Canadians who were born in Africa surpassed the number of those who were born in the Caribbean and Bermuda.
| Country of birth | Economic immigrants | Family-sponsored immigrants | Refugees | Other immigrants | Total | ||
|---|---|---|---|---|---|---|---|
| Principal applicants | Secondary applicants | Total | |||||
| percent | |||||||
| Women | |||||||
| Jamaica | 31.2 | 9.0 | 40.2 | 55.9 | 2.0 | 2.0 | 100.0 |
| Haiti | 26.3 | 12.5 | 38.8 | 35.8 | 18.6 | 6.8 | 100.0 |
| Trinidad and Tobago | 32.9 | 10.0 | 42.9 | 50.7 | 2.8 | 3.5 | 100.0 |
| Guyana | 23.0 | 11.4 | 34.4 | 57.7 | 3.8 | 4.2 | 100.0 |
| Barbados | 38.1 | 6.1 | 44.2 | 47.6 | 2.7 | 5.6 | 100.0 |
| Saint Vincent and the Grenadines | 15.4 | 1.0 | 16.4 | 38.7 | 26.2 | 18.7 | 100.0 |
| Grenada | 27.9 | 2.8 | 30.7 | 44.3 | 7.8 | 17.2 | 100.0 |
| Saint Lucia | 16.9 | 3.8 | 20.7 | 37.0 | 25.6 | 16.7 | 100.0 |
| Other countries | 33.3 | 11.0 | 44.2 | 45.3 | 6.7 | 3.8 | 100.0 |
| Total | 27.7 | 9.5 | 37.2 | 45.0 | 11.3 | 6.5 | 100.0 |
| Men | |||||||
| Jamaica | 17.1 | 6.5 | 23.6 | 72.8 | 1.9 | 1.6 | 100.0 |
| Haiti | 29.7 | 8.9 | 38.5 | 39.1 | 16.1 | 6.3 | 100.0 |
| Trinidad and Tobago | 19.0 | 4.3 | 23.4 | 71.8 | 1.9 | 2.9 | 100.0 |
| Guyana | 16.8 | 7.8 | 24.7 | 70.8 | 1.2 | 3.3 | 100.0 |
| Barbados | 18.1 | 1.9 | 20.0 | 77.4 | 1.9 | 0.6 | 100.0 |
| Saint Vincent and the Grenadines | 8.4 | 1.7 | 10.2 | 68.9 | 11.9 | 8.9 | 100.0 |
| Grenada | 13.9 | 3.9 | 17.9 | 69.9 | 4.6 | 7.6 | 100.0 |
| Saint Lucia | 9.4 | 2.6 | 12.0 | 67.6 | 14.7 | 5.7 | 100.0 |
| Other countries | 22.4 | 4.9 | 27.3 | 61.4 | 9.6 | 1.7 | 100.0 |
| Total | 21.9 | 6.9 | 28.7 | 58.6 | 8.6 | 4.1 | 100.0 |
| Source: Statistics Canada, 2016 Census of Population. | |||||||
Contemporary African migration is less likely to be the result of poverty, armed conflict or underdevelopment than in the past (Flahaux and De Haas 2016). Current African immigration occurs in a more general context of economic and social changes in the continent over the past few decades. Changes have been noted in demographic behaviour (Bongaarts and Casterline 2012; Clark and Hamplová 2015; Delaunay et al 2018) and in women’s participation in the urban labour force (Vause and Toma 2015; Moguérou et al 2018). Since the end of the 1980s, autonomous migration among African women has indeed increased, which has resulted in more of them migrating without their husband or as professionals, and no longer only to reunite with their spouse (Adepoju 2000; Adepoju 2005).
As the health care sector expands in the wealthiest countries (i.e., the United States, Canada, Australia, Western Europe, countries in the Arabian Peninsula), we are seeing a strong demand for nurses and for other professionals in related sectors, such as patient service associates and caregivers (Bach 2003; Aiken et al. 2014). Recruitment of workers in the health care field, which includes large proportions of women, has spread around the world, from the Philippines to the Caribbean, to India and, more recently, to sub-Saharan Africa. The number of migrants from this sector who were recruited from sub-Saharan Africa has increased rapidly since the late 1990s.
Also, the refugee population still accounts for a major portion of African immigration. According to the 2019 report by the United Nations High Commissioner for Refugees (UNHCR 2019), there were more than 6.3 million refugees in sub-Saharan Africa at the end of 2018, amounting to nearly one-third of the global refugee population. In Canada, data from the 2016 Census indicate that, among Black African immigrants admitted at 25 or older since 1980, and who were aged 25 to 59 in 2016, about 40% were admitted as refugees (Table 1.2). These same data also show that, among men, a higher percentage of Black African immigrants (39%) than Black Caribbean and Latin American immigrants (29%) were admitted under the economic program of the Canadian immigration system. For immigrants from some African countries of origin, like Cameroon, Côte d’Ivoire and Senegal, more than half of the male immigrants were admitted as a principal applicant under the economic program. This illustrates the different forms of migration from Africa, beyond refugee movements resulting from armed conflict, poverty and natural disasters.
Immigration of Black people born in other parts of the world
Black immigrants born in the Caribbean and Bermuda or in Africa represent more than 90% of all Black immigrants who lived in Canada in 2016. Two-thirds of the remaining Black immigrants were born in the following three countries: the United States, Guyana and the United Kingdom. While migration from these countries have their own rich and distinct histories, less attention will be paid to them in this document due to their smaller populations.
| Country of birth | Economic immigrants | Family-sponsored immigrants | Refugees | Other immigrants | Total | ||
|---|---|---|---|---|---|---|---|
| Principal applicants | Secondary applicants | Total | |||||
| percent | |||||||
| Women | |||||||
| Ethiopia | 3.0 | 3.6 | 6.6 | 34.9 | 58.0 | 0.5 | 100.0 |
| Somalia | 1.0 | 1.1 | 2.1 | 21.3 | 75.1 | 1.5 | 100.0 |
| Eritrea | 1.1 | 2.0 | 3.1 | 23.9 | 72.9 | 0.1 | 100.0 |
| Sudan | 4.2 | 6.3 | 10.6 | 23.9 | 65.0 | 0.6 | 100.0 |
| South Sudan | 0.0 | 0.4 | 0.4 | 14.5 | 85.1 | 0.0 | 100.0 |
| Burundi | 3.9 | 9.5 | 13.4 | 16.8 | 64.6 | 5.2 | 100.0 |
| Kenya | 33.0 | 22.6 | 55.6 | 23.8 | 18.1 | 2.5 | 100.0 |
| Zimbabwe | 8.5 | 9.0 | 17.5 | 12.8 | 59.0 | 10.7 | 100.0 |
| Rwanda | 6.4 | 7.4 | 13.8 | 16.1 | 67.4 | 2.7 | 100.0 |
| Democratic Republic of the Congo | 6.1 | 4.4 | 10.5 | 16.1 | 67.9 | 5.5 | 100.0 |
| Cameroon | 37.0 | 30.5 | 67.4 | 22.8 | 9.1 | 0.7 | 100.0 |
| Nigeria | 21.3 | 40.7 | 62.1 | 19.0 | 17.1 | 1.9 | 100.0 |
| Ghana | 12.1 | 14.8 | 26.9 | 52.0 | 18.5 | 2.7 | 100.0 |
| Côte d’Ivoire | 29.9 | 33.2 | 63.0 | 28.7 | 7.5 | 0.8 | 100.0 |
| Senegal | 35.3 | 20.7 | 56.0 | 36.7 | 6.5 | 0.9 | 100.0 |
| Guinea | 15.5 | 15.8 | 31.3 | 34.1 | 32.0 | 2.7 | 100.0 |
| Other countries | 21.7 | 18.2 | 39.9 | 24.3 | 33.7 | 2.1 | 100.0 |
| Total | 15.3 | 17.3 | 32.6 | 25.3 | 39.9 | 2.2 | 100.0 |
| Men | |||||||
| Ethiopia | 6.7 | 0.5 | 7.2 | 19.7 | 72.8 | 0.4 | 100.0 |
| Somalia | 3.4 | 0.1 | 3.5 | 11.9 | 83.6 | 1.0 | 100.0 |
| Eritrea | 1.8 | 0.1 | 1.9 | 8.8 | 89.2 | 0.0 | 100.0 |
| Sudan | 6.3 | 1.2 | 7.6 | 4.3 | 88.1 | 0.0 | 100.0 |
| South Sudan | 1.7 | 0.0 | 1.7 | 3.5 | 94.8 | 0.0 | 100.0 |
| Burundi | 15.2 | 1.3 | 16.5 | 8.2 | 70.0 | 5.4 | 100.0 |
| Kenya | 45.0 | 9.5 | 54.6 | 22.2 | 18.9 | 4.4 | 100.0 |
| Zimbabwe | 15.4 | 3.7 | 19.1 | 11.1 | 60.3 | 9.5 | 100.0 |
| Rwanda | 12.8 | 1.4 | 14.2 | 9.9 | 71.6 | 4.4 | 100.0 |
| Democratic Republic of the Congo | 12.3 | 1.8 | 14.1 | 10.2 | 69.6 | 6.1 | 100.0 |
| Cameroon | 71.4 | 9.5 | 81.0 | 11.2 | 7.5 | 0.3 | 100.0 |
| Nigeria | 51.2 | 12.0 | 63.3 | 21.2 | 13.5 | 2.0 | 100.0 |
| Ghana | 28.5 | 4.2 | 32.7 | 42.1 | 21.8 | 3.3 | 100.0 |
| Côte d’Ivoire | 72.2 | 8.2 | 80.4 | 12.5 | 6.3 | 0.9 | 100.0 |
| Senegal | 67.5 | 6.2 | 73.7 | 21.2 | 4.9 | 0.2 | 100.0 |
| Guinea | 50.5 | 2.7 | 53.2 | 21.4 | 22.6 | 2.8 | 100.0 |
| Other countries | 45.2 | 5.5 | 50.7 | 17.1 | 30.0 | 2.1 | 100.0 |
| Total | 33.9 | 5.1 | 39.0 | 17.2 | 41.7 | 2.1 | 100.0 |
| Source: Statistics Canada, 2016 Census of Population. | |||||||
Migration, family and lone parenthood
Family is an anchor for understanding the socioeconomic situation of Canada’s Black population. Many studies show a prevalence of lone parenthood among Black women in Canada (Thomas 2001; Mata 2011; Livingstone and Weinfeld 2015), and this family situation is negatively associated with their socioeconomic situation.
The link between lone parenthood and the international migration patterns of Black populations was discussed previously. Table 1.3 shows that the Black immigrant populations stand out for their prevalence of lone mothers, compared with the rest of the Canadian population. Among Black immigrant women aged 25 to 59 in 2016, about three in ten were lone parents. Meanwhile, this proportion was one in ten for other immigrant women in the same situation. While it is true that the highest proportion of lone mothers was found in women from Caribbean and Latin-American countries (more than one-third), Black immigrant women from African countries and from other parts of the world also had higher rates of lone parenthood than other immigrant women.
Table 1.3 also shows that lone parenthood not only characterizes immigrant Black populations, but also Black populations of second generation or third generation or more. In addition, significant contrasts can be observed within the Black female population between generations and places of origin.
On the one hand, immigrant women have a higher rate of lone parenthood than Canadian-born women. The gap between these two groups is larger within populations of African origin, where the proportion of lone mothers in 2016 was 25% among immigrants, compared with 13% among second-generation women. On the other hand, the percentage of lone mothers was higher among Black women in the third generation or more than among their counterparts in the second generation. This was true for the last four censuses. In all cases, lone parenthood was more frequent in Black women than in the rest of the population.
Lone parenthood was also more widespread among Black men than in the rest of the male population. However, its prevalence is still low (less than 5%) compared to what we observe in Black women.
| 2001 | 2006 | 2011 | 2016 | |
|---|---|---|---|---|
| Total | percent | |||
| Black population | 30.7 | 30.0 | 29.1 | 27.4 |
| Rest of the population | 10.1 | 10.2 | 10.4 | 10.6 |
| Immigrant women | ||||
| Black population | ||||
| Total | 32.2 | 32.0 | 30.7 | 29.2 |
| Caribbean and Latin America | 33.9 | 34.6 | 34.2 | 34.4 |
| Africa | 28.9 | 28.2 | 27.0 | 25.1 |
| Other regions | 21.2 | 20.6 | 17.5 | 18.1 |
| Rest of the population | 9.0 | 9.2 | 9.6 | 9.8 |
| Canadian-born women | ||||
| Black population | ||||
| Second generation—total | 23.8 | 22.8 | 23.4 | 23.3 |
| Caribbean and Latin America | 25.1 | 22.9 | 23.6 | 24.7 |
| Africa | 15.6 | 15.6 | 16.4 | 13.1 |
| Other regions | 20.7 | 26.9 | 26.3 | 20.0 |
| Canada (third generation or more) | 27.2 | 27.8 | 28.0 | 26.4 |
| Rest of the population | ||||
| Second generation | 8.6 | 8.7 | 9.1 | 9.2 |
| Canada (third generation or more) | 10.8 | 11.0 | 11.0 | 11.5 |
| Sources: Statistics Canada, 2001, 2006 and 2016 censuses of population; 2011 National Household Survey. | ||||
Section 2—Education
In addition to immigrant status and family structure, the highest level of education completed is another key factor linked to a population’s socioeconomic situation. A high level of education is generally associated with better labour market outcomes in terms of both access to employment and earnings. Education can also be a component of cultural capital, and can contribute to parents’ educational aspirations for their children (James and Taylor 2008; Turcotte 2019, 2020).
This study focuses on the population with a postsecondary diploma (i.e., trades diploma, apprenticeship certificate, or college or university diploma or degree), with special attention paid to the subset of this population with a university degree.
One-third of second-generation Black women have a university degree
The general historical trend in the Canadian population can be summarized as a relatively sustained increase in both the percentage of the population with a postsecondary diploma (non‑university or university) and the percentage that more specifically holds a university degree. Charts 2.1 and 2.2 present the percentage of the population with these two education levels between 2001 and 2016.
The growth in the proportion of postsecondary graduates was higher for women than men, both in the Black population and the rest of the population. Relatively speaking, Black men did not benefit as much from the increase in education level. Since 2001, Black men have experienced slower growth (negative growth in a number of cases) in the proportion of postsecondary graduates compared with other men. The proportion of postsecondary graduates has even decreased since 2006 among both Black immigrants and Black men born in Canada, a reversal of the trend observed among other men. Canadian-born Black men also had the lowest percentages of postsecondary graduates.
While they are not exactly the same, the proportions observed for university graduates are generally similar to those for all postsecondary graduates. However, the gap between men and women presents differently, with men being less disadvantaged in terms of having a university degree, except in the second generation.

Data table for Chart 2.1
| Black women | Other women | Black men | Other men | |
|---|---|---|---|---|
| percent | ||||
| Total population | ||||
| 2001 | 56.9 | 54.3 | 55.8 | 55.1 |
| 2006 | 67.1 | 61.9 | 63.3 | 61.4 |
| 2011 | 68.8 | 66.4 | 64.5 | 63.9 |
| 2016 | 70.7 | 68.6 | 62.6 | 63.6 |
| Immigrants | ||||
| 2001 | 56.7 | 54.8 | 57.5 | 61.4 |
| 2006 | 67.0 | 63.9 | 65.2 | 68.3 |
| 2011 | 68.2 | 68.6 | 66.2 | 70.5 |
| 2016 | 70.0 | 69.9 | 64.5 | 69.1 |
| Second generation | ||||
| 2001 | 70.7 | 61.8 | 56.9 | 61.1 |
| 2006 | 76.6 | 68.4 | 62.2 | 65.9 |
| 2011 | 77.6 | 72.3 | 62.4 | 68.2 |
| 2016 | 77.6 | 74.1 | 59.3 | 67.4 |
| Third generation or more | ||||
| 2001 | 48.3 | 52.4 | 41.1 | 51.7 |
| 2006 | 54.2 | 59.5 | 46.3 | 58.0 |
| 2011 | 55.0 | 63.9 | 47.7 | 60.3 |
| 2016 | 56.5 | 66.5 | 44.8 | 60.2 |
| Sources: Statistics Canada, 2001, 2006 and 2016 censuses of population; 2011 National Household Survey. | ||||

Data table for Chart 2.2
| Black women | Other women | Black men | Other men | |
|---|---|---|---|---|
| percent | ||||
| Total population | ||||
| 2001 | 14.4 | 20.3 | 19.0 | 20.6 |
| 2006 | 18.8 | 24.4 | 22.2 | 22.9 |
| 2011 | 23.5 | 28.5 | 26.7 | 24.7 |
| 2016 | 27.5 | 32.7 | 27.7 | 26.7 |
| Immigrants | ||||
| 2001 | 12.9 | 25.6 | 19.4 | 30.6 |
| 2006 | 16.6 | 32.1 | 23.0 | 35.9 |
| 2011 | 21.6 | 37.5 | 28.7 | 39.2 |
| 2016 | 25.4 | 43.0 | 29.8 | 42.4 |
| Second generation | ||||
| 2001 | 28.9 | 26.1 | 19.7 | 24.7 |
| 2006 | 34.7 | 30.7 | 21.9 | 26.9 |
| 2011 | 34.6 | 34.7 | 21.1 | 28.7 |
| 2016 | 35.7 | 38.8 | 20.3 | 30.5 |
| Third generation or more | ||||
| 2001 | 11.1 | 17.1 | 10.5 | 16.4 |
| 2006 | 11.0 | 20.0 | 11.4 | 17.3 |
| 2011 | 14.9 | 23.2 | 13.1 | 18.2 |
| 2016 | 16.0 | 26.1 | 11.8 | 18.8 |
| Sources: Statistics Canada, 2001, 2006 and 2016 censuses of population; 2011 National Household Survey. | ||||
Chart 2.3 illustrates the relative gaps between the percentages of the Black population and of the rest of the population with a university degree.Note 5 It shows that the percentage of Black men with a university degree was higher than that of the rest of the male population in 2011 and 2016. This is true despite the lower proportion of university degree-holders among Black men compared to other men for each of the three generation groups taken separately. One explanation for this apparent contradiction is the larger demographic weight (71%) of the immigrant population within the Black population compared with the rest of the population (24%). Seeing as immigrants, both Black and non-Black, are more educated than the population born in Canada, this higher demographic weight among the Black population tends to increase education levels. The rest of the population is mainly made up of third-generation-or-more people, a group with, on average, lower educational attainment than immigrants or people from the second generation.
Aside from findings for the total male population, which are largely the result of immigration, the percentage of individuals with a university degree was lower for Black populations compared with the rest of the population—regardless of sex or generation status. Second-generation Black women were an exception; their proportion of university degree-holders was similar (higher before 2011) to that of other second-generation women.
The findings are generally similar if the total population of those with postsecondary diplomas (non-university and university) is taken into account. However, the gaps between the Black population and the rest of the population are much smaller in immigrants (Chart 2.1).

Data table for Chart 2.3
| Women | Men | |
|---|---|---|
| percent | ||
| Total population | ||
| 2001 | -29.1 | -7.9 |
| 2006 | -22.9 | -3.0 |
| 2011 | -17.7 | 8.0 |
| 2016 | -15.8 | 3.8 |
| Immigrants | ||
| 2001 | -49.7 | -36.5 |
| 2006 | -48.4 | -35.9 |
| 2011 | -42.3 | -26.7 |
| 2016 | -40.9 | -29.7 |
| Second generation | ||
| 2001 | 10.9 | -20.1 |
| 2006 | 13.0 | -18.6 |
| 2011 | -0.3 | -26.4 |
| 2016 | -7.8 | -33.6 |
| Third generation or more | ||
| 2001 | -35.2 | -35.9 |
| 2006 | -44.9 | -34.4 |
| 2011 | -35.9 | -27.9 |
| 2016 | -38.8 | -36.9 |
| Sources: Statistics Canada, 2001, 2006 and 2016 censuses of population; 2011 National Household Survey. | ||
Diversity among university graduates
A more detailed examination of individuals with a postsecondary diploma—based on region and country of birth of immigrants, and ancestry of second-generation individuals—adds nuance to some of the results presented up to now.
In 2016, the level of educational attainment of immigrants (Table 2.1) was highly heterogeneous. The percentage of Black individuals aged 25 to 59 with a postsecondary diploma (university or non-university) in 2016 varied between 40% or less among immigrants born in Somalia or Eritrea, to over 80% among immigrants from Senegal, Côte d’Ivoire, Zimbabwe, Cameroon and Nigeria. Immigrants with a university diploma showed similar diversity, with proportions ranging from 7% to more than 60% depending on the place of birth. The migratory context (e.g., immigrating as a refugee or studying in Canada before becoming a permanent resident) can help explain this diversity in educational attainment.
An analysis based on the greater regions of birth shows that the proportions of Black male immigrants from the Caribbean and Latin America with a postsecondary diploma or a university diploma were lower than those of Black male immigrants from Africa. The difference between the two populations was smaller among their female counterparts. In fact, there was an opposite relationship for the proportion holding a postsecondary diploma, as the proportion for women born in the Caribbean or Latin America in 2016 was slightly higher, compared to those born in Africa.
| Region or country of birth | Women | Men | ||
|---|---|---|---|---|
| Non-university or university postsecondary diploma | University degree only | Non-university or university postsecondary diploma | University degree only | |
| Region of birth | percent | |||
| Caribbean and Latin America | 71.7 | 17.8 | 57.0 | 15.2 |
| Africa | 68.1 | 31.5 | 70.6 | 41.8 |
| Other regions | 70.9 | 37.4 | 65.5 | 32.5 |
| Country of birth | ||||
| Jamaica | 73.4 | 19.5 | 52.1 | 12.7 |
| Haiti | 75.0 | 15.6 | 66.3 | 20.3 |
| Trinidad and Tobago | 70.8 | 21.9 | 58.6 | 13.0 |
| Guyana | 67.3 | 19.2 | 58.6 | 14.3 |
| Barbados | 71.2 | 17.6 | 55.6 | 14.4 |
| Saint Vincent and the Grenadines | 56.2 | 8.0 | 37.9 | 7.6 |
| Grenada | 58.9 | 10.1 | 44.5 | 7.0 |
| Saint Lucia | 57.0 | 14.2 | 43.0 | 8.1 |
| United Kingdom | 80.6 | 36.6 | 70.9 | 28.6 |
| United States | 75.8 | 42.6 | 62.1 | 32.2 |
| Ethiopia | 51.3 | 11.2 | 52.0 | 20.7 |
| Somalia | 35.9 | 12.4 | 39.8 | 16.0 |
| Eritrea | 38.4 | 6.8 | 40.4 | 13.2 |
| Sudan | 48.7 | 25.2 | 52.4 | 26.1 |
| South Sudan | 38.2 | 8.6 | 51.8 | 19.5 |
| Burundi | 71.8 | 34.4 | 69.9 | 39.9 |
| Kenya | 81.5 | 44.3 | 78.4 | 51.1 |
| Zimbabwe | 83.3 | 38.9 | 82.9 | 35.6 |
| Rwanda | 78.1 | 38.0 | 72.8 | 44.9 |
| Democratic Republic of the Congo | 69.8 | 22.0 | 73.0 | 36.2 |
| Cameroon | 87.2 | 55.6 | 90.2 | 67.4 |
| Nigeria | 89.6 | 62.2 | 87.1 | 67.6 |
| Ghana | 69.3 | 23.2 | 68.3 | 30.3 |
| Côte d’Ivoire | 81.1 | 37.0 | 87.2 | 55.5 |
| Senegal | 81.2 | 52.9 | 89.2 | 62.8 |
| Guinea | 78.8 | 37.1 | 82.1 | 59.4 |
| Source: Statistics Canada, 2016 Census of Population. | ||||
While the education gaps between male and female immigrants varied considerably by place of birth, with sometimes the men and sometimes the women presenting the higher proportion of graduates, this was not the case for individuals in the second generation or the third generation or more (Table 2.2).Note 6 Among the Black Canadian-born population aged 25 to 59, women had a higher educational attainment than men for all countries of ancestry considered, and for both postsecondary diplomas as a whole and university diplomas only. In 2016, the percentage of Canadian-born Black women with postsecondary diplomas was 25% to 100% higher than for men. To give a more specific example, the proportion of university graduates among second-generation Black women who originated from Jamaica was 16 percentage points higher than that of men in 2016. In the case of women and men of Haitian origin, there was a difference of 19 percentage points.
In 2016, the percentage of second-generation Black women of African ancestry with a university degree was higher than that of second-generation women with other regions of ancestry. For example, 51% of second-generation women with African ancestry had a university degree in 2016, versus 35% of women with Caribbean and Latin American ancestry, and 19% of those with other regions of ancestry (e.g., the United States, the United Kingdom or France). Among men, the respective percentages for those whose country of ancestry is in Africa and in the Caribbean and Latin America were of 35% and 18%. These gaps by ancestry group were smaller for postsecondary degrees. Although the differences are not as pronounced as they are among immigrants, differences in education between individuals from the Caribbean and Africa also exist among second-generation Black individuals.
| Region or country of ancestry | Women | Men | ||
|---|---|---|---|---|
| Non-university or university postsecondary diploma | University degree only | Non-university or university postsecondary diploma | University degree only | |
| Region of ancestry | percent | |||
| Caribbean and Latin America | 78.1 | 34.8 | 59.5 | 18.4 |
| Africa | 79.6 | 50.8 | 63.6 | 35.3 |
| Other regions | 59.8 | 19.1 | 46.8 | 14.1 |
| Country of ancestry | ||||
| Jamaica | 75.5 | 31.3 | 54.6 | 15.8 |
| Haiti | 84.5 | 37.1 | 65.8 | 18.3 |
| Trinidad and Tobago | 76.1 | 36.5 | 61.4 | 20.4 |
| Barbados | 79.4 | 39.2 | 64.4 | 22.8 |
| Guyana | 74.8 | 32.5 | 57.6 | 20.6 |
| Saint Vincent and the Grenadines | 76.1 | 35.0 | 58.3 | 17.5 |
| Grenada | 78.0 | 34.3 | 62.0 | 21.4 |
| Ghana | 81.7 | 49.8 | 65.7 | 31.4 |
| Nigeria | 86.4 | 63.3 | 75.3 | 51.5 |
| United States | 63.9 | 23.2 | 49.2 | 17.7 |
| United Kingdom | 71.9 | 32.0 | 53.9 | 22.1 |
| Canada (third generation or more) | 56.5 | 16.0 | 44.8 | 11.8 |
| Source: Statistics Canada, 2016 Census of Population. | ||||
Although earning a postsecondary diploma is generally associated with better employment and income, certain factors may alter this association and lead to difficult situations, particularly for immigrants. The location where the highest diploma was earned, whether the diplomas and experience are recognized in Canada, and overqualification (often a direct consequence of foreign education not being recognized) are some of the factors that can affect the economic situation of the Black population in Canada.
Future studies that examine certain subjects in more detail—such as the field of study and location where the postsecondary diploma was earned, the recognition of diplomas and experience acquired abroad, and the pursuit or upgrading of skills following arrival in Canada—would nuance and enrich the results presented in this section.
Section 3—Employment and unemployment
Employment and unemployment are both associated with various demographic and socioeconomic factors, such as immigrant status, family status (notably lone parenthood), sex and education. This section examines variations in the employment and unemployment rates of the Black population compared with the rest of the population.
The Black population has a lower employment rate than the rest of the population
The employment rate of the Black population aged 25 to 59 was lower than that of the rest of the population. Among this age group’s Black population in 2016, 78% of men and 71% of women were employed, compared with 83% and 76%, respectively, among their counterparts in the rest of the population.
Since 2001, employment rates have ranged between 80% and 90% for men and between 70% and 80% for women. However, employment rates among Black men declined slightly during this period (Chart 3.1). This drop was more pronounced among the third generation or more, for whom the employment rate decreased from 78% in 2001 to 70% in 2016, moving them closer to the rate of their female counterparts.
Although Black men have higher employment rates than Black women, this was no longer the case in 2016 among the second-generation population. In 2016, the employment rate of these women was 78%, thereby exceeding that of their male counterparts by 1 percentage point.

Data table for Chart 3.1
| Black women | Other women | Black men | Other men | |
|---|---|---|---|---|
| percent | ||||
| Total population | ||||
| 2001 | 71.3 | 72.3 | 80.0 | 83.7 |
| 2006 | 72.0 | 74.2 | 81.1 | 84.4 |
| 2011 | 70.0 | 74.9 | 77.7 | 83.1 |
| 2016 | 71.0 | 75.5 | 78.1 | 82.6 |
| Immigrants | ||||
| 2001 | 72.0 | 67.3 | 81.4 | 83.2 |
| 2006 | 72.1 | 68.6 | 82.4 | 84.3 |
| 2011 | 69.4 | 68.6 | 78.6 | 83.2 |
| 2016 | 70.4 | 69.9 | 79.9 | 84.2 |
| Second generation | ||||
| 2001 | 78.3 | 77.5 | 81.1 | 87.1 |
| 2006 | 78.3 | 78.9 | 81.4 | 87.0 |
| 2011 | 78.1 | 79.4 | 78.2 | 85.8 |
| 2016 | 77.9 | 79.8 | 77.0 | 85.0 |
| Third generation or more | ||||
| 2001 | 67.4 | 73.1 | 77.9 | 83.3 |
| 2006 | 68.4 | 75.4 | 77.0 | 84.1 |
| 2011 | 66.0 | 76.5 | 74.0 | 82.7 |
| 2016 | 66.7 | 77.3 | 70.0 | 81.7 |
| Sources: Statistics Canada, 2001, 2006 and 2016 censuses of population; 2011 National Household Survey. | ||||
Between 8% and 12% of Black workers are unemployed
While the employment rate of the Black population was lower than that of the rest of the population, the unemployment rate was higher. For the total Black population, for all generations, the unemployment rate was 10% in 2016 for both women and men, compared with 6% for women and 7% for men in the rest of the population (Chart 3.2). Also, the unemployment rate of the Black population has grown since 2001, mainly among men.
Black immigrant women had the highest unemployment rates in each of the four censuses, at approximately 10% or 11%, while second-generation Black women had the lowest rates among the total Black population (around 8%).

Data table for Chart 3.2
| Black women | Other women | Black men | Other men | |
|---|---|---|---|---|
| percent | ||||
| Total population | ||||
| 2001 | 10.2 | 6.0 | 9.1 | 6.3 |
| 2006 | 9.5 | 5.4 | 8.0 | 5.2 |
| 2011 | 10.9 | 5.9 | 10.4 | 6.2 |
| 2016 | 10.2 | 5.8 | 10.2 | 6.7 |
| Immigrants | ||||
| 2001 | 10.4 | 7.3 | 8.8 | 5.9 |
| 2006 | 9.7 | 7.2 | 7.7 | 5.1 |
| 2011 | 11.3 | 8.3 | 10.4 | 6.4 |
| 2016 | 10.5 | 7.5 | 9.7 | 6.0 |
| Second generation | ||||
| 2001 | 7.5 | 4.4 | 8.4 | 4.6 |
| 2006 | 7.5 | 4.3 | 7.9 | 3.9 |
| 2011 | 8.5 | 4.9 | 9.3 | 5.2 |
| 2016 | 8.2 | 4.9 | 10.7 | 5.5 |
| Third generation or more | ||||
| 2001 | 8.6 | 5.9 | 8.4 | 6.7 |
| 2006 | 8.6 | 5.0 | 8.6 | 5.4 |
| 2011 | 9.3 | 5.2 | 11.3 | 6.4 |
| 2016 | 9.3 | 5.2 | 11.8 | 7.2 |
| Sources: Statistics Canada, 2001, 2006 and 2016 censuses of population; 2011 National Household Survey. | ||||
Due to their influence on employment and unemployment rates, it is generally desirable to control for the main effects linked to age, education level and other key sociodemographic characteristics. This makes it possible to examine to what extent the relative gaps in employment and unemployment between the Black population and the rest of the population may depend on factors other than those directly related to the composition of these populations. Labour force participation (measured here using the employment and unemployment rates) varies greatly according to these sociodemographic characteristics, and these characteristics are not necessarily the same among the Black population and the rest of the population.
The results when controlling for these factors are shown in Chart 3.3 as relative gaps (expressed in percentages), with values above zero representing higher adjusted rates, and negative values, lower adjusted rates, for the Black population compared to the rest of the population. First, we see that when we account for various socioeconomic factors, the unemployment rate of Black populations remains higher than that of the rest of the population. The employment rates remain lower than those of the rest of the population, except for immigrant women, where the gap with other women disappears.
This chart also shows that the gap between the employment rate of Black populations and the rate for the rest of the population has remained relatively stable from 2001 to 2016, except for the third generation, where it has increased slightly for both men and women. In addition, adjusted employment rates for Black immigrant women were slightly higher than employment rates for other women in 2001 but this gap has since disappeared. Between 2001 and 2016, changes in the unemployment rate were rather irregular, and no clear trend emerged (see the upper part of Chart 3.3).

Data table for Chart 3.3
| Employment rate (women) | Employment rate (men) | Unemployment rate (women) | Unemployment rate (men) | |
|---|---|---|---|---|
| percent | ||||
| Total population | ||||
| 2001 | 3.9 | -2.0 | 31.8 | 36.0 |
| 2006 | 2.2 | -1.5 | 25.2 | 29.9 |
| 2011 | 0.7 | -3.6 | 28.4 | 40.9 |
| 2016 | 0.4 | -3.8 | 30.5 | 40.0 |
| Immigrants | ||||
| 2001 | 3.4 | -3.1 | 45.2 | 41.6 |
| 2006 | 2.0 | -1.6 | 33.9 | 31.8 |
| 2011 | -0.1 | -4.1 | 32.8 | 44.7 |
| 2016 | -0.7 | -3.7 | 34.6 | 41.3 |
| Second generation | ||||
| 2001 | -1.7 | -5.4 | 39.4 | 43.9 |
| 2006 | -2.1 | -4.0 | 32.8 | 38.4 |
| 2011 | -1.4 | -5.6 | 35.2 | 27.7 |
| 2016 | -2.8 | -6.5 | 33.6 | 48.7 |
| Third generation or more | ||||
| 2001 | -6.6 | -3.8 | 17.6 | 11.8 |
| 2006 | -8.3 | -4.9 | 28.8 | 28.3 |
| 2011 | -9.8 | -5.3 | 28.5 | 39.2 |
| 2016 | -8.9 | -8.6 | 29.3 | 27.2 |
|
Note: Rates are adjusted for age, census family status, level of education, place of residence, and detailed immigrant or generation status and language spoken most often at home for immigrants. Sources: Statistics Canada, 2001, 2006 and 2016 censuses of population; 2011 National Household Survey. |
||||
Immigrant women from African countries have the lowest employment rates
Compared with level of education, the employment rate varies much less from one population to another. Among Black immigrant women, the employment rate was higher for women born in the Caribbean or in Latin America than for women born in Africa. The employment rate for the latter group was 66%, compared with 75% for immigrants from the Caribbean and Latin America (see Table 3.1). Among women, immigrants from Somalia, Sudan, the Democratic Republic of the Congo and Nigeria had the lowest employment rates. Among men, the lowest adjusted employment rate was seen among immigrants from South Sudan (70%).
In 2016, several immigrant women populations from Africa had an unemployment rate equal to or greater than 10%, for both women and men. Unemployment was less widespread among Caribbean and Latin American immigrant populations than among populations born in Africa. For example, in 2016, the unemployment rate was over 15% for female Sudanese and Somalian immigrants, and between 10% and 15% for several other African immigrant populations.
| Region or country of birth | Women | Men | ||
|---|---|---|---|---|
| Employment rate | Unemployment rate | Employment rate | Unemployment rate | |
| Region of birth | percent | |||
| Caribbean and Latin America | 76.1 | 8.7 | 81.5 | 8.2 |
| Africa | 64.6 | 12.5 | 78.8 | 10.8 |
| Other regions | 69.9 | 10.4 | 78.0 | 10.7 |
| Country of birth | ||||
| Jamaica | 77.7 | 7.8 | 81.9 | 7.7 |
| Haiti | 76.1 | 9.7 | 80.6 | 9.3 |
| Trinidad and Tobago | 76.5 | 7.7 | 81.5 | 7.5 |
| Guyana | 75.4 | 9.0 | 82.9 | 6.6 |
| Barbados | 78.7 | 6.0 | 84.9 | 7.0 |
| Saint Vincent and the Grenadines | 65.3 | 11.2 | 76.0 | 10.8 |
| Grenada | 74.0 | 10.6 | 83.0 | 7.4 |
| Saint Lucia | 72.1 | 11.8 | 81.3 | 10.3 |
| United Kingdom | 81.4 | 7.0 | 83.4 | 7.6 |
| United States | 72.4 | 8.9 | 78.4 | 9.8 |
| Ethiopia | 65.4 | 10.9 | 82.0 | 7.3 |
| Somalia | 43.9 | 17.1 | 68.0 | 13.7 |
| Eritrea | 61.1 | 12.2 | 78.8 | 10.5 |
| Sudan | 45.9 | 18.7 | 74.7 | 10.4 |
| South Sudan | 59.4 | 13.2 | 70.1 | 15.7 |
| Burundi | 65.6 | 12.5 | 73.5 | 13.2 |
| Kenya | 75.2 | 7.3 | 82.4 | 8.9 |
| Zimbabwe | 82.4 | 6.5 | 85.0 | 8.8 |
| Rwanda | 67.8 | 11.1 | 81.7 | 10.3 |
| Democratic Republic of the Congo | 61.6 | 13.7 | 74.2 | 13.7 |
| Cameroon | 65.8 | 14.9 | 78.7 | 12.5 |
| Nigeria | 69.9 | 12.7 | 80.4 | 11.3 |
| Ghana | 71.6 | 10.4 | 83.5 | 8.0 |
| Côte d’Ivoire | 64.9 | 13.6 | 78.2 | 12.4 |
| Senegal | 70.1 | 11.4 | 83.6 | 9.7 |
| Guinea | 66.7 | 13.9 | 77.9 | 12.2 |
| Source: Statistics Canada, 2016 Census of Population. | ||||
Among the Canadian-born Black population, employment rates in 2016 ranged between 72% and 83% for the second generation depending on the place of ancestry, and only slight differences were found between the rates for women and men (Table 3.2).
There were more variations by place of ancestry for the unemployment rate, which ranged from 6% to 13%. Unemployment, continually higher among Black men than Black women, was more widespread for women whose region of ancestry was Africa (10%) compared with the Caribbean and Latin America (8%).
| Region or country of ancestry | Women | Men | ||
|---|---|---|---|---|
| Employment rate | Unemployment rate | Employment rate | Unemployment rate | |
| percent | ||||
| Region of ancestry | ||||
| Caribbean and Latin America | 78.3 | 8.0 | 77.3 | 10.8 |
| Africa | 75.8 | 9.6 | 73.9 | 11.3 |
| Other regions | 75.9 | 8.1 | 77.1 | 9.6 |
| Country of ancestry | ||||
| Jamaica | 76.1 | 9.0 | 75.5 | 11.3 |
| Haiti | 81.1 | 7.1 | 76.2 | 11.6 |
| Trinidad and Tobago | 78.6 | 7.4 | 80.4 | 10.0 |
| Barbados | 81.9 | 5.6 | 82.6 | 8.3 |
| Guyana | 78.0 | 7.5 | 79.5 | 11.1 |
| Saint Vincent and the Grenadines | 78.8 | 6.6 | 77.3 | 13.3 |
| Grenada | 76.7 | 10.6 | 81.5 | 8.8 |
| Ghana | 75.5 | 10.3 | 79.4 | 8.6 |
| Nigeria | 76.9 | 7.3 | 78.4 | 8.3 |
| United States | 72.0 | 9.9 | 76.9 | 9.8 |
| United Kingdom | 79.1 | 7.6 | 76.7 | 9.6 |
| Canada (third generation or more) | 66.7 | 9.3 | 70.0 | 11.8 |
| Source: Statistics Canada, 2016 Census of Population. | ||||
Section 4—Employment sectors
Employment and unemployment rates do not provide information on the quality and characteristics of the jobs, or on the extent to which the work corresponds with the skill level associated with the highest level of education attained. The question that arises is therefore whether the jobs held by Black workers are comparable with those held by the rest of the population, or whether they are mainly concentrated in certain sectors or in certain occupations. The concentration of workers in certain kinds of jobs may, along with other factors such as education or generation status, affect the workers’ employment income, a topic addressed later on.
One-third of Black women work in the health care and social assistance sector
Tables 4.1 and 4.2 show the representation of Black men and women in different industry sectors in 2016, compared with workers aged 25 to 59 in the rest of the population.
Table 4.1 shows that Black female workers were mostly concentrated in the health care and social assistance sector, as 33% of them had a job in this sector—12 percentage points more than the rest of the employed female population (21%). Among immigrant women, this gap was even wider (18 percentage points) as 37% of Black immigrant women worked in the health care and social assistance sector, compared with 19% of other immigrant women.
No other sector has such high proportions of Black female workers. Approximately 8% of Black female workers could be found in each of the other three most common industry sectors (retail trade; administrative and support, waste management and remediation services; and educational services).
Data from the 2016 Census reveal that employment in the health care and social assistance sector, and main related occupations, was prevalent among nearly all Black female immigrant workers in Canada, whether they were born in the Caribbean and Latin America or Africa.
Appendix Table A3 presents two indicators that measure the presence of Black female immigrants in the health care sector. One indicator examines the percentage employed in the health care and social assistance industry sector, and the other examines the percentage in an occupation associated with the care sector. For example, 53% of Black female immigrants from Haiti were employed in the health care sector, compared with 34% of Jamaicans, 40% of Rwandans and 43% of Nigerians.Note 7
| Sector | Black female workers | Other female workers | ||||||
|---|---|---|---|---|---|---|---|---|
| Immigrant | Second generation | Third generation or more | Total | Immigrant | Second generation | Third generation or more | Total | |
| percent | ||||||||
| Agriculture, forestry, fishing and hunting | 0.2 | 0.1 | 0.5 | 0.2 | 1.0 | 1.0 | 1.5 | 1.3 |
| Mining, quarrying, and oil and gas extraction | 0.3 | 0.2 | 0.4 | 0.3 | 0.5 | 0.6 | 0.8 | 0.7 |
| Utilities | 0.2 | 0.3 | 0.1 | 0.2 | 0.3 | 0.5 | 0.5 | 0.5 |
| Construction | 0.7 | 1.0 | 1.3 | 0.8 | 1.7 | 2.2 | 2.3 | 2.1 |
| Manufacturing | 5.4 | 2.8 | 4.0 | 4.8 | 7.9 | 4.1 | 4.9 | 5.5 |
| Wholesale trade | 2.0 | 2.5 | 2.0 | 2.1 | 3.3 | 3.0 | 2.4 | 2.7 |
| Retail trade | 7.5 | 9.7 | 11.9 | 8.3 | 11.1 | 9.7 | 10.8 | 10.7 |
| Transportation and warehousing | 2.7 | 3.3 | 3.3 | 2.9 | 2.8 | 2.8 | 2.7 | 2.7 |
| Information and cultural industries | 1.6 | 3.8 | 2.6 | 2.1 | 1.9 | 2.7 | 2.0 | 2.1 |
| Finance and insurance | 5.8 | 7.9 | 4.4 | 6.2 | 6.9 | 7.1 | 5.2 | 5.9 |
| Real estate and rental and leasing | 1.1 | 1.6 | 1.4 | 1.2 | 2.2 | 2.1 | 1.4 | 1.7 |
| Professional, scientific and technical services | 4.6 | 8.4 | 4.7 | 5.4 | 8.7 | 9.2 | 6.7 | 7.6 |
| Administrative and support, waste management and remediation services | 7.9 | 5.6 | 6.5 | 7.6 | 5.1 | 3.5 | 3.5 | 3.9 |
| Educational services | 6.9 | 9.8 | 8.5 | 7.6 | 8.1 | 14.2 | 12.3 | 11.6 |
| Health care and social assistance | 36.6 | 24.0 | 23.5 | 32.8 | 19.0 | 19.1 | 22.7 | 21.1 |
| Arts, entertainment and recreation | 0.9 | 2.1 | 2.4 | 1.2 | 1.3 | 2.1 | 1.9 | 1.8 |
| Accommodation and food services | 5.5 | 4.6 | 9.5 | 5.7 | 8.7 | 4.4 | 5.6 | 6.3 |
| Other services (excluding public administration) | 4.2 | 4.1 | 5.1 | 4.3 | 5.8 | 4.4 | 4.9 | 5.1 |
| Public administration | 5.9 | 8.2 | 8.0 | 6.3 | 3.7 | 7.2 | 8.0 | 6.8 |
| Total | 100.0 | 100.0 | 100.0 | 100.0 | 100.0 | 100.0 | 100.0 | 100.0 |
| Source: Statistics Canada, 2016 Census of Population. | ||||||||
| Sector | Black male workers | Other male workers | ||||||
|---|---|---|---|---|---|---|---|---|
| Immigrant | Second generation | Third generation or more | Total | Immigrant | Second generation | Third generation or more | Total | |
| percent | ||||||||
| Agriculture, forestry, fishing and hunting | 0.7 | 0.3 | 1.3 | 0.8 | 1.2 | 1.8 | 3.7 | 2.8 |
| Mining, quarrying, and oil and gas extraction | 1.3 | 0.7 | 2.3 | 1.2 | 1.2 | 1.7 | 3.6 | 2.7 |
| Utilities | 0.5 | 0.6 | 0.6 | 0.5 | 0.7 | 1.1 | 1.5 | 1.2 |
| Construction | 8.0 | 7.5 | 13.7 | 8.1 | 10.2 | 12.8 | 14.9 | 13.4 |
| Manufacturing | 24.2 | 17.3 | 29.0 | 23.1 | 27.4 | 28.1 | 36.6 | 32.9 |
| Wholesale trade | 4.5 | 4.4 | 3.4 | 4.3 | 4.9 | 5.3 | 5.0 | 5.0 |
| Retail trade | 7.1 | 9.9 | 8.6 | 7.9 | 8.6 | 8.7 | 8.3 | 8.4 |
| Transportation and warehousing | 12.2 | 8.6 | 8.3 | 11.1 | 9.2 | 6.2 | 6.6 | 7.1 |
| Information and cultural industries | 2.8 | 5.4 | 2.8 | 3.3 | 3.0 | 3.6 | 2.5 | 2.8 |
| Finance and insurance | 4.3 | 6.2 | 2.7 | 4.6 | 5.1 | 5.3 | 2.8 | 3.7 |
| Real estate and rental and leasing | 1.7 | 1.9 | 2.0 | 1.7 | 2.2 | 2.3 | 1.6 | 1.8 |
| Professional, scientific and technical services | 6.6 | 8.4 | 5.1 | 6.9 | 11.2 | 9.9 | 6.8 | 8.4 |
| Administrative and support, waste management and remediation services | 9.9 | 8.8 | 9.0 | 9.7 | 4.8 | 4.3 | 4.4 | 4.5 |
| Educational services | 4.3 | 4.3 | 4.2 | 4.5 | 4.0 | 5.4 | 4.5 | 4.6 |
| Health care and social assistance | 7.5 | 5.7 | 4.3 | 6.9 | 4.7 | 4.5 | 3.9 | 4.1 |
| Arts, entertainment and recreation | 1.1 | 3.4 | 2.6 | 1.7 | 1.1 | 2.0 | 1.8 | 1.7 |
| Accommodation and food services | 3.9 | 5.8 | 6.1 | 4.5 | 6.7 | 3.8 | 3.0 | 4.2 |
| Other services (excluding public administration) | 4.3 | 3.3 | 3.4 | 4.1 | 3.6 | 3.4 | 3.9 | 3.8 |
| Public administration | 5.6 | 6.8 | 8.4 | 5.8 | 3.5 | 7.3 | 8.3 | 6.9 |
| Total | 100.0 | 100.0 | 100.0 | 100.0 | 100.0 | 100.0 | 100.0 | 100.0 |
| Source: Statistics Canada, 2016 Census of Population. | ||||||||
Compared to their female counterparts, Black male workers were less concentrated in specific industry sectors. However, Table 4.2 shows that although one-third (34%) of Black male workers were employed in the primary or secondary sectors (i.e., agriculture, mining, energy, manufacturing, construction and utilities) in 2016, more than half (53%) of other male workers worked in these sectors.
The high prevalence of workers in the primary and secondary sectors for the rest of the population (other than the Black population) is linked to the high percentage of people from the third generation or more among them. In turn, these workers have a geographical distribution characterized by a more widespread presence in rural areas, small cities and medium cities compared with immigrant and second generation populations. Population distribution by industry sector varies considerably by generation and place of residence.
Let us also note that among Black male workers, 11% were employed in the transportation and warehousing sector, while 10% worked in the administrative and support, waste management and remediation services sector. Among other male workers, these proportions were 7% and 5%, respectively.
Overqualification and the location where immigrants earned their highest university degree
Another dimension of the employment situation, which is more generally a dimension of the socioeconomic situation, is overqualification. The gaps in employment rates between Black populations and the rest of the population were covered previously, as well as the differences between these two groups in terms of their concentration in different industries. However, do Black people have jobs that match their qualifications?
This study examined overqualification by using an indicator that determines the percentage of people with a university degree who were employed at a job that generally required, at most, a high school diploma. Table 4.3 presents this information for Black workers and for other workers aged 25 to 59 in 2016, by immigrant status and, for immigrants, whether the university diploma was received in Canada or abroad.
If we start by focusing on immigrants, the rate of overqualification of Black workers (26%) was close to that of the rest of immigrant workers (24%). There was also little difference between the overqualification rate of Black women (25%) and Black men (27%). However, Black immigrant men were more likely to be overqualified (27%) than other male immigrant workers (20%); this was not observed among women. The rate of overqualification was slightly higher among Black immigrant men from Africa (28%).
Table 4.3 also demonstrates that, among immigrants with a university degree, those who earned their degree abroad were more likely to be overqualified, for both men and women—33% of Black immigrants who earned a university degree abroad were overqualified, compared with 26% of all Black immigrants with this degree. Moreover, 32% of Black male immigrants who earned a university degree abroad were overqualified, compared with 26% of other male immigrants who earned it abroad. There was little difference between female immigrants who earned their university degree abroad and their male counterparts. The only exception was for Black female immigrants from Africa, who, at nearly 38%, were more likely to be employed at a job that required at most a high school diploma. In general, however, Black immigrant women were not more likely to be overqualified (34%) than other immigrant women (36%).
| Women | Men | Total | |
|---|---|---|---|
| percent | |||
| Immigrants | |||
| University degree earned in Canada or abroad | |||
| Black immigrants | 24.6 | 26.8 | 25.7 |
| Caribbean and Latin America | 19.6 | 24.2 | 21.5 |
| Africa | 29.2 | 28.2 | 28.6 |
| Other immigrants | 27.3 | 20.2 | 23.8 |
| Immigrants | |||
| University degree earned abroad | |||
| Black immigrants | 33.6 | 32.1 | 32.8 |
| Caribbean and Latin America | 28.2 | 30.2 | 29.2 |
| Africa | 37.5 | 33.4 | 35.0 |
| Other immigrants | 35.7 | 25.8 | 30.7 |
| Non-immigrants | |||
| All university degrees | |||
| Black non-immigrants | 17.0 | 19.4 | 17.8 |
| Other non-immigrants | 11.1 | 10.4 | 10.8 |
| Source: Statistics Canada, 2016 Census of Population. | |||
Among non-immigrants, both men and women were more likely to be overqualified than their counterparts in the rest of the population. In 2016, the rates of overqualification for Black men and women born in Canada were 18% and 16% respectively, while they were 10% and 11% in the rest of the population. These rates were, in all cases, lower among the Canadian-born than among immigrants.
A more in-depth study on overqualification among Black workers would help us to better understand the factors influencing these gaps, such as major field of study, age at immigration, non-recognition of credentials and discriminatory hiring practices.
Section 5—Median annual wages
Several of the characteristics that have been examined at this point—immigration, lone parenthood, education, employment and job characteristics, overqualification—are linked to wages. In this section, we examine how median annual wages have evolved between 2000 and 2015 for Black women and men, by generation, and how these wages compare to those of the rest of the population.
Median annual wages for Black men are among the lowest
Chart 5.1 shows that median annual wages (expressed in 2015 dollars) generally increased between 2000 and 2015, except among the total Black male population. Throughout this period, median annual wages for Black men remained at around $40,000 annually.
This level of annual wages observed in Black men was lower than for male workers in the rest of the population. In 2015, the median of annual wages for Black men was $41,000, compared with nearly $56,000 for other men—a gap of $15,000. This wage gap was of $12,000 in 2000 and has grown since, especially after 2010. The most important wage gap was between Black men born in Canada to immigrant parents (second generation) and other male workers, which reached $22,000 in 2015.
Wage gaps between Black women and other women were smaller. Among immigrant women, this gap usually only reached a few hundred dollars annually, peaking at $1,300 in 2005, with Black women having the higher amount. Conversely, among Canadian-born women (second generation and third generation or more), median annual wages for Black female workers were approximately $3,500 to $7,200 lower than those of other female workers, depending on the time period and the generation.

Data table for Chart 5.1
| Black women | Other women | Black men | Other men | |
|---|---|---|---|---|
| dollars | ||||
| Total population | ||||
| 2000 | 32,550 | 33,855 | 40,215 | 52,085 |
| 2005 | 33,190 | 35,095 | 40,115 | 52,555 |
| 2010 | 36,360 | 38,960 | 41,910 | 54,500 |
| 2015 | 35,665 | 39,655 | 41,145 | 55,800 |
| Immigrants | ||||
| 2000 | 32,685 | 32,550 | 40,215 | 49,600 |
| 2005 | 33,625 | 32,335 | 41,590 | 48,305 |
| 2010 | 36,910 | 35,960 | 43,430 | 49,885 |
| 2015 | 35,925 | 35,525 | 42,560 | 50,000 |
| Second generation | ||||
| 2000 | 34,855 | 38,750 | 37,990 | 56,300 |
| 2005 | 35,400 | 40,345 | 38,050 | 58,220 |
| 2010 | 38,470 | 44,285 | 40,065 | 60,640 |
| 2015 | 38,355 | 45,580 | 40,005 | 62,130 |
| Third generation or more | ||||
| 2000 | 30,025 | 33,510 | 43,845 | 51,630 |
| 2005 | 30,615 | 35,005 | 39,210 | 52,655 |
| 2010 | 32,880 | 39,030 | 42,240 | 54,705 |
| 2015 | 33,050 | 40,215 | 40,575 | 56,860 |
|
Note: Salaries are expressed in 2015 dollars. Sources: Statistics Canada, 2001, 2006 and 2016 censuses of population; 2011 National Household Survey. |
||||
To explain the differences in median annual wages between Black male workers and other workers, based on the census data, wages were adjusted (using quantile regression models) to offset the effects associated with the workers’ individual characteristics (i.e., age, family status, level of education, place of residence, language spoken most often at home and immigrants’ age at admission). Similar to employment and unemployment rates, wages vary depending on these characteristics, which are not necessarily the same for the Black population and the rest of the population.
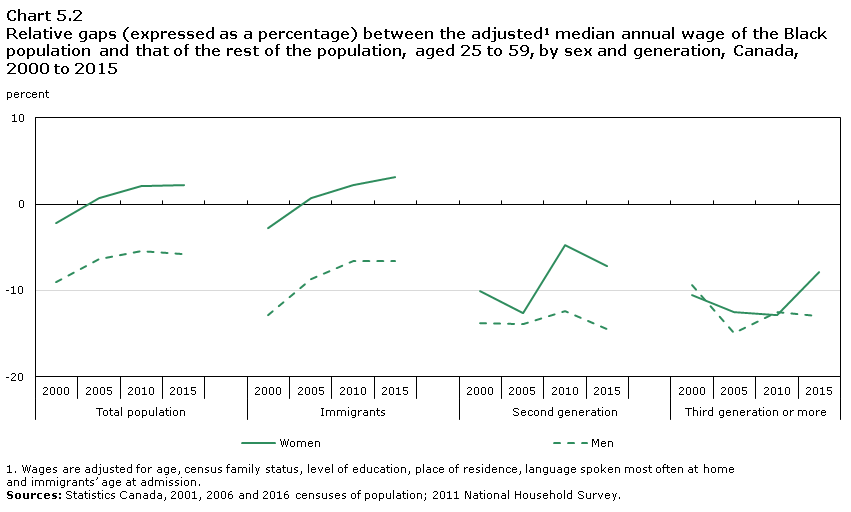
The results that take these factors into account are, as for the employment and unemployment rates, presented as relative gaps (expressed as a percentage) between the Black population and the rest of the population (Chart 5.2). As previously mentioned, a positive value indicates higher annual wages among the Black population, and a negative value, lower wages.
When the above-mentioned factors’ effects are isolated, the median annual wages of Black women increased in relation to those of other women between 2000 and 2015. Black women’s wages would have been 2% lower in 2000, and 3% higher in 2015 if their socioeconomic characteristics had been the same as those of other women. This result, which flips the one shown in Chart 5.1, is largely due to immigrant women’s wages, as the adjusted median annual wages for Black women in the second and third generation or more remained lower than those of other women throughout this period. The overrepresentation of Black immigrant women in the health care and social assistance sector helps to explain this result, as, among immigrant women, the average wages are higher for nurses than for other occupations (Cornelissen 2020).
Unlike with women, or at least immigrant women, offsetting the main population compositional effects did not close the wage gap between Black men and other men. Therefore, even if Black men and other men had the same demographic and socioeconomic characteristics, the wage gap between the two groups, although narrower, would remain. Black men in 2015 would still have median annual wages approximately 6% lower than that of other men. Among immigrants, the adjusted wage gap would range from -13% in 2000 to -7% in 2015. Among the population born in Canada to immigrant parents (second generation) and the third generation or more, this gap would remain at approximately -14% in 2015.
These results suggest that factors not measured by the census have stronger negative effects on the wages of Black men compared with Black women, especially among immigrants. Other potential factors identified in the literature and not taken into account in the regression adjustments notably include discrimination, racism, major field of study and other dimensions of social capital. A more in-depth study of the factors behind the wage gaps are beyond the scope of this document.
Data table for Chart 5.2
| Women | Men | |
|---|---|---|
| percent | ||
| Total population | ||
| 2000 | -2.2 | -9.1 |
| 2005 | 0.7 | -6.4 |
| 2010 | 2.1 | -5.4 |
| 2015 | 2.2 | -5.8 |
| Immigrants | ||
| 2000 | -2.7 | -12.8 |
| 2005 | 0.6 | -8.7 |
| 2010 | 2.2 | -6.6 |
| 2015 | 3.1 | -6.6 |
| Second generation | ||
| 2000 | -10.0 | -13.7 |
| 2005 | -12.6 | -13.8 |
| 2010 | -4.8 | -12.4 |
| 2015 | -7.2 | -14.4 |
| Third generation or more | ||
| 2000 | -10.5 | -9.3 |
| 2005 | -12.5 | -14.9 |
| 2010 | -12.8 | -12.5 |
| 2015 | -7.8 | -13.0 |
|
Note: Salaries are adjusted for age, census family status, level of education, place of residence, language spoken most often at home and immigrants’ age at admission. Sources: Statistics Canada, 2001, 2006 and 2016 censuses of population; 2011 National Household Survey. |
||
That said, a more detailed review of the median annual wages of Black populations (see Appendix tables A4 and A5) shows that, even after the compositional effects were offset for various groups of Black immigrants, immigrant workers (men and women) who were born in Africa had lower annual wages than their counterparts from the Caribbean and Latin America in 2015. Among Black workers born in Canada, both male and female, those of the second generation whose country of ancestry was in Africa had slightly lower median annual wages than those with Caribbean or Latin American ancestry. However, there were many differences in the median annual wages depending on the country of birth and the country of ancestry, as can be seen in the Appendix tables.
Section 6—Low-income status among Black children
In view of the results previously discussed, the question arises as to what extent the family and socioeconomic situation of Black populations in Canada contributes to the economic wellbeing of families and, primarily, to that of children and youth. Several “risk factors” associated with parents’ characteristics or status—such as immigrant status, lone parenthood, unemployment, low education or insufficient earnings—can have negative repercussions on children and youth, in particular because they can lead to low‑income status (Lichter and Eggebeen 1994; Thomas 2011). Furthermore, an analysis of the age structure of the Black population shows that youth make up a large proportion of the total (Statistics Canada 2019).
This section examines the low-income rate among Black children under 15. In order to put their situation in perspective, this rate was compared to the rate among other children.
Nearly one-third of Black children from Black families have low-income statusNote 8
Table 6.1 shows the percentage of children in a low-income situation by two low-income measures and generation status, for 2000 to 2015. We can see that the low-income rate for Black children is two and a half to three times higher than that observed for other children. In 2015, low-income status (according to the market basket measure [MBM]) affected 27% of Black children and 14% of other children.
In 2015, the low-income status of children born into second-generation and third-generation-or-more families were a clear contrast to the status of children born into immigrant families (based on the market basket measure). While the low‑income rate among Black children from second-generation and third-generation-or-more families was fairly similar to that of immigrants, the same was not true for children from families in the rest of the population. Approximately one-quarter of Black children from second-generation families and third-generation-or-more families had low-income status (MBM) in 2015, compared with 16% or less for other children.
| Immigrant families | Second-generation families | Third-generation-or-more families | All families | |
|---|---|---|---|---|
| percent | ||||
| Black children | ||||
| Low income before taxes | ||||
| 2000 | 46.1 | 35.5 | 35.2 | 43.4 |
| 2005 | 43.5 | 34.9 | 31.9 | 40.7 |
| 2010 | 35.8 | 28.8 | 30.0 | 34.4 |
| 2015 | 30.0 | 24.9 | 24.4 | 28.8 |
| Low income (market basket measure) | ||||
| 2015 | 27.0 | 24.3 | 26.7 | 27.2 |
| Other children | ||||
| Low income before taxes | ||||
| 2000 | 24.2 | 11.7 | 16.4 | 17.5 |
| 2005 | 25.3 | 11.2 | 14.2 | 16.5 |
| 2010 | 21.8 | 10.4 | 12.7 | 14.9 |
| 2015 | 19.2 | 8.1 | 10.3 | 12.8 |
| Low income (market basket measure) | ||||
| 2015 | 18.8 | 9.7 | 12.8 | 14.4 |
| Source: Statistics Canada, 2001, 2006 and 2016 censuses of population; 2011 National Household Survey. | ||||
Despite the gaps between the Black population and the remaining population, low-income status among children has declined over time for each generation. For example, the before-tax low-income rate for Black children born to immigrant families, which can be traced over 15 years between 2000 and 2015, fell by nearly 16 percentage points during that period—from 46% in 2000 to 30% in 2015. Although less significant, because of a lower initial level, a there was also a decrease in the low-income rate for children from other families.
One of the causes of the relatively elevated low-income rate among Black children is the level of lone parenthood observed in Black families. Nationally, further studies have established that lone parenthood accounts for nearly half of the gap between the low-income rates among Black children compared with other children. In 2015, the low-income rate was nearly twice as high among Black children compared with other children (27% and 14%, respectively). When just the influence of lone parenthood is offset,Note 9 the gap drops by more than half, to 5 percentage points, with rates of 20% among Black children and 15% among other children. However, according to several authors, racism and discrimination can manifest themselves through educational trajectories and the gaps in employment rates and wages between Black parents and other parents, which in turn have an effect on the incidence of poverty (Eggebeen and Lichter 1991; Lichter and Eggebeen 1994).
The low-income rate (MBM) of children also varies significantly within the various Black populations. In 2015, Black children aged 0 to 14 in immigrant families from five African countries (Ethiopia, Somalia, Eritrea, Sudan and South Sudan) and three Caribbean countries (Saint Vincent and the Grenadines, Saint Lucia, and Grenada) had the highest low-income rates (MBM) (i.e., rates above 30%) (Table 6.2). Low-income status (MBM) affected more than half of children from Sudanese immigrant families. Children born to immigrant families from Saint Vincent and the Grenadines had the highest low-income rate (MBM) among immigrant families from the Caribbean, at 49%.
The comparison of the measured values for African as well as and Caribbean and Latin American countries of birth shows that the low-income rate (MBM) for Black children from certain African families is lower than that of children from several other Black populations. This is especially the case for children whose families are from Western African countries such as Senegal (11%) and Côte d’Ivoire (13%), and Eastern African and Southern African countries such as Rwanda (18%) and Zimbabwe (19%).
Differences were not as significant among second-generation families. However, in 2015, five populations of Black children born to second-generation families (from Jamaica, Guyana, Ghana, the United States or the United Kingdom) were more at risk of having low-income status (MBM) than other children from this generation, with values equal to or greater than 25%.
| Low income rate (%) | |
|---|---|
| Immigrant families | |
| Region of birth: | Note ...: not applicable |
| Caribbean and Latin America | 24.3 |
| Africa | 29.5 |
| Country of birth: | Note ...: not applicable |
| Jamaica | 25.1 |
| Haiti | 17.5 |
| Trinidad and Tobago | 24.5 |
| Guyana | 25.0 |
| Barbados | 27.7 |
| Saint Vincent and the Grenadines | 48.6 |
| Grenada | 33.7 |
| Saint Lucia | 41.4 |
| United Kingdom | 14.8 |
| United States | 22.4 |
| Ethiopia | 35.5 |
| Somalia | 47.5 |
| Eritrea | 34.1 |
| Sudan | 53.1 |
| South Sudan | 46.1 |
| Burundi | 25.3 |
| Kenya | 22.6 |
| Zimbabwe | 18.7 |
| Rwanda | 17.5 |
| Democratic Republic of the Congo | 27.4 |
| Cameroon | 13.3 |
| Nigeria | 22.3 |
| Ghana | 28.4 |
| Côte d’Ivoire | 13.2 |
| Senegal | 10.9 |
| Guinea | 21.0 |
| Second- and third- generation-or-more families | |
| Region of ancestry: | Note ...: not applicable |
| Caribbean and Latin America | 25.0 |
| Africa | 27.0 |
| Country of ancestry: | Note ...: not applicable |
| Jamaica | 28.6 |
| Haiti | 15.2 |
| Trinidad and Tobago | 21.6 |
| Barbados | 18.3 |
| Guyana | 28.2 |
| Saint Vincent and the Grenadines | 22.2 |
| Grenada | 24.0 |
| Ghana | 33.1 |
| Nigeria | 18.9 |
| United States | 35.2 |
| United Kingdom | 32.1 |
| Canada (third generation or more) | 26.7 |
|
... not applicable Source: Statistics Canada, 2016 Census of Population. |
|
Conclusion
This study has shown that Black people face a number of challenges, particularly in terms of employment, wages and poverty.
The analyses also highlighted the socioeconomic diversity of the Black population. We were thus able to demonstrate the following: Black women can have significantly different labour market outcomes than men, Black immigrants differ from Black individuals born in Canada in several ways and, even within the immigrant population, there may be significant differences by country of birth.
Black populations are often at a disadvantage in the labour market. The data revealed those populations saw their employment rate decrease compared with the rest of the population between 2001 and 2016. Moreover, their annual wages were generally lower than those of the rest of the population.
Second-generation and third-generation-or-more Black men are doubly disadvantaged as they have a low employment rate and median annual wages which are lower than that of other second-generation and third-generation-or-more men.
Black Caribbean, Latin American and African immigrants are characterized by a high rate of lone parenthood (particularly among women) and by an often lower level of education than other immigrant populations. Compared with other immigrant populations, the Black immigrant population also includes a high percentage of refugees and immigrants admitted under the family reunification program, and, consequently, a lower proportion of economic immigrants.
Immigrant and second-generation women have a relatively more favourable socioeconomic status than their male counterparts. Second-generation Black women differ from Black immigrant women and women from the third generation or more in their high level of education, particularly the percentage of them who hold a diploma or university degree. In contrast to Black men, whose median annual wages remained stable between 2000 and 2015, the median annual wages of Black women increased during the same period.
In terms of employment, unemployment and wages compared with the rest of the population, Black women and men’s labour market outcomes have generally not improved between the 2001 and 2016 censuses, despite a few notable exceptions among women and immigrants. As a result, Black people generally live in more difficult economic conditions than the rest of the Canadian population.
These difficult conditions have implications on the low-income status of Black children from all generations and all origins; echoing Maynard’s finding (2018, p. 108) cited at the beginning of the text, which states that, regardless of their nationality and time spent in Canada, people with African features experience similar economic difficulties.
Turcotte (2020) showed that family income is closely tied to academic pathways and transitions to the labour market for youth in general. Among other things, a lower family income often results in a lower level of educational achievement in children.
The Black population is constantly changing, and Statistics Canada’s demographic projections (2017) indicate that it could continue to grow in the coming years, particularly because of African immigration and the continued growth of the cohorts of second-generation Black youth from this immigration.
Appendix Tables
| Generation status | Region of birth or ancestry | 2001 | 2006 | 2011 | 2016 | 2001 | 2006 | 2011 | 2016 |
|---|---|---|---|---|---|---|---|---|---|
| number | percent | ||||||||
| Immigrants | Total | 230,835 | 266,910 | 316,450 | 393,200 | 76.0 | 74.3 | 72.6 | 70.7 |
| Caribbean and Latin America | 158,255 | 160,105 | 165,435 | 177,045 | 52.1 | 44.6 | 37.9 | 31.8 | |
| Africa | 60,245 | 93,525 | 137,410 | 188,195 | 19.8 | 26.0 | 31.5 | 33.8 | |
| Other regions | 12,335 | 13,285 | 13,605 | 27,955 | 4.1 | 3.7 | 3.1 | 5.0 | |
| Second generation | Total | 31,545 | 50,850 | 74,250 | 107,035 | 10.4 | 14.2 | 17.0 | 19.2 |
| Caribbean and Latin America | 23,920 | 41,875 | 62,305 | 87,710 | 7.9 | 11.7 | 14.3 | 15.8 | |
| Africa | 1,525 | 3,605 | 5,135 | 9,955 | 0.5 | 1.0 | 1.2 | 1.8 | |
| Other regions | 6,095 | 5,370 | 6,805 | 9,370 | 2.0 | 1.5 | 1.6 | 1.7 | |
| Non-permanent residents | 22,520 | 22,040 | 23,310 | 29,850 | 7.4 | 6.1 | 5.3 | 5.4 | |
| Third generation or more | 18,970 | 19,505 | 21,955 | 26,130 | 6.2 | 5.4 | 5.0 | 4.7 | |
| Grand total | 303,875 | 359,305 | 435,960 | 556,210 | 100.0 | 100.0 | 100.0 | 100.0 | |
| Sources: Statistics Canada, 2001, 2006 and 2016 censuses of population; 2011 National Household Survey. | |||||||||
| Generation status | Country of birth or ancestry | Women | Men | Women |
|---|---|---|---|---|
| number | percent | |||
| Immigrants | Jamaica | 41,015 | 33,155 | 55.3 |
| Haiti | 31,160 | 24,775 | 55.7 | |
| Trinidad and Tobago | 5,950 | 4,895 | 54.8 | |
| Guyana | 3,940 | 3,230 | 55.0 | |
| Barbados | 2,465 | 2,140 | 53.5 | |
| Saint Vincent and the Grenadines | 4,900 | 2,485 | 66.3 | |
| Grenada | 3,890 | 2,375 | 62.1 | |
| Saint Lucia | 2,250 | 1,390 | 61.8 | |
| United Kingdom | 4,335 | 3,565 | 54.9 | |
| United States | 1,750 | 2,345 | 42.7 | |
| Ethiopia | 12,435 | 11,940 | 51.0 | |
| Somalia | 11,135 | 8,495 | 56.7 | |
| Eritrea | 4,930 | 5,115 | 49.1 | |
| Sudan | 1,645 | 1,565 | 51.3 | |
| South Sudan | 1,845 | 2,195 | 45.7 | |
| Burundi | 2,920 | 2,765 | 51.3 | |
| Kenya | 2,725 | 2,070 | 56.8 | |
| Zimbabwe | 2,570 | 2,335 | 52.4 | |
| Rwanda | 2,155 | 1,720 | 55.5 | |
| Democratic Republic of the Congo | 8,885 | 7,590 | 53.9 | |
| Cameroon | 6,405 | 6,190 | 50.8 | |
| Nigeria | 13,420 | 13,885 | 49.1 | |
| Ghana | 8,750 | 7,835 | 52.8 | |
| Côte d’Ivoire | 3,320 | 3,635 | 47.8 | |
| Senegal | 2,405 | 3,110 | 43.6 | |
| Guinea | 1,770 | 1,750 | 50.3 | |
| Second generation | Jamaica | 19,230 | 17,485 | 52.4 |
| Haiti | 10,765 | 9,855 | 52.2 | |
| Trinidad and Tobago | 4,805 | 4,560 | 51.3 | |
| Barbados | 3,235 | 2,950 | 52.3 | |
| Guyana | 2,510 | 2,170 | 53.7 | |
| Saint Vincent and the Grenadines | 1,255 | 1,095 | 53.4 | |
| Grenada | 1,325 | 1,005 | 57.0 | |
| Ghana | 1,425 | 1,245 | 53.3 | |
| Nigeria | 805 | 915 | 46.8 | |
| United States | 1,710 | 1,820 | 48.4 | |
| United Kingdom | 1,600 | 1,460 | 52.3 | |
| Source: Statistics Canada, 2016 Census of Population. | ||||
| Country of birth | Health care and social assistance sector | Occupations associated with health careTable A3 Note 1 | |
|---|---|---|---|
| percent | |||
| Black women | Jamaica | 34.0 | 26.6 |
| Haiti | 53.0 | 49.5 | |
| Trinidad and Tobago | 26.4 | 19.2 | |
| Guyana | 28.6 | 22.5 | |
| Barbados | 26.6 | 18.0 | |
| Saint Vincent and the Grenadines | 30.7 | 27.4 | |
| Grenada | 31.5 | 26.5 | |
| Saint Lucia | 27.7 | 21.3 | |
| United Kingdom | 23.5 | 14.3 | |
| United States | 24.9 | 15.7 | |
| Ethiopia | 36.2 | 29.2 | |
| Somalia | 33.1 | 27.0 | |
| Eritrea | 37.4 | 27.2 | |
| Sudan | 28.9 | 21.6 | |
| South Sudan | 33.3 | 28.3 | |
| Burundi | 34.4 | 31.5 | |
| Kenya | 38.6 | 33.8 | |
| Zimbabwe | 36.9 | 29.5 | |
| Rwanda | 39.8 | 32.5 | |
| Democratic Republic of the Congo | 38.6 | 35.7 | |
| Cameroon | 31.4 | 27.5 | |
| Nigeria | 43.3 | 36.3 | |
| Ghana | 38.6 | 33.5 | |
| Côte d’Ivoire | 32.4 | 27.8 | |
| Senegal | 20.9 | 15.5 | |
| Guinea | 38.9 | 35.2 | |
| Other countries | 29.6 | 22.6 | |
| Total | 36.7 | 30.7 | |
| Other women | Philippines | 32.4 | 25.1 |
| Total | 19.0 | 10.9 | |
|
|||
| Region or country of birth | Women | Men |
|---|---|---|
| Region of birth | number | |
| Caribbean and Latin America | 38,760 | 42,545 |
| Africa | 31,250 | 42,230 |
| Other regions | 41,055 | 44,815 |
| Country of birth | ||
| Jamaica | 43,015 | 46,995 |
| Haiti | 32,535 | 35,560 |
| Trinidad and Tobago | 43,840 | 50,580 |
| Guyana | 41,705 | 50,175 |
| Barbados | 45,595 | 47,700 |
| Saint Vincent and the Grenadines | 30,330 | 37,615 |
| Grenada | 34,455 | 44,495 |
| Saint Lucia | 31,705 | 45,205 |
| United Kingdom | 55,535 | 61,400 |
| United States | 36,235 | 42,770 |
| Ethiopia | 29,725 | 41,605 |
| Somalia | 23,515 | 37,635 |
| Eritrea | 30,035 | 38,900 |
| Sudan | 23,275 | 33,710 |
| South Sudan | 28,640 | 37,535 |
| Burundi | 29,120 | 37,555 |
| Kenya | 40,045 | 50,925 |
| Zimbabwe | 44,740 | 57,250 |
| Rwanda | 35,130 | 38,190 |
| Democratic Republic of the Congo | 29,655 | 35,975 |
| Cameroon | 27,615 | 41,435 |
| Nigeria | 36,060 | 49,385 |
| Ghana | 35,010 | 49,865 |
| Côte d’Ivoire | 22,500 | 35,675 |
| Senegal | 29,300 | 40,755 |
| Guinea | 23,320 | 36,155 |
| Source: Statistics Canada, 2016 Census of Population. | ||
| Region or country of ancestry | Women | Men |
|---|---|---|
| Region of ancestry | number | |
| Caribbean and Latin America | 38,810 | 40,200 |
| Africa | 35,985 | 37,165 |
| Other regions | 33,395 | 40,780 |
| Country of ancestry | ||
| Jamaica | 38,225 | 39,155 |
| Haiti | 37,360 | 36,395 |
| Trinidad and Tobago | 41,980 | 44,090 |
| Barbados | 42,860 | 45,735 |
| Guyana | 38,710 | 43,640 |
| Saint Vincent and the Grenadines | 36,590 | 33,110 |
| Grenada | 40,505 | 40,450 |
| Ghana | 36,700 | 39,200 |
| Nigeria | 49,425 | 50,390 |
| United States | 35,450 | 38,435 |
| United Kingdom | 33,390 | 37,490 |
| Canada (third generation or more) | 33,050 | 40,580 |
| Source: Statistics Canada, 2016 Census of Population. | ||
| Black women | Other women | Relative difference (percent) | |
|---|---|---|---|
| percent | |||
| Halifax | 27.0 | 10.7 | 152.3 |
| Montréal | 26.4 | 11.3 | 133.6 |
| Ottawa–Gatineau | 28.3 | 10.3 | 174.8 |
| Toronto | 33.2 | 9.7 | 242.3 |
| Winnipeg | 17.2 | 11.2 | 53.6 |
| Calgary | 17.7 | 8.2 | 115.9 |
| Edmonton | 20.6 | 9.6 | 114.6 |
| Vancouver | 19.4 | 9.7 | 100.0 |
| Rest of the country | 21.6 | 11.3 | 91.2 |
| Canada | 27.4 | 10.6 | 158.5 |
| Source: Statistics Canada, 2016 Census of Population. | |||
| Women | Men | |||
|---|---|---|---|---|
| College, CEGEP or university certificate or diploma | University degree | College, CEGEP or university certificate or diploma | University degree | |
| percent | ||||
| Halifax | -15.5 | -34.0 | -17.3 | -19.2 |
| Montréal | 2.1 | -26.9 | -2.0 | -3.4 |
| Ottawa–Gatineau | -1.5 | -19.8 | 1.1 | 5.4 |
| Toronto | -3.1 | -44.0 | -15.0 | -47.6 |
| Winnipeg | 3.4 | -7.8 | 5.7 | 24.3 |
| Calgary | -7.4 | -20.5 | -6.1 | -0.7 |
| Edmonton | -5.9 | -20.8 | -9.5 | 5.0 |
| Vancouver | -7.1 | -27.9 | -9.4 | -28.3 |
| Rest of the country | 6.3 | 21.9 | 4.2 | 71.0 |
| Canada | 3.1 | -15.8 | -1.6 | 3.8 |
| Source: Statistics Canada, 2016 Census of Population. | ||||
| Women | Men | |||||||
|---|---|---|---|---|---|---|---|---|
| Employment rate | Unemployment rate | Employment rate | Unemployment rate | |||||
| Black women | Other women | Black women | Other women | Black men | Other men | Black men | Other men | |
| percent | ||||||||
| Halifax | 67.5 | 78.1 | 11.2 | 4.9 | 71.7 | 83.9 | 14.1 | 5.7 |
| Montréal | 72.2 | 77.3 | 10.7 | 5.6 | 77.2 | 83.3 | 11.4 | 6.2 |
| Ottawa–Gatineau | 71.2 | 79.0 | 9.7 | 4.6 | 78.3 | 85.1 | 11.1 | 5.0 |
| Toronto | 71.7 | 73.9 | 9.9 | 6.4 | 78.3 | 84.7 | 8.9 | 5.3 |
| Winnipeg | 72.8 | 78.3 | 7.7 | 4.6 | 78.7 | 84.5 | 8.2 | 5.2 |
| Calgary | 68.5 | 75.2 | 13.5 | 7.7 | 79.4 | 84.5 | 13.1 | 8.3 |
| Edmonton | 67.3 | 75.7 | 12.1 | 6.3 | 78.1 | 84.1 | 13.5 | 7.9 |
| Vancouver | 72.3 | 74.5 | 8.1 | 5.2 | 80.7 | 84.9 | 6.7 | 4.5 |
| Rest of the country | 69.3 | 75.2 | 9.3 | 5.6 | 78.2 | 80.8 | 9.3 | 7.6 |
| Canada | 71.0 | 75.5 | 10.2 | 5.8 | 78.1 | 82.6 | 10.2 | 6.7 |
| Source: Statistics Canada, 2016 Census of Population. | ||||||||
| Women | Men | |||
|---|---|---|---|---|
| Employment rate | Unemployment rate | Employment rate | Unemployment rate | |
| percent | ||||
| Halifax | -7.4 | 74.4 | -9.6 | 108.7 |
| Montréal | 2.7 | 30.3 | -5.3 | 67.2 |
| Ottawa–Gatineau | -0.5 | 39.1 | -5.8 | 92.6 |
| Toronto | 1.5 | 25.2 | -2.8 | 35.6 |
| Winnipeg | -0.2 | 20.8 | -5.9 | 45.4 |
| Calgary | -0.3 | 26.1 | -4.3 | 40.0 |
| Edmonton | -1.6 | 31.6 | -4.9 | 52.3 |
| Vancouver | 0.6 | 30.9 | -2.9 | 34.1 |
| Rest of the country | -0.7 | 17.7 | -2.1 | 15.0 |
| Canada | 1.0 | 26.6 | -3.8 | 41.1 |
|
||||
| Black women | Other women | Black men | Other men | |
|---|---|---|---|---|
| dollars | ||||
| Halifax | 31,660 | 39,570 | 35,820 | 55,370 |
| Montréal | 30,690 | 39,155 | 34,250 | 50,280 |
| Ottawa–Gatineau | 36,880 | 51,785 | 40,720 | 63,380 |
| Toronto | 39,300 | 42,735 | 43,685 | 56,645 |
| Winnipeg | 33,650 | 39,790 | 39,580 | 52,355 |
| Calgary | 35,155 | 48,020 | 48,545 | 69,960 |
| Edmonton | 36,335 | 46,205 | 49,515 | 72,135 |
| Vancouver | 38,175 | 39,470 | 42,995 | 55,190 |
| Rest of the country | 33,660 | 37,185 | 42,840 | 54,435 |
| Canada | 35,665 | 39,655 | 41,145 | 55,805 |
| Source: Statistics Canada, 2016 Census of Population. | ||||
| Women | Men | |
|---|---|---|
| percent | ||
| Halifax | -5.3 | -16.0 |
| Montréal | 3.4 | -11.7 |
| Ottawa–Gatineau | -8.6 | -15.3 |
| Toronto | 2.3 | -5.8 |
| Winnipeg | 4.5 | -6.4 |
| Calgary | -5.9 | -14.7 |
| Edmonton | -1.6 | -12.0 |
| Vancouver | 6.4 | -9.1 |
| Rest of the country | 10.5 | -1.4 |
| Canada | 2.9 | -7.7 |
|
||
| Black children | Other children | Relative difference (percent) | |
|---|---|---|---|
| percent | |||
| Halifax | 38.5 | 15.9 | 142.2 |
| Montréal | 18.2 | 11.1 | 63.6 |
| Ottawa–Gatineau | 29.2 | 11.7 | 148.7 |
| Toronto | 34.1 | 18.4 | 85.4 |
| Winnipeg | 26.1 | 16.1 | 61.9 |
| Calgary | 27.4 | 11.7 | 133.6 |
| Edmonton | 28.2 | 11.3 | 150.3 |
| Vancouver | 31.9 | 18.0 | 77.6 |
| Rest of the country | 24.3 | 14.0 | 74.0 |
| Canada | 27.2 | 14.4 | 89.1 |
| Source: Statistics Canada, 2016 Census of Population. | |||
Appendix—Methods and variables
Place of ancestry. The place of ancestry of second-generation individuals is based on the parents’ place of birth. When both parents were born in the same foreign country, the place of birth of either the mother or the father was used. However, there are three other possible scenarios: when both parents were born in different foreign countries, when the mother was born in a foreign country and the father was born in Canada, and when the mother was born in Canada and the father was born in a foreign country. In the first two cases, the mother’s place of birth was used; in the third case, the father’s place of birth was used.
Employment rate. In this study, the employment rate was measured as the ratio of the number of people employed during the week before Census Day to the number of people likely to be employed, which is defined here as the total population aged 25 to 59.
Unemployment rate. The unemployment rate was calculated from the ratio of the number of unemployed people to the number of people in the labour force (all employed and unemployed people).
Annual wages. Annual wages refer to income from wages, salaries, tips and commissions. Immigrants admitted during the census year or the previous year were excluded from the analyses of wages because they may not have had a full year’s of applicable wages at the time of census taking.
Low-income status. In Section 6, two variables were used to measure the low-income status of children living in a census family. The low-income before-tax variable was used to produce a series from 2001 to 2016. This variable did not take into account the redistributive effect of taxes on the low-income calculation nor the cost of living.
The market basket measure (MBM) was developed by Employment and Social Development Canada and refers to the measure of low income based on the cost of a specific basket of goods and services that represents a modest, basic standard of living.
“The threshold represents the costs of specified qualities and quantities of food, clothing, footwear, transportation, shelter and other expenses for a reference family of two adults and two children. The square root of economic family size is the equivalence scale used to adjust the MBM thresholds for other economic family sizes.
The MBM basket (2011 base) is priced for 50 different geographic areas: 19 specific communities and 31 population centre size and province combinations. The MBM reflects the potential differences in the cost of the basket between similar-sized communities in different provinces and between different geographical regions within provinces.”Note 10
This measure is not available for pre-2016 censuses.
Immigrant, second-generation, and third-generation-or-more families for the study of children. Families are classified based on the mother’s generation status, independently of the father’s status. For single-parent families, the generation status of the lone parent determines the family’s status.
References
Adepoju, Aderanti. 2000. “Issues and Recent Trends in International Migration in Sub-Saharan Africa”, International Social Science Journal, vol. 52, no. 165, p. 383 to 394.
Adepoju, Aderanti. 2005. Migration in West Africa, A paper prepared for the Policy Analysis and Research Programme of the Global Commission on International Migration. Global Commission on International Migration (GCIM).
Aiken, Linda H., et al. 2004. “Trends in International Nurse Migration”, Health Affairs, Vol. 23, no. 3, p. 69 to 77.
Attewell, Paul, Philip Kasinitz, and Kathleen Dunn. 2010. “Black Canadians and black Americans: racial income inequality in comparative perspective”, Ethnic and Racial Studies, Vol. 33, no. 3, p. 473 to 495.
Bach, Stephen. 2003. International migration of health workers: Labour and social issues, Working Paper, International Labour Office, Geneva.
Blackwood, Evelyn. 2005. “Wedding Bell Blues: Marriage, Missing Men, and Matrifocal Follies”, American Anthropologist, Vol. 32, no. 1, p. 3 to 19.
Block, Sheila, Grace-Edward Galabuzi, and Ricardo Tranjan. 2019. Canada’s Colour Coded Income Inequality, Centre for Policy Alternatives.
Bongaarts, John, and John Casterline. 2012. “Fertility Transition: Is Sub-Saharan Africa Different?”, Population and Development Review, Vol. 38, Population and Public Policy: Essays in Honor of Paul Demeny, p. 153 to 168.
Calliste, Agnes. 1996. “Antiracism Organizing and Resistance in Nursing: African Canadian Women”, The Canadian Review of Sociology – La revue canadienne de sociologie, Vol. 33, no. 3, p. 361 to 390.
Clark, Shelly, and Dana Hamplová. 2013. “Single Motherhood and Child mortality in Sub-Saharan Africa: A Life Course Perspective”, Demography, Vol. 50, no. 5, p. 1521 to 1549.
Cornelissen, Louis. 2020. “Portrait of the Immigrants Working in Nursing”, Insights on Canadian Society, Statistics Canada Catalogue no. 75-006-X.
Delaunay, Valérie, et al. 2018. “La monoparentalité en Afrique : prévalence et déterminants – analyse comparative Bénin, Burkina Faso et Togo”, in Calvès, A., F. Binetou Dial and R. Marcoux (Eds), Nouvelles dynamiques familiales, Québec, Presses de l’Université du Québec, p. 67 to 92.
Flahaux, Marie-Laurence, and Hein De Haas. 2016. “African migration: trends, patterns, drivers”, Comparative Migration Studies, Vol. 4, no. 1, p. 1 to 25.
Green, Alan G., and David Green. 2004. “The goals of Canada’s immigration policy: a historical perspective”, Canadian Journal of Urban Research, Vol. 13, no. 1, p. 102 to 139.
James, C. E., and L. Taylor. 2008. “Education will get you to the station: Marginalized students’ experiences and perceptions of merit in accessing university”, Canadian Journal of Education, Vol. 31, no. 3, p. 567 to 590.
James, C. E. and T. Turner. 2017. “Towards race equity in education: The Schooling of Black Students in the Greater Toronto Area”, Toronto, York University.
James, Carl. 2019. “We Rise Together”, Report (March 11).
Kikulwe, Daniel. 2016. “Racialization, Silences and the Negotiation of Power Within Child Welfare Institutions in Ontario”, Canadian Ethnic Studies, Vol. 48, no. 3, p. 109 to 127.
Lavergne, Chantal, et al. “La réponse du système de protection de la jeunesse montréalais aux enfants issus des minorités visibles”, Intervention, no. 131, p. 233 to 241.
Lichter, Daniel T., and David J. Eggebeen. 1994. “The Effect of Parental Employment on Child Poverty”, Journal of Marriage and the Family, Vol. 56, no. 3, p. 633 to 645.
Livingstone, Anne-Marie, and Morton Weinfeld. 2015. “Black Families and Socio-economic Inequality in Canada”, Canadian Ethnic Studies/Études ethniques au Canada, Vol. 47, no. 3, p. 1 to 23.
Maheux, Hélène, and René Houle. 2016. “150 years of immigration in Canada”, Canadian Megatrends, Statistics Canada Catalogue no. 11-630-X. https://www150.statcan.gc.ca/n1/pub/11-630-x/11-630-x2016006-eng.htm
Martínez Pizarro, Jorge. 2005. International Migration in Latin America and the Caribbean: Facts and Findings, Working Paper, Caribbean Expert Group Meeting on Migration, Human Rights and Development in the Caribbean.
Massey, Douglas S., Mary J. Fischer, and Chiara Capoferro. 2006. "International Migration and Gender in Latin America: A Comparative Analysis", International Migration, Vol. 44, no. 5, p. 63 to 91.
Mata, Fernando. 2011. Lone-parent Status among Ethnic Groups in Canada: Data Explorations on its Prevalence, Composition and Generational Persistence Aspects, Metropolis British Columbia, Working Paper Series no. 11-17.
Maynard, Robyn. 2018. Policing Black Lives: State Violence in Canada from Slavery to the Present, Black Point (NS) and Winnipeg, Fernwood Publishing.
Moguerou, Laure, Madeleine Wayak-Pambe, and Madon Awissi. 2018. “Les femmes chefs de ménage célibataires de Dakar et de Ouagadougou – matérialité et vécu d’une situation atypique”, in Calvès, A., F. Binetou Dial and R. Marcoux (eds), Nouvelles dynamiques familiales en Afrique, Québec, Presses de l’Université du Québec, p. 93 to 118.
Nnorom, O., N. Findlay, N. K. Lee-Foon, A. A. Jain, C. P. Ziegler, F. E. Scott, and A. K. Lofters. 2019. “Dying to Learn: A Scoping Review of Breast and Cervical Cancer Studies Focusing on Black Canadian Women”, Journal of Health Care for the Poor and Underserved, Vol. 30, no. 4, p. 1331 to 1359.
Quinlan, Robert J. 2006. “Gender and Risk in a Matrifocal Caribbean Community: A View from a Behavioral Ecology”, American Anthropologist, Vol. 108, no. 3, p. 464 to 479.
Quinlan, Robert J., and Mark V. Flinn. 2003. “Intergenerational Transmission of Conjugal Stability in a Caribbean Community”, Journal of Comparative Family Studies, Vol. 34, no. 4, p. 569 to 583.
Statistics Canada. 2013. Low Income Lines, 2011-2012, “Income Research Paper Series – Revenue” no. 002, Statistics Canada Catalogue no. 75F0002M. https://www150.statcan.gc.ca/n1/pub/75f0002m/75f0002m2013002-eng.htm
Statistics Canada. 2017. Children living in low‑income households, Census in Brief, Statistics Canada Catalogue no. 98-200-X2016012. https://www12.statcan.gc.ca/census-recensement/2016/as-sa/98-200-x/2016012/98-200-x2016012-eng.cfm
Statistics Canada. 2018. Dictionary, Census of Population, 2016, Statistics Canada Catalogue no. 98-301-X2016001. https://www12.statcan.gc.ca/census-recensement/2016/ref/dict/index-eng.cfm
Statistics Canada. 2019. Diversity of the Black population in Canada: An overview, Statistics Canada Catalogue no. 89-657-X2019002. https://www150.statcan.gc.ca/n1/pub/89-657-x/89-657-x2019002-eng.htm
Statistics Canada. 2020. Canada’s Black population: Education, labour and resilience, Statistics Canada Catalogue no. 89-657-X2019002. https://www150.statcan.c.ca/n1/pub/89-657-x/89-657-x2020002-eng.htm
Thomas, Derrick. 2001. “Evolving family living arrangements of Canada’s immigrants”, Canadian Social Trends, Ottawa, Statistics Canada Catalogue no. 11-008, p. 16 to 22. https://www150.statcan.gc.ca/n1/en/type/analysis?pubyear=2001&text=Thomas
Thomas, Kevin J. 2011. “Familial Influences on Poverty Among Young Children in Black Immigrant, U.S.-Born Black, and Nonblack Immigrant Families”, Demography, Vol. 48, no. 2, p. 437 to 460.
Thomas-Hope, Elizabeth. 2001. “Tendencias y patrones de migración internacional de los países del Caribe”, Notas de población, year XXVIII, no. 73, p. 101 to 128.
Turcotte, Martin. 2019. “Educational and labour market outcomes of children with an immigrant background by their region of origin”, Ethnicity, Language and Immigration Thematic Series, Statistics Canada Catalogue no. 89-657. https://www150.statcan.gc.ca/n1/pub/89-657-x/89-657-x2019018-eng.htm
Turcotte, Martin. 2020. “Education and labour market integration of Black youth in Canada”, Insights on Canadian Society, Statistics Canada Catalogue no. 75-006-X.
UNHCR. 2019. Global Trends. Forced Displacement in 2018, United Nations High Commissioner for Refugees, Geneva. https://www.unhcr.org/5d08d7ee7.pdf
Vause, Sophie, and Sorana Toma. 2015. “Is the Feminization of International Migration Really on the Rise? The Case of Flows from the Democratic Republic of Congo and Senegal”, Population (English Edition), Vol. 70, no. 1, p. 41 to 67.
Waldron, I. 2018. There’s something in the water: Environmental racism in Indigenous & Black communities, Halifax, Fernwood Publishing.
Waldron, I.R.G. 2019. “Archetypes of Black womanhood: Implications for mental health, coping and help-seeking”, In M. Zangeneh (Ed), Advances in mental health and addiction, New York, Springer Publishing.
- Date modified: