
Accounting for ecosystem change in Canada
3.0 Ecosystem condition
Skip to text
Text begins
Human activities can have a far-reaching impact on ecosystem condition,Note which relates to the quality of ecosystems and influences their ability to provide ecosystem services. In ecosystem accounting, the assessment of ecosystem condition includes measuring the state and changes over time of many different abiotic, biotic and landscape and seascape characteristics.
3.1 Terrestrial and freshwater ecosystem condition
Canada’s diversity of ecosystems, ranging from northern wildernesses, to urban, industrial and agricultural landscapes across the south, can face vastly different pressures from human activity. For example, these pressures may be related to activities that affect land use, pollution emissions and climate change. Some of the key ecosystem condition characteristics for terrestrial and freshwater ecosystems presented in this section relate to abiotic characteristics such as water availability and air quality; biotic characteristics covering forest disturbance and urban greenness; and landscape characteristics on fragmentation and degree of modification. There are many other aspects of ecosystem condition; however, data for many other characteristics have not yet been compiled for Canada at a national scale or by ecosystem type.
Freshwater resources
Canada has abundant freshwater resources, with water held in lakes, wetlands, glaciers, snow and aquifers and runoff flowing into lakes, rivers and streams. These freshwater resources are integral to the functioning of terrestrial and aquatic ecosystems and provide essential benefits to humans.Note
Total water storage change is an estimate of the change in water stored in the environment as groundwater, soil moisture, surface water, snow and ice estimated using gravity-based measurements from satellites. These changes occur as a result of changing climate conditions, such as increasing temperatures causing glacier melt and changing precipitation patterns.
The largest decreasesNote in water storage from 2002 to 2016 were in ecoprovinces located in the Arctic Cordillera and Northern Arctic, as well as the Boreal Cordillera in the Yukon and northern British Columbia (Map 3.1), where large quantities of freshwater are frozen in permafrost, glaciers and ice caps.Note For example, in the Northern Arctic Cordillera, water storage has been decreasing at an average rate of 105 mm per year, followed by the Southern Arctic Cordillera (-103 mm/year) and the Ellesmere Basin (-96 mm/year) (Table 3.1).
The decline in water storage in these areas is consistent with observations on temperature increases, permafrost thaw and glacier retreat.Note The largest temperature increases in Canada are measured in the northwest, driving major changes in ecosystems in the region. For example, thinning alpine glaciers have an impact on water availability in the Prairies, since meltwater from glaciers is a contributor to summer streamflows. Meltwater from ice caps in the Canadian Arctic contributes to global sea level rise and influences salinity levels.Note
While decreases in water storage occurred in the north, increasesNote occurred in the Eastern Boreal Plains (+19 mm/year), Central Grassland (+12 mm/year) and Parkland Prairies (+11 mm/year) ecoprovinces and in the Appalachian–Acadian Highlands (+15 mm/year) on the East Coast. These increases generally align with increasing precipitation trends and in the Prairies also reflect the recovery of groundwater storage following depletion from the historic 2001 drought across western Canada.Note
Canada’s average annual water yield was 3,514 km3 from 1971 to 2014, equivalent to a depth of 350 mm across the extent of the country. This renewable freshwater production varies spatially across the country’s diverse landscape and also varies temporally—monthly, seasonally and yearly.
From 1971 to 2014, ecoprovinces within the Pacific Maritime ecozone in British Columbia had the highest average annual water yield per unit area (Map 3.2 and Table 3.1). Within the Pacific Maritime ecozone, the Southern Coastal Mountains ecoprovince had the highest water yield per area at 2,308 mm, followed by the neighbouring Georgia Depression (1,696 mm) and Northern Coastal Mountains (1,652 mm). Other ecoprovinces with high water yields per area were Newfoundland (1,147 mm) and the Fundy Uplands (986 mm).
The lowest water yields were found in the Prairies and the Boreal Plains ecozones, which cover most of Alberta, Saskatchewan and Manitoba. At the ecoprovince level, the lowest yields were found in the Central Grassland (20 mm), the Parkland Prairies (42 mm), the Eastern Prairies (68 mm) and the Central Boreal Plains (83 mm).
Ambient air quality
Ambient air quality varies by region, city, and neighbourhood since it reflects the quantity and location of air pollutant emissions and meteorological conditions such as wind speed, wind direction, temperature and precipitation.Note Air emissions can result from human sources including motor vehicles, power generating plants, oil and gas production, industrial facilities and fertilizer use. In addition to having impacts on human health, emissions can also affect ecosystems, for example through acid deposition on forests.Note Natural sources of air pollutants include forest fires, dust, lightning and even trees,Note which can release pollen and volatile organic compounds (VOCs).
Canadian Ambient Air Quality Standards (CAAQS)Note exist for fine particulate matter (PM2.5), ground level ozone (O3), sulphur dioxide (SO2) and nitrogen dioxide (NO2) and are a driver for air quality management across the country. In 2016, average ambient concentrations of PM2.5 were 6.4 µg/m3, 32.5 ppb for ground-level ozone, 7.8 ppb for nitrogen dioxide, 1.0 ppb for sulphur dioxide and 58.4 ppb carbon for volatile organic compounds. Between 2002 and 2016, average annual and peak ambient air concentrations of SO2 and NO2, as well as average concentrations of VOCs decreased (Chart 3.1 and 3.2).Note While peak O3 concentrations decreased, the average annual concentrations remained stable. No long-term trends were found for PM2.5, whose concentrations remained relatively stable.
Average ambient levels of pollutants varied by region and urban area (Table 3.2). Higher concentrations of PM2.5 were detected in the urban areas of Windsor, Québec City and Regina in 2016. For ozone, the regional average ambient levels ranged from 26.6 ppb of O3 in British Columbia to 37.5 ppb of O3 in southern Ontario in 2016, with urban areas in Ontario having among the highest concentrations. Ambient air concentrations for SO2 and NO2 were lowest in Atlantic Canada (0.6 ppb of SO2 and 3.1 ppb of NO2) and highest in southern Quebec for SO2 (1.7 ppb) and British Columbia for NO2 (9.2 ppb).
Forest condition
There are many different variables that can be used to track the condition of forest ecosystems. For example, forest biodiversity and composition (e.g., genus, species), structure (e.g., age class, biomass), timber stocks, natural disturbances and harvesting are important measures of the biotic condition of forests.Note Natural disturbances, including wildfire, insect and disease outbreaks, landslides and windthrow, are important ecosystem processes that affect and shape forests. These disturbances can occur on a local to extensive geographical scale and effects may be limited to small reductions in tree health or growth, but can also result in significant mortality.
The areas affected by natural disturbances fluctuate widely from year to year and by region. For example, outbreaks of insects, such as spruce budworm, forest tent caterpillar and mountain pine beetle, can be short lived or may last for many years. These pests can reduce tree growth, damage trees and lead to increased mortality. In 2018, approximately 5% of forest area experienced moderate or severe insect infestations causing defoliation and tree mortality.Note
The 2017 and 2018 fire seasons were particularly severe in British Columbia, while 2019 was a more severe year in Alberta.Note From 1986 to 2019, the total area affected by forest fires in Canada ranged from a low of 6,264 km2 in 2001 to a high of 70,951 km2 in 1995.Note On average, the area burned each year represents less than 1% of forest area, with the largest proportion of forest fires in unmanaged forest areas that have limited or no access and no active fire suppression. Over the period from 1986 to 2019, forest fires have burned large areas across the boreal zone, particularly in the Western Boreal Shield and Western Taiga Shield ecoprovinces (Map 3.3 and Table 3.3).
Similarly, forest harvesting affects a small proportion of the country’s forests, but these activities are more localized in temperate forests and in the southern parts of the boreal zone.Note On average, the area harvested each year represents less than 0.3% of the total forest area. In 2018, the area harvested totalled 7,472 km2, up from the low of 6,132 km2 set in 2009 following the 2008 financial crisis and U.S. housing market crash.Note
Urban greenness
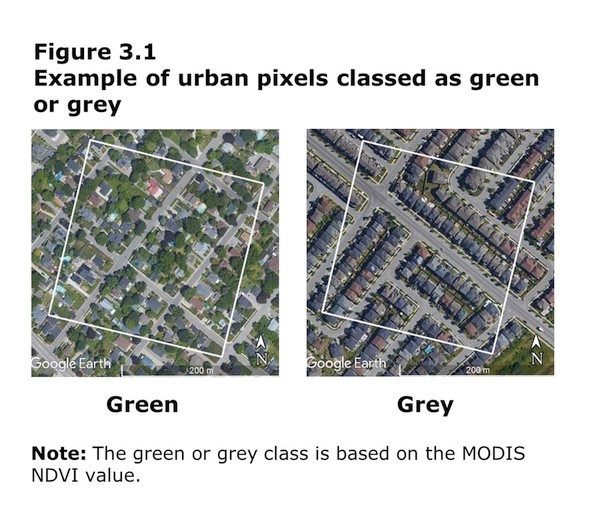
The presence and health of trees and other vegetation are also important characteristics of ecosystem condition in urban areas. Satellite imagery can be used to track the relative greenness of cities and towns over time.Note The level of urban greenness depends on natural environmental conditions, for example climate, as well as differences in local land use.Note Urbanization processes can result in significant reductions in the quantity of ‘green’ areas that have more vegetation and related increases in ‘grey’ areas that are predominantly covered by buildings, impervious surfaces, bare soil and low-density vegetation (Figure 3.1). Increases in greenness seen over longer periods in urban areas can be linked to the introduction or maturation of vegetation in yards and gardens. Interannual variations in urban vegetation quantity and condition can also be related to natural factors such as drought, insects or disease.
Figure 3.1
Example of urban pixels classed as green or grey
Description for Figure 3.1
The purpose of this image is to visually display the difference between a green MODIS pixel and a grey MODIS pixel. The green or grey class is based on the MODIS NDVI value.
The MODIS pixels are represented by a box with a white outline and are overlaid on high resolution aerial imagery provided by Google to visualize what is present on the ground. The image compares two MODIS pixels. The first pixel (left) is classified as green and the second (right) is classified as grey.
The pixel on the left represents a residential area with large lots, trees, grass, houses and roads and is classed as green because its MODIS NDVI value is greater than or equal to 0.5. The pixel on the right represents a residential area with smaller lots, less trees and grass, and more houses and roads compared to the pixel on the right, and is classed as grey because its MODIS NDVI value is less than 0.5.
In 2019, 76% of the area of population centres in southern Canada was classed as green in summer (Table 3.4). This percentage varied based on city size and regional differences. In large urban population centres, an average of 70% of the total land area was classed as green, compared to 78% in medium population centres and 87% in small population centres. In general, the proportion of green area in population centres in 2019 was lower than in 2001. Approximately three-quarters of large urban (77%) and medium (71%) population centres experienced this drop in greenness levels, despite widespread drought conditions across the Canadian south-west and an abnormally dry summer in Ontario and Quebec in 2001. Note In comparison, 35% of small population centres experienced a drop in greenness, while 33% saw no change in greenness levels.
Winnipeg, Milton, Kelowna, Windsor and Vancouver experienced the largest decreases in the share that was classed as green from 2001 to 2019 (Chart 3.3). These larger decreases in greenness may have been driven by the contributions of urbanization and moderate drought conditions in 2019. For example, Milton experienced population growth of 350% from 2001 to 2016.Note However, decreases in Winnipeg and Windsor may also have been amplified by the impact of the emerald ash borer—an exotic invasive insect that has had a large impact on trees in some regions.Note
Landscape condition characteristics
Human activities have an impact on ecosystem characteristics, functions and the supply of ecosystem goods and services. For example, changing land cover and land use can affect water regulation, habitat provision and pollination services. The degree of modification lies on a continuum. For example, agro-ecosystems have been modified from natural ecosystems through tillage, drainage, introduction of different species and use of chemical inputs, but still maintain important ecosystem functions such as nutrient cycling and pollination.Note Heavily built areas with a large proportion of artificial surfaces and lower proportion of natural and semi-natural areas are considered the most modified ecosystems.
In 2016, 9% of Canada’s landmass had been directly modified for agricultural production, recent forest harvesting (since 1986) or urban and industrial development (Chart 3.4). The majority of this area was used for agriculture (64%), followed by forest harvesting (29%) and built-up area (7%). Other areas including old growth and regenerating forests, tundra, grassland and other ecosystems are considered indirectly modified. These areas may have been modified from their original condition through historic logging or dam construction, may be actively managed for timber production or may be affected by acid deposition and climate change, but retain many characteristics of natural and semi-natural ecosystems.
Habitat and landscape fragmentation refers to the division of natural and semi-natural ecosystems into smaller and more isolated patches. Farm fields, forest cut blocks and built-up and artificial surfaces have transformed the natural landscape. Linear features such as roads, rail lines, transmission lines and cutlines divide landscapes into smaller patches and are often the first encroachments of human activity into an area.Note Larger cities and densely populated areas generally have higher linear feature densities as a result of demand for road, water, waste and communication infrastructure. Increased fragmentation can affect an ecosystem’s ability to function, for example, by reducing its capacity to support species abundance and richness or ability to provide ecosystem services such as flood attenuation, pollination, or erosion prevention.
In 2016, the smallest natural and semi-natural patch sizes and longest distance to natural and semi-natural patch were found in ecoprovinces across the Prairies and the Mixedwood Plains ecozones where the majority of the country’s agricultural activity takes place (Table 3.5). The Central Grassland and Parkland Prairies ecoprovinces had the smallest average natural and semi-natural patches at 1.0 km2 and 1.1 km2, followed by the Huron–Erie Plains (1.1 km2) and the Great Lakes–St. Lawrence Lowlands (1.3 km2). The longest average distance to a natural and semi-natural patch was in the Central Grassland (515 m), followed by the Eastern Prairies (508 m) and the Huron–Erie Plains (331 m).
Linear feature density was highest in the Huron–Erie Plains ecoprovince (2,769 m/km2), the Great Lakes–St. Lawrence Lowlands (1,815 m/km2) and the Georgia Depression (1,692 m/km2), which include Canada’s largest population centres including Montréal, Toronto and Vancouver.
The human landscape modification index (HLMI) integrates data on land use, natural and semi-natural patch size and linear features to provide a measure of the degree to which an area has been modified from its natural state (Maps 3.4 and 3.5). Higher HLMI scores indicate a higher degree of modification from the natural ecosystem state and occur where grassland, wetland and forest ecosystems have been converted to agroecosystems and urban centres and where there is more landscape fragmentation. Conversely, lower HLMI scores indicate lower rates of modification and where ecosystem functions are more likely to be closer to their natural state. The highest HLMI score was found in the Huron–Erie Plains in southern Ontario. The lowest HLMI scores are found in the North since much of the landscape remains intact with few direct modifications.Note
Human activities also affect freshwater ecosystems. The construction of dams or bridges and water withdrawal for agricultural and industrial use or drinking water production result in direct impacts on the flow of rivers and streams. Nutrient emissions from wastewater treatment plants or farm runoff have direct impacts on water quality. Carbon emissions from human activity indirectly affect freshwater ecosystems as a result of long-term changes in the water cycle and water temperatures. The human freshwater influences index is an overall ranking of drainage regions based on individual rankings of selected anthropogenic variables that affect freshwater ecosystems (Map 3.6).Note By combining multiple influencing factors, this index helps convey the cumulative effects of human activities on freshwater ecosystems. The higher rankings for drainage regions in the south reflect the large number of influences associated with higher population densities and landscape conversion, while warming temperatures are the major influence on freshwater ecosystems in the North.
Start of text box 1
Textbox: Invasive species
Non-native species are plants, pathogens, insects, fish or other animals that have been introduced to Canada from other parts of the world. Some introduced species do not survive to reproduce and proliferate because environmental conditions may be unfavourable or native species may outcompete them. However other non-native species become invasive, establishing and spreading rapidly because of a lack of predators, changing environmental conditions and other reasons, which may cause considerable harm to existing ecosystems. These invasives can be found across the country on land and in fresh and marine waters.
In addition, some native species to Canada and the United States are expanding their ranges into new areas where they may become invasive. For example, the mountain pine beetle is native in certain parts of British Columbia,Note but is causing devastation as it moves north in the province and eastward into Alberta. Not only does this cause mortality amongst pine species but may increase the risk of severe forest fires.Note As sea ice melts in the Arctic Ocean, killer whales are becoming more common, potentially impacting populations of other whales such as narwhal.Note
Over 80 destructive forest pests and pathogens have been introduced into Canada, including Dutch elm disease and more recent arrivals such as the Asian longhorned beetle and the emerald ash borer.Note The emerald ash borer arrived in Canada in 2002 and has since killed millions of trees in five of Canada’s provinces.Note Purple loosestrife was introduced in the 1800s from Europe, but continues to be a problem in wetlands where it chokes out native plants.Note Japanese knotweed establishes itself in dense patches with extensive root bases and aggressively chokes out native species and damages infrastructure.Note Even moose, the well-known Canadian symbol, have become a problem since their 1878 introduction to Newfoundland,Note with current numbers as high as one for every four people and moose density estimated at 3 to 20 times that of other boreal forest systems.Note Moose affect the abundance and distribution of native vegetation throughout the province and are a traffic hazard along the province’s highways.
Invasive species have spread into Canadian waters through the release of ballast water and hull fouling from global shipping, aquaculture importation of non-native species, as well as habitat, climate and oceanographic changes that have enabled invasive species to take hold. Zebra and quagga mussels, native to the Black Sea, are thought to have arrived in the Great Lakes in the late 1980s from ballast water in transoceanic vessels.Note These aggressive species quickly colonized all available hard surfaces,Note fouling boats and clogging water intakes on power stations and water treatment plants. The spread of Asian carp is another serious concern for the Great Lakes because of their voracious appetites, fast growth rates and ability to reproduce quickly, which may enable them to outcompete local species.Note They were introduced in aquaculture facilities in the United States in the 1960s and 70s to use as a biological control, but escaped fish have moved north through the Mississippi River basin. Individual Asian carp have recently been found in the Great Lakes and in Canadian waterways.Note Ongoing surveillance efforts are in place to prevent the establishment of these fish in Canadian waters.
Marine invasive species of concern include the European green crab and tunicates, which have been found on both the east and west coasts. Note European green crabs outcompete native crabs, cause severe damage to mollusc beds and disrupt eelgrass beds, a productive habitat for many juvenile fish species. Tunicates or sea squirts are very hardy, tolerate a wide range of temperature and salinity conditions, have very few predators because of their noxious outer skin and can reproduce in vast numbers. They attach to firm surfaces such as fishing and aquaculture gear and also shellfish. Both species have had a substantial impact on the aquaculture industry, particularly on the East Coast.
End of text box 1
3.2 Marine and coastal ecosystem condition
The health of Canada’s oceans can be measured through a number of different abiotic, biotic and seascape characteristics. The complex interactions between these different characteristics can result in large-scale impacts on ocean currents, weather patternsNote and productivityNote to more local impacts affecting the level of biodiversity in marine regions.Note This, in turn, can have serious impacts on ocean services and benefits, such as fishery landings and tourism as well as marine transportation routes and the accessibility of oil fields. Key abiotic characteristics include sea temperature, salinity, oxygen, stratification, acidity, nutrient and pollution levels; biotic characteristics may relate to the abundance of species and food webs; and seascape characteristics can include sea ice cover and the intactness or modification of ecosystems.
Sea surface temperature
Ocean temperatures are increasing with increasing atmospheric temperatures. Heat from the sun and atmosphere is absorbed at the ocean surface and spreads gradually into deeper waters and around the world by way of ocean currents and mixing of layers. Ocean warming can change the range distribution of speciesNote and can impact fish spawning areas and the survival of fish eggs.Note Ocean temperature can also have a significant impact on coastal communities, not only through its impact on local fisheries and tourism, but also because of its effect on sea level through thermal expansionNote and because warmer waters create more intense storms.Note
Between 1901 and 2014, all Canadian marine ecoregions saw a rise in mean sea surface temperatures, with the highest temperature changes of 2°C or more occurring in the Arctic.Note When the average annual temperatureNote from 2005 to 2017 is compared with the 1981 to 2010 climate normal average, most areas of the Canadian exclusive economic zone (EEZ) have warmed, though cooling is seen in parts of the Pacific and Hudson Bay (Map 3.7 and Table 3.6).
In summer, the Pacific waters had very different regions of warming than in winter, with a cold offshore region stretching from the Skeena River delta between two regions of warming, while in winter this region was warmer than the three-decade average (Maps 3.8 to 3.10). Temperature change in the Arctic was driven more by summer changes than by winter changes, while the Atlantic more consistently showed warming in both seasons, with the exception of the Gulf of St. Lawrence, which was colder in winter. The largest temperature differences were seen on the southern Scotian Shelf where they were larger than 3°C in some locations.
Sea surface salinity
Salinity is another important abiotic component of marine ecosystems. Salinity, along with temperature and pressure, affects the mixing of different ocean layers. Freshwater flow from rivers and melting land and sea ice reduce salinity and increase stratification—the formation of distinct layers.Note Significantly increased stratification can limit nutrient availability to surface phytoplankton at the base of the marine food web, affecting productivity and influencing the ocean’s ability to capture carbon. A long-term decreasing trend in salinity has been found for most Canadian surface waters while deeper waters (200 m to 330 m) in the Gulf of St. Lawrence have experienced a statistically significant increase in salinity.Note Comparing the average annual surface salinity from 2005 to 2017 to the climate normal average salinity shows that many regions have recently experienced reduced salinity levels (Map 3.11 and Table 3.7). The Strait of Georgia, Arctic Basin and Gulf of St. Lawrence have experienced the largest departures from the climate normal, with summer months experiencing the largest departure for the Strait of Georgia and autumn and winter months having the largest departures for the Gulf of St. Lawrence. Increases in salinity in Atlantic offshelf waters are consistent with northward shifts of subtropical waters.Note
Other abiotic condition characteristics
The level of dissolved oxygen in water is another important abiotic indicator of ocean water condition. Low oxygen levels are detrimental to marine life as they are associated with reduced growth rates, lower reproductive success and higher mortality.Note Surface waters are normally oxygen rich, though intense algal blooms resulting from excess nutrients in the water can deplete oxygen levels and create dead zones where no marine life can survive.Note Hypoxic—or low oxygen level—waters are a more normal occurrence in deeper water. There are several hypoxic areas in Canadian waters—some such as northern Pacific fjord inlets have had low levels for centuries. Others, such as deeper waters in the Gulf of St. Lawrence have shown a clear decline in oxygen levels over the past century. There are serious concerns that further oxygen depletion in some of these regions, particularly Queen Charlotte Sound, Hecate Strait and Dixon Entrance, could have serious impacts on biodiversity and on fisheries in the regions.Note
Ocean acidification—the reduction of ocean pH levels—is well known for its damaging effects on tropical coral reefs; however, it is also an issue in Canadian waters. Increased acidity impacts cold water corals, shellfish and certain types of calcifying plankton by reducing their ability to build and maintain shells and calcium carbonate skeletal structures.Note Arctic waters are expected to undergo rapid acidification in future years because of increasing carbon dioxide uptake from the atmosphere.Note
Plastic pollution is also a concern for oceans globally, famously the marine debris circulating in the North Pacific Ocean, known as the Great Pacific Garbage Patch.Note Coastlines and beaches worldwide are littered with washed up plastic from the sea, while lost or discarded fisheries nets, trawls, pots, traps and other derelict fishing gear continue to ghost fish at the ocean bottom. Beach litter surveys in Canada have found a high proportion of litter to be plastic, with one study on Fogo Beach in Newfoundland finding 67% of plastic litter was smaller than 1 cm3.Note Microplastic particles (i.e., those less than 5 mm long)Note are also a pollution concern. These particles—a large proportion of which are polyester fibres from laundering clothing and other textiles—may be mistaken for food by animals low on the food chain and therefore concentrate in predator species. Studies of stomach contents of the Northern Fulmar, a type of seabird that feeds at the ocean surface, show that since 2000, between 28% and 63% of birds studied had at least 0.1 gram of plastic in their stomachs.Note
Fish and marine mammal stocks
Biotic indicators such as species abundance, diversity and average size are also of high importance for measuring ocean condition. Phytoplankton, microscopic aquatic plants, are at the foundation of the marine food web. Phytoplankton are consumed by zooplankton—animal plankton—that are essential food for many fish and marine mammals.Note The main phytoplankton blooms occur in spring and fall.Note The abundance, composition, timing and duration of these blooms can have significant effects on marine food webs. Satellite measurements of chlorophyll in surface waters are often used to estimate phytoplankton production, but they will miss production at deeper levels. In the Atlantic Ocean the magnitude of the spring bloom increased from 1999 to 2011 while the duration decreased with both returning to an average state in 2016.Note On the Pacific Coast, a recent study suggests there is no long-term trend in chlorophyll levels in the Strait of Georgia over the last 100 years, although other research has found significant increases in chlorophyll levels between 1997 and 2010.Note
In 2019, only 52 of 176 fish and marine mammal stocks managed by Fisheries and Oceans Canada and deemed economically, culturally, or environmentally important were considered to be healthy (Table 3.8), while the status of 29 stocks was assessed as cautious and 25 critical.Note Data were insufficient to assess the status of 70 stocks, with over a third of these uncertain stocks potentially facing conservation risks. The Arctic Ocean has the highest proportion (76%) of marine stocks with an uncertain status, while the Atlantic Ocean has the highest proportion (51%) of stocks with a status assessed as cautious, critical, or uncertain with risk of serious harm possible or likely (Table 3.9). Of the 25 stocks in the critical zone, 13 are groundfish stocks including 6 cod stocks. In December 2020, Canada committed to sustainably manage 100% of the oceans under its jurisdiction by 2025, as one of 14 members of the High Level panel for Sustainable Ocean Economy.Note
Species listed under the Species at Risk Act (SARA) can be found in all areas of the Canadian Atlantic and Pacific.Note In all, 225 aquatic species (both marine and freshwater) are listed as having at least one population at risk due to their status under SARA or the Committee on the Status of Endangered Wildlife in Canada (COSEWIC).Note
Sea ice extent
Sea ice is a defining characteristic of marine and coastal ecosystems in the Arctic and also occurs in northern areas of the Atlantic in winter. The extent of sea ice varies by season and between years; however, a widespread, long-term decline in sea ice has been observed, driven by a warming arctic climate.Note In particular, over the last 50 years, a decline in summer sea ice extent and an increase in seasonal ice free periods has occurred. As ice melts, the Arctic reflects less sunlightNote allowing more solar energy to enter the ocean. Sea ice change can directly and indirectly affect all components of the marine ecosystem and surrounding environments. For example, sea ice loss and wave action can trigger erosion of coastlines and ice shelves. In 2020, large parts of the Milne ice shelf on Ellesmere Island broke off.Note As multi-year ice disappears it is also easier for vessels to travel through the Arctic, resulting in increased human activity and shipping traffic.
Decreases in sea ice can have rippling effects throughout the entire food chain, for example, starting with changes affecting sea ice algae, which provide critical early energy for arctic marine food webs.Note Changes in sea ice may also trigger changes in the territory and hunting methods of species such as polar bears.Note As waters warm, southern species may migrate northwards potentially changing population interactions and impacting species with nowhere left to migrate. Killer whales are already increasingly being found in arctic waters, resulting in impacts on narwhal and bowhead whale behaviour and distribution.Note Inuit are experiencing impacts on harvesting activities as access to hunting areas becomes more difficult and the abundance and distribution of species change.Note
Arctic sea ice reaches minimum levels in September and maximum levels in late February to early March. The record for minimum circumpolar arctic ice extent was set in the summer of 2012, followed by 2020 and 2019 with the second and third lowest summer sea ice area.Note Canadian waters also experienced the smallest extent of sea ice in 2012, but 2011 and 1998 followed with the second and third smallest ice areas. Across the Canadian Arctic, all five marine ecoregions show significant drops in ice extent for September ice over the last four decades (Chart 3.5 and Table 3.10).
Multi-year ice is important in the Arctic,Note as it reflects more light than first year ice and is also thicker, stabilizing the ice pack, providing more protection against coastal erosion and limiting the use of icebreakers. The rapid loss of multi-year ice in the central Arctic Ocean allows ice to move more freely, facilitating the loss of sea ice across other areas of the Arctic.Note Northern Canadian waters have experienced summer season declines in multi-year sea ice area of 7.4% per decade from 1968 to 2018 and decadal decreases of 7.0% in total sea ice area; however, multi-year ice in the western Canadian Arctic Archipelago has remained stable.Note
The maximum ice extent occurring in the three Atlantic marine ecoregions has also decreased (Chart 3.6 and Table 3.11). Sea ice begins forming starting in December on the coast of southern Labrador and by January in the northern Gulf of St. Lawrence. By the end of January, the western and northern parts of the Gulf of St. Lawrence are ice-covered. From January to March, pack ice spreads southwards from Labrador along the eastern coast of Newfoundland with distribution dependent on the severity of winter conditions and wind direction. Sea ice break up begins in mid–March, with ice retreating to the northern end of the Strait of Belle Isle by May, allowing icebergs to drift towards the Grand Banks on the East Coast, transported by the Labrador Current.Note
Human modifications
Although the ocean seafloor is a relatively unexplored region of Earth,Note humans have had great impact in some areas, especially in shallower waters. Fisheries, especially with the use of bottom trawlers and ghost nets, can have a huge impact on the seafloor.Note Bottom trawlers destroy coral beds and vegetative cover, while ghost nets and lost trawls can trap animals.Note Aquaculture sites, which are located on approximately 400 km2 of Canadian coastal area (Map 3.12 and Table 3.12), can potentially have a large impact on coastal areas and biodiversity.Note Studies in Canada,Note NorwayNote and ScotlandNote have investigated the spread of sea lice from fish farms to wild salmon. There is also concern that escaped Atlantic salmon populations could establish breeding populations, with some evidence of spawning in three streams in British Columbia.Note Shellfish aquaculture creates additional habitat in the water column, which can have a positive impact on pelagic biomass and productivity. However, it can also be linked to reductions in local phytoplankton biomass and the establishment of non-native species.Note
Areas licensed for offshore oil and gas production include 1,018 km2, located in the Newfoundland and Labrador Shelves and Scotian Shelf. Discovery area licenses that indicate where production could be permitted in the future cover a total of 7,534 km2 and licenses for exploration cover 51,491 km2. Canada has had a moratorium on oil and gas activities on the West Coast since 1972 and on new activities in the Arctic Ocean since 2016. As of 2019, all oil and gas activity is prohibited in Canadian Arctic offshore waters.Note Oil and gas exploration disrupts the ocean floor and creates pollution risks from oil leaks and spills, though old rigs can also provide shelter and habitat to species such as coral,Note cod, flatfish and even porpoises.Note
Harbours, manmade islands and infrastructure such as the Confederation Bridge joining Prince Edward Island and New Brunswick, disrupt the ocean floor and bring new sources of anthropogenic noise. The rise in ambient noise levels can have impacts on many species, such as whales, and may even impact fish egg and larvae development.Note Marine shipping routes have large impacts on migratory species and recently slow-downs of traffic have been required to reduce noise impacting southern resident killer whales and reduce the chance of ship strikes to protect species such as the North Atlantic right whale.Note
Start of text box 1
Textbox: Biodiversity conservation
Protected areas play an important role in conserving nature and biodiversity. The first target of the 2020 Biodiversity Goals and Targets for Canada—related to the global Aichi Biodiversity Target 11—was to conserve 17% of terrestrial areas and inland water and 10% of coastal and marine areas by 2020 through protected areas and other effective area-based conservation measures.Note The objectives of protected areas are to prevent the degradation of natural areas from increasing pressures and threats and to conserve biodiversity, natural conditions and related values and services. While the primary objective of areas conserved under other effective area-based conservation measures may be different, these measures also result in the protection of biodiversity.Note
In Canada, federally protectedNote or conserved areas include National Parks, National Marine Conservation Areas, National Wildlife Areas, Migratory Bird Sanctuaries and Marine Protected Areas (MPA). Provincial and territorial designations for protected or conserved areas include, among others, Provincial Park, Territorial Park, Marine Park, Wilderness Park Wildlife Refuge, Nature Reserve, Biodiversity Reserve, Wilderness Area and Habitat Protected Area. Other areas are protected or conserved by Indigenous peoples, by collaborative governance and by non-profit organizations such as the Nature Conservancy of Canada, Ducks Unlimited or land trust organizations.
In December 2020, 12.5% of Canada’s terrestrial and inland water area was conserved, mostly in parks or migratory bird sanctuaries (Map 3.13 and Table 3.13). These areas fall under different categories of protection and management and some face threats including climate change, fragmentation, invasive species and incompatible land uses or activities in areas adjacent to conserved areas, among others.Note The Wrangel Mountains, almost entirely protected and conserved, is the ecoprovince with the greatest percentage of protected areas. In most ecoprovinces, however, the percentage of conserved terrestrial area is below the target.
In August 2019, Canada surpassed its target for the conservation of marine and coastal areas, with 13.8 % of the EEZ conserved, after the addition of Tuvaijuittuq Marine Protected Area in the Arctic Basin (Table 3.14).Note Canada has recently committed to conserving 25% of its EEZ by 2025, working toward 30% by 2030.Note Marine protected and conserved areas vary in their regulations and in the types of activities that are allowed. While a range of activities and management levels are permitted, new standards introduced in 2019 will prohibit oil and gas activities, mining, dumping and bottom trawling in federal marine protected areas. Note The Laurentian Channel MPA, designated in 2019, was the first to follow these new protection standards.Note These types of economic activities may occur in areas protected through other conservation measures, such as marine refuges; however, areas where oil and gas extraction occurs do not contribute towards the marine conservation target.
End of text box 1
- Date modified: