
Environmental Thematic Maps and Graphics:
Summer sea surface temperature departures (2005 to 2017) from the climate normal at quarter degree grid

Archived Content
Information identified as archived is provided for reference, research or recordkeeping purposes. It is not subject to the Government of Canada Web Standards and has not been altered or updated since it was archived. Please "contact us" to request a format other than those available.
Text begins
Description for Map
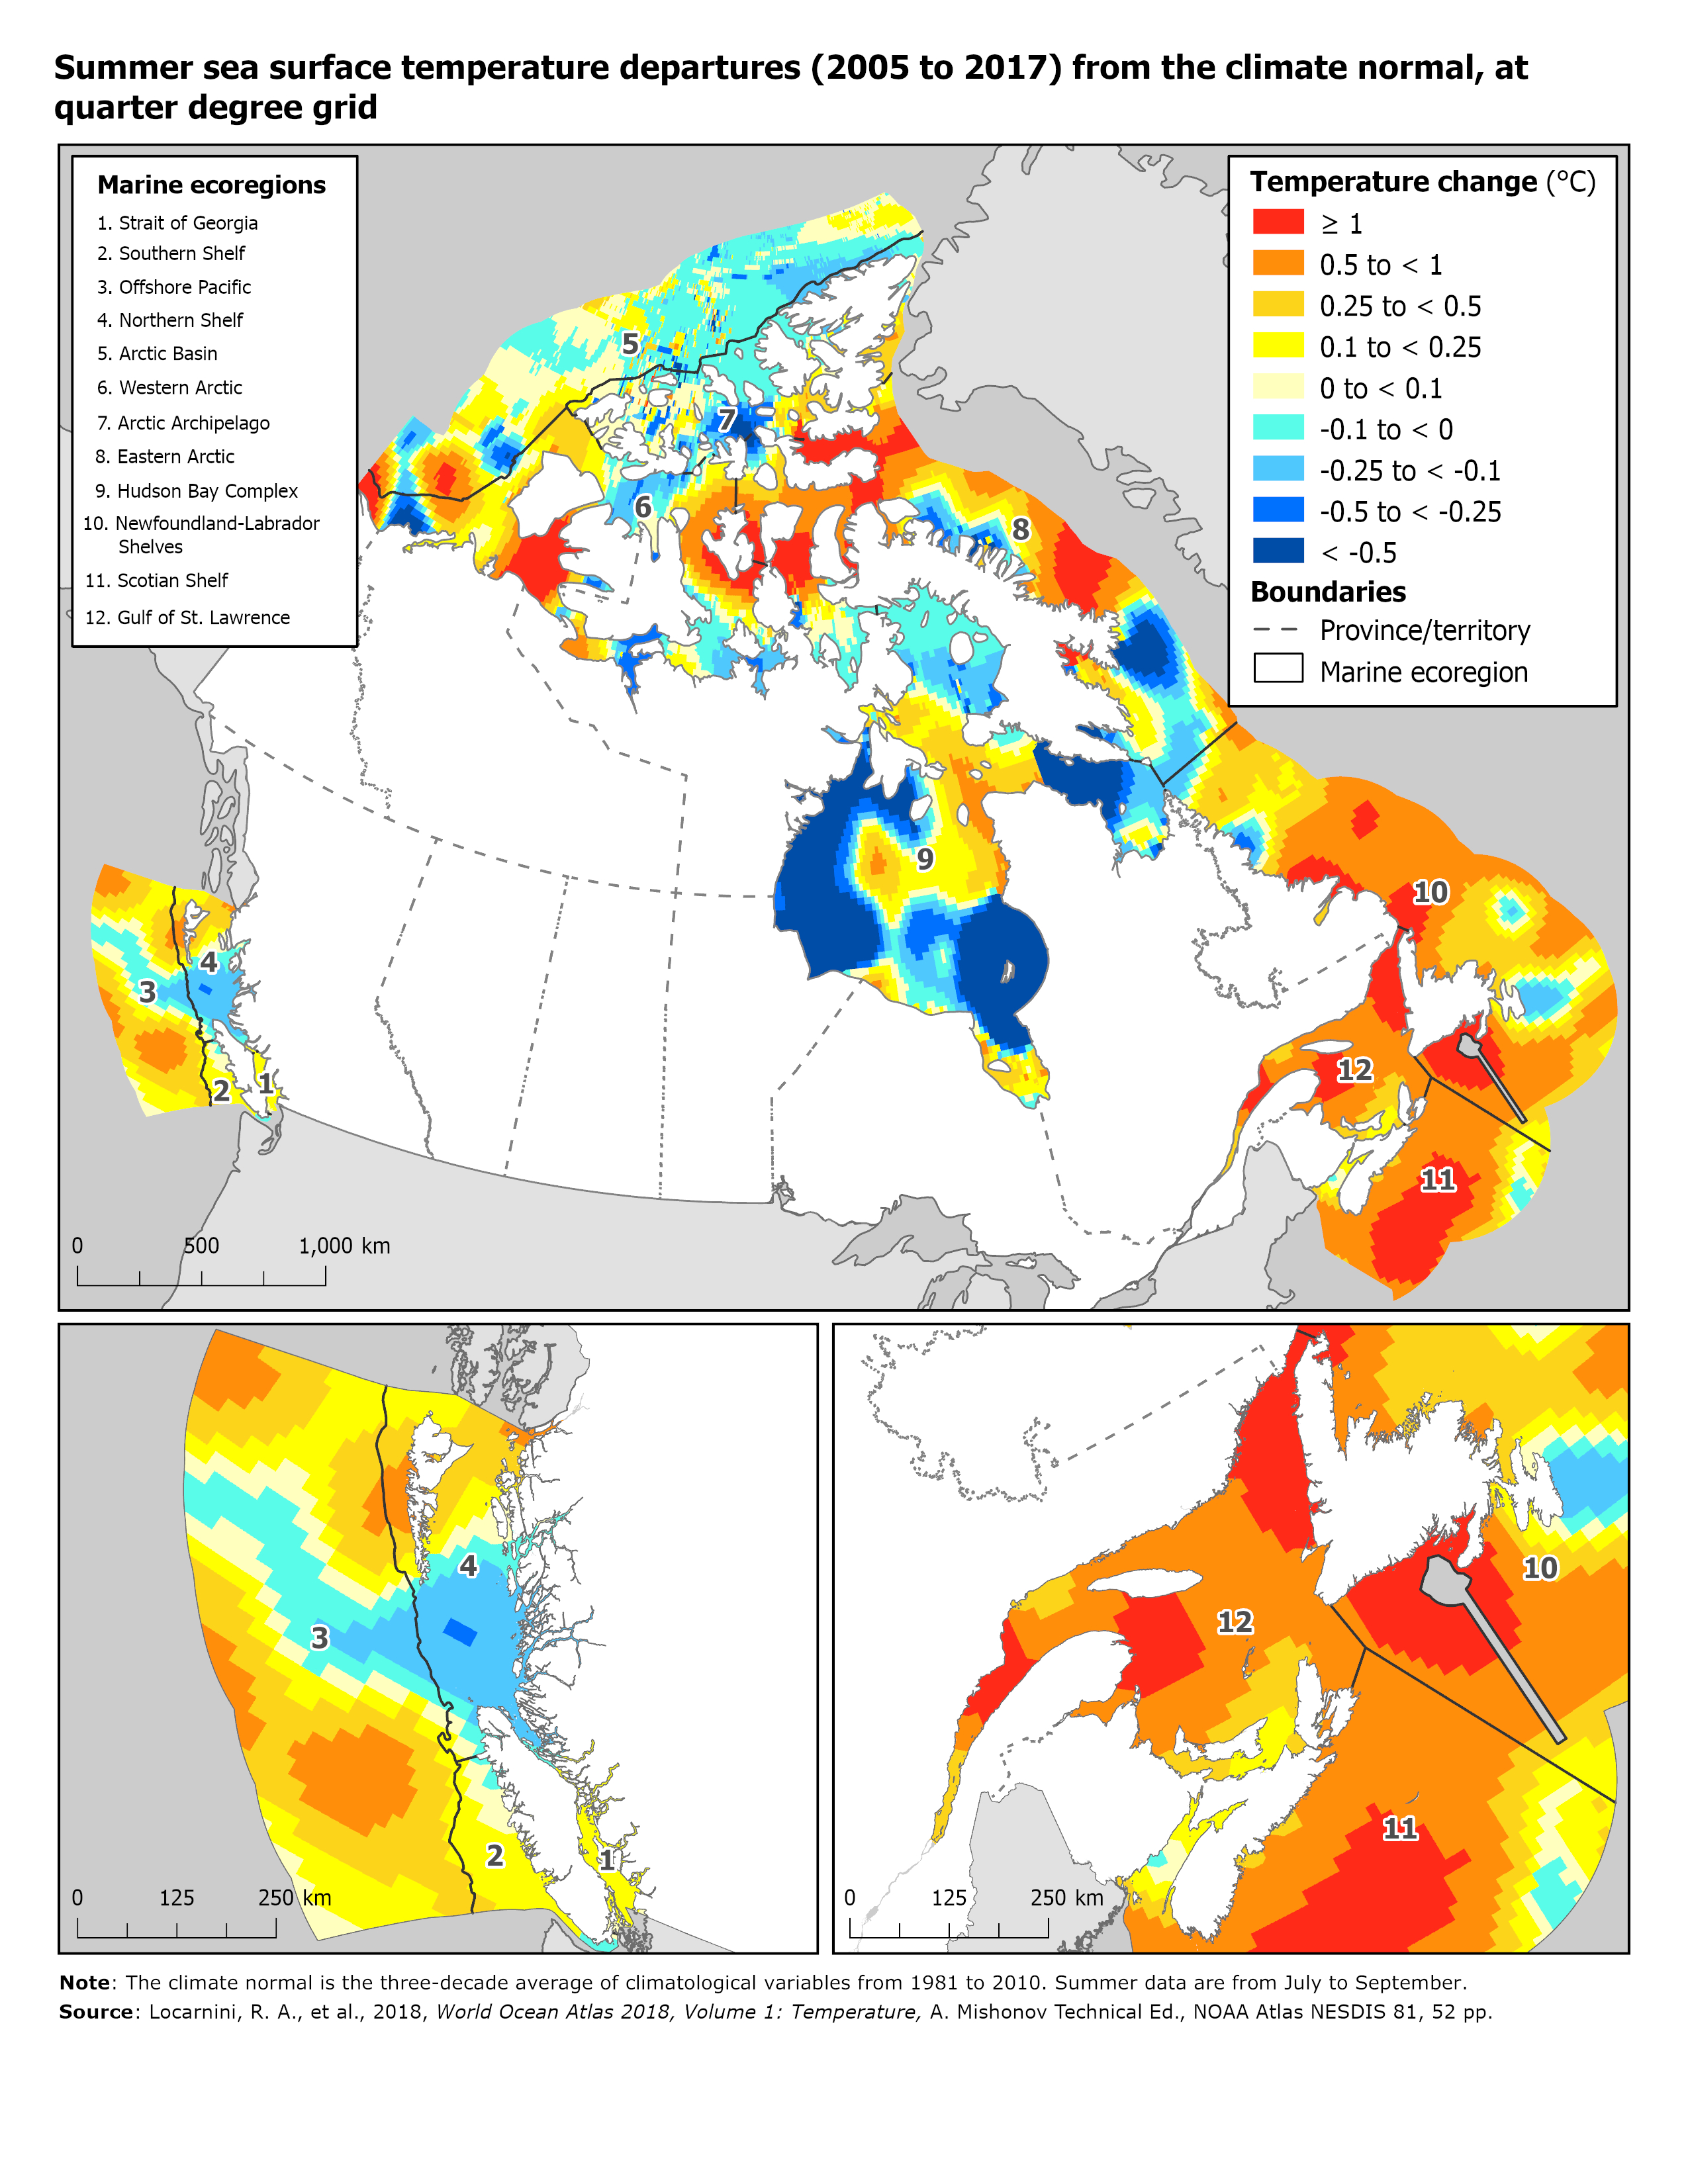
The title of this map is “Summer sea surface temperature departures (2005 to 2017) from the climate normal at quarter degree grid.” This map provides a detailed visual representation of the average summer surface temperature change of Canada’s oceans in the summer season.
On the page, there are three maps and two legends to the upper left and right. The first map (top) displays all of Canada, the second map (left) displays the West Coast and the third map (right) displays the East Coast. On the maps there are small numbers corresponding to marine ecoregions.
The maps show the gridded change in surface temperature in different shades of blue, yellow, orange and red. The first legend (left) lists the map labels and corresponding marine ecoregions. The second legend (right) contains nine temperature categories in degrees Celsius (°C): <-0.5 (navy blue), -0.5 to -0.25 (dark blue), -0.25 to -0.1 (light blue), -0.1 to 0 (aqua), 0 to 0.1 (pale yellow), 0.1 to 0.25 (yellow), 0.25 to 0.5 (pale orange), 0.5 to 1 (orange), ≥1 (red). The legend contains two boundary categories: fine dashed lines indicate provincial boundaries and fine black lines indicate marine ecoregion boundaries.
The maps show that compared to the 1981 to 2010 climate normal, the 2005 to 2017 average summer sea surface temperature generally increased on the east and west coasts, with mixed areas in the Arctic. The Scotian Shelf experienced the greatest increase in temperature and the Hudson Bay Complex experienced the greatest decrease in temperature.
Notes: The climate normal is the three-decade average of climatological variables from 1981 to 2010. Summer data are from July to September.
Sources: Locarnini, R. A., et al., 2018. World Ocean Atlas 2018: Volume 1: Temperature, A. Mishonov (Technical Ed.), NOAA Atlas NESDIS 81, 52 pp., https://www.nodc.noaa.gov/OC5/SELECT/woaselect/woaselect.html (accessed November 15, 2019).
| Label | Marine ecoregion |
|---|---|
| 1 | Strait of Georgia |
| 2 | Southern Shelf |
| 3 | Offshore Pacific |
| 4 | Northern Shelf |
| 5 | Arctic Basin |
| 6 | Western Arctic |
| 7 | Arctic Archipelago |
| 8 | Eastern Arctic |
| 9 | Hudson Bay Complex |
| 10 | Newfoundland-Labrador Shelves |
| 11 | Scotian Shelf |
| 12 | Gulf of St. Lawrence |
| Category | |
|---|---|
| Temperature change (°C) | Colour |
| ≥ 1 | Red |
| 0.5 to < 1 | Orange |
| 0.25 to < 0.5 | Pale orange |
| 0.1 to < 0.25 | Yellow |
| 0 to < 0.1 | Pale yellow |
| -0.1 to < 0 | Aqua |
| -0.25 to < -0.1 | Light blue |
| -0.5 to < -0.25 | Dark blue |
| < -0.5 | Navy blue |
| Boundaries | Shape |
| Province/territory | Dashed line |
| Marine ecoregion | Black outline |
| Marine ecoregion and depth class | Temperature departure classes | Total area | ||||||||
|---|---|---|---|---|---|---|---|---|---|---|
| < -0.5°C | -0.5°C to < -0.25°C | -0.25°C to < -0.1°C | -0.1°C to < 0°C | 0°C to < 0.1°C | 0.1°C to < 0.25°C | 0.25°C to < 0.5°C | 0.5°C to < 1°C | ≥ 1°C | ||
| percentage of area | km2 | |||||||||
| Strait of Georgia | 0.0 | 0.0 | 0.0 | 0.0 | 4.8 | 95.1 | 0.0 | 0.0 | 0.0 | 8,970 |
| Southern Shelf | 0.0 | 0.0 | 0.0 | 7.6 | 18.9 | 70.1 | 3.4 | 0.0 | 0.0 | 28,158 |
| Offshore Pacific | 0.0 | 0.0 | 3.5 | 13.0 | 11.8 | 22.8 | 33.1 | 15.8 | 0.0 | 315,724 |
| Northern Shelf | 0.0 | 1.4 | 38.7 | 11.5 | 6.1 | 15.4 | 20.3 | 6.6 | 0.0 | 101,328 |
| Arctic Basin | 0.3 | 2.8 | 8.5 | 37.3 | 25.9 | 14.8 | 5.2 | 3.9 | 1.3 | 752,053 |
| Western Arctic | 1.5 | 5.7 | 10.9 | 10.1 | 10.3 | 15.6 | 17.2 | 14.7 | 14.1 | 539,793 |
| Arctic Archipelago | 3.9 | 9.2 | 10.4 | 31.4 | 21.6 | 10.2 | 11.0 | 1.6 | 0.7 | 268,797 |
| Eastern Arctic | 5.0 | 5.1 | 8.6 | 10.0 | 8.9 | 10.0 | 12.1 | 21.9 | 18.4 | 782,639 |
| Hudson Bay Complex | 33.7 | 8.2 | 11.9 | 12.3 | 5.8 | 12.7 | 11.9 | 3.5 | 0.0 | 1,244,644 |
| Newfoundland-Labrador Shelves | 0.0 | 0.3 | 3.0 | 2.9 | 4.4 | 9.4 | 27.2 | 42.3 | 10.4 | 1,041,656 |
| Scotian Shelf | 0.0 | 0.0 | 0.0 | 2.0 | 3.4 | 7.4 | 7.6 | 48.8 | 30.8 | 416,485 |
| Gulf of St. Lawrence | 0.0 | 0.0 | 0.0 | 0.0 | 0.0 | 3.0 | 12.6 | 55.1 | 29.3 | 246,645 |
| Total EEZ | 8.4 | 3.9 | 7.8 | 12.9 | 9.7 | 12.4 | 15.2 | 20.3 | 9.4 | 5,746,893 |
- Date modified: