
Environmental Thematic Maps and Graphics:
Forest fire and harvesting

Archived Content
Information identified as archived is provided for reference, research or recordkeeping purposes. It is not subject to the Government of Canada Web Standards and has not been altered or updated since it was archived. Please "contact us" to request a format other than those available.
Text begins
Description for Map
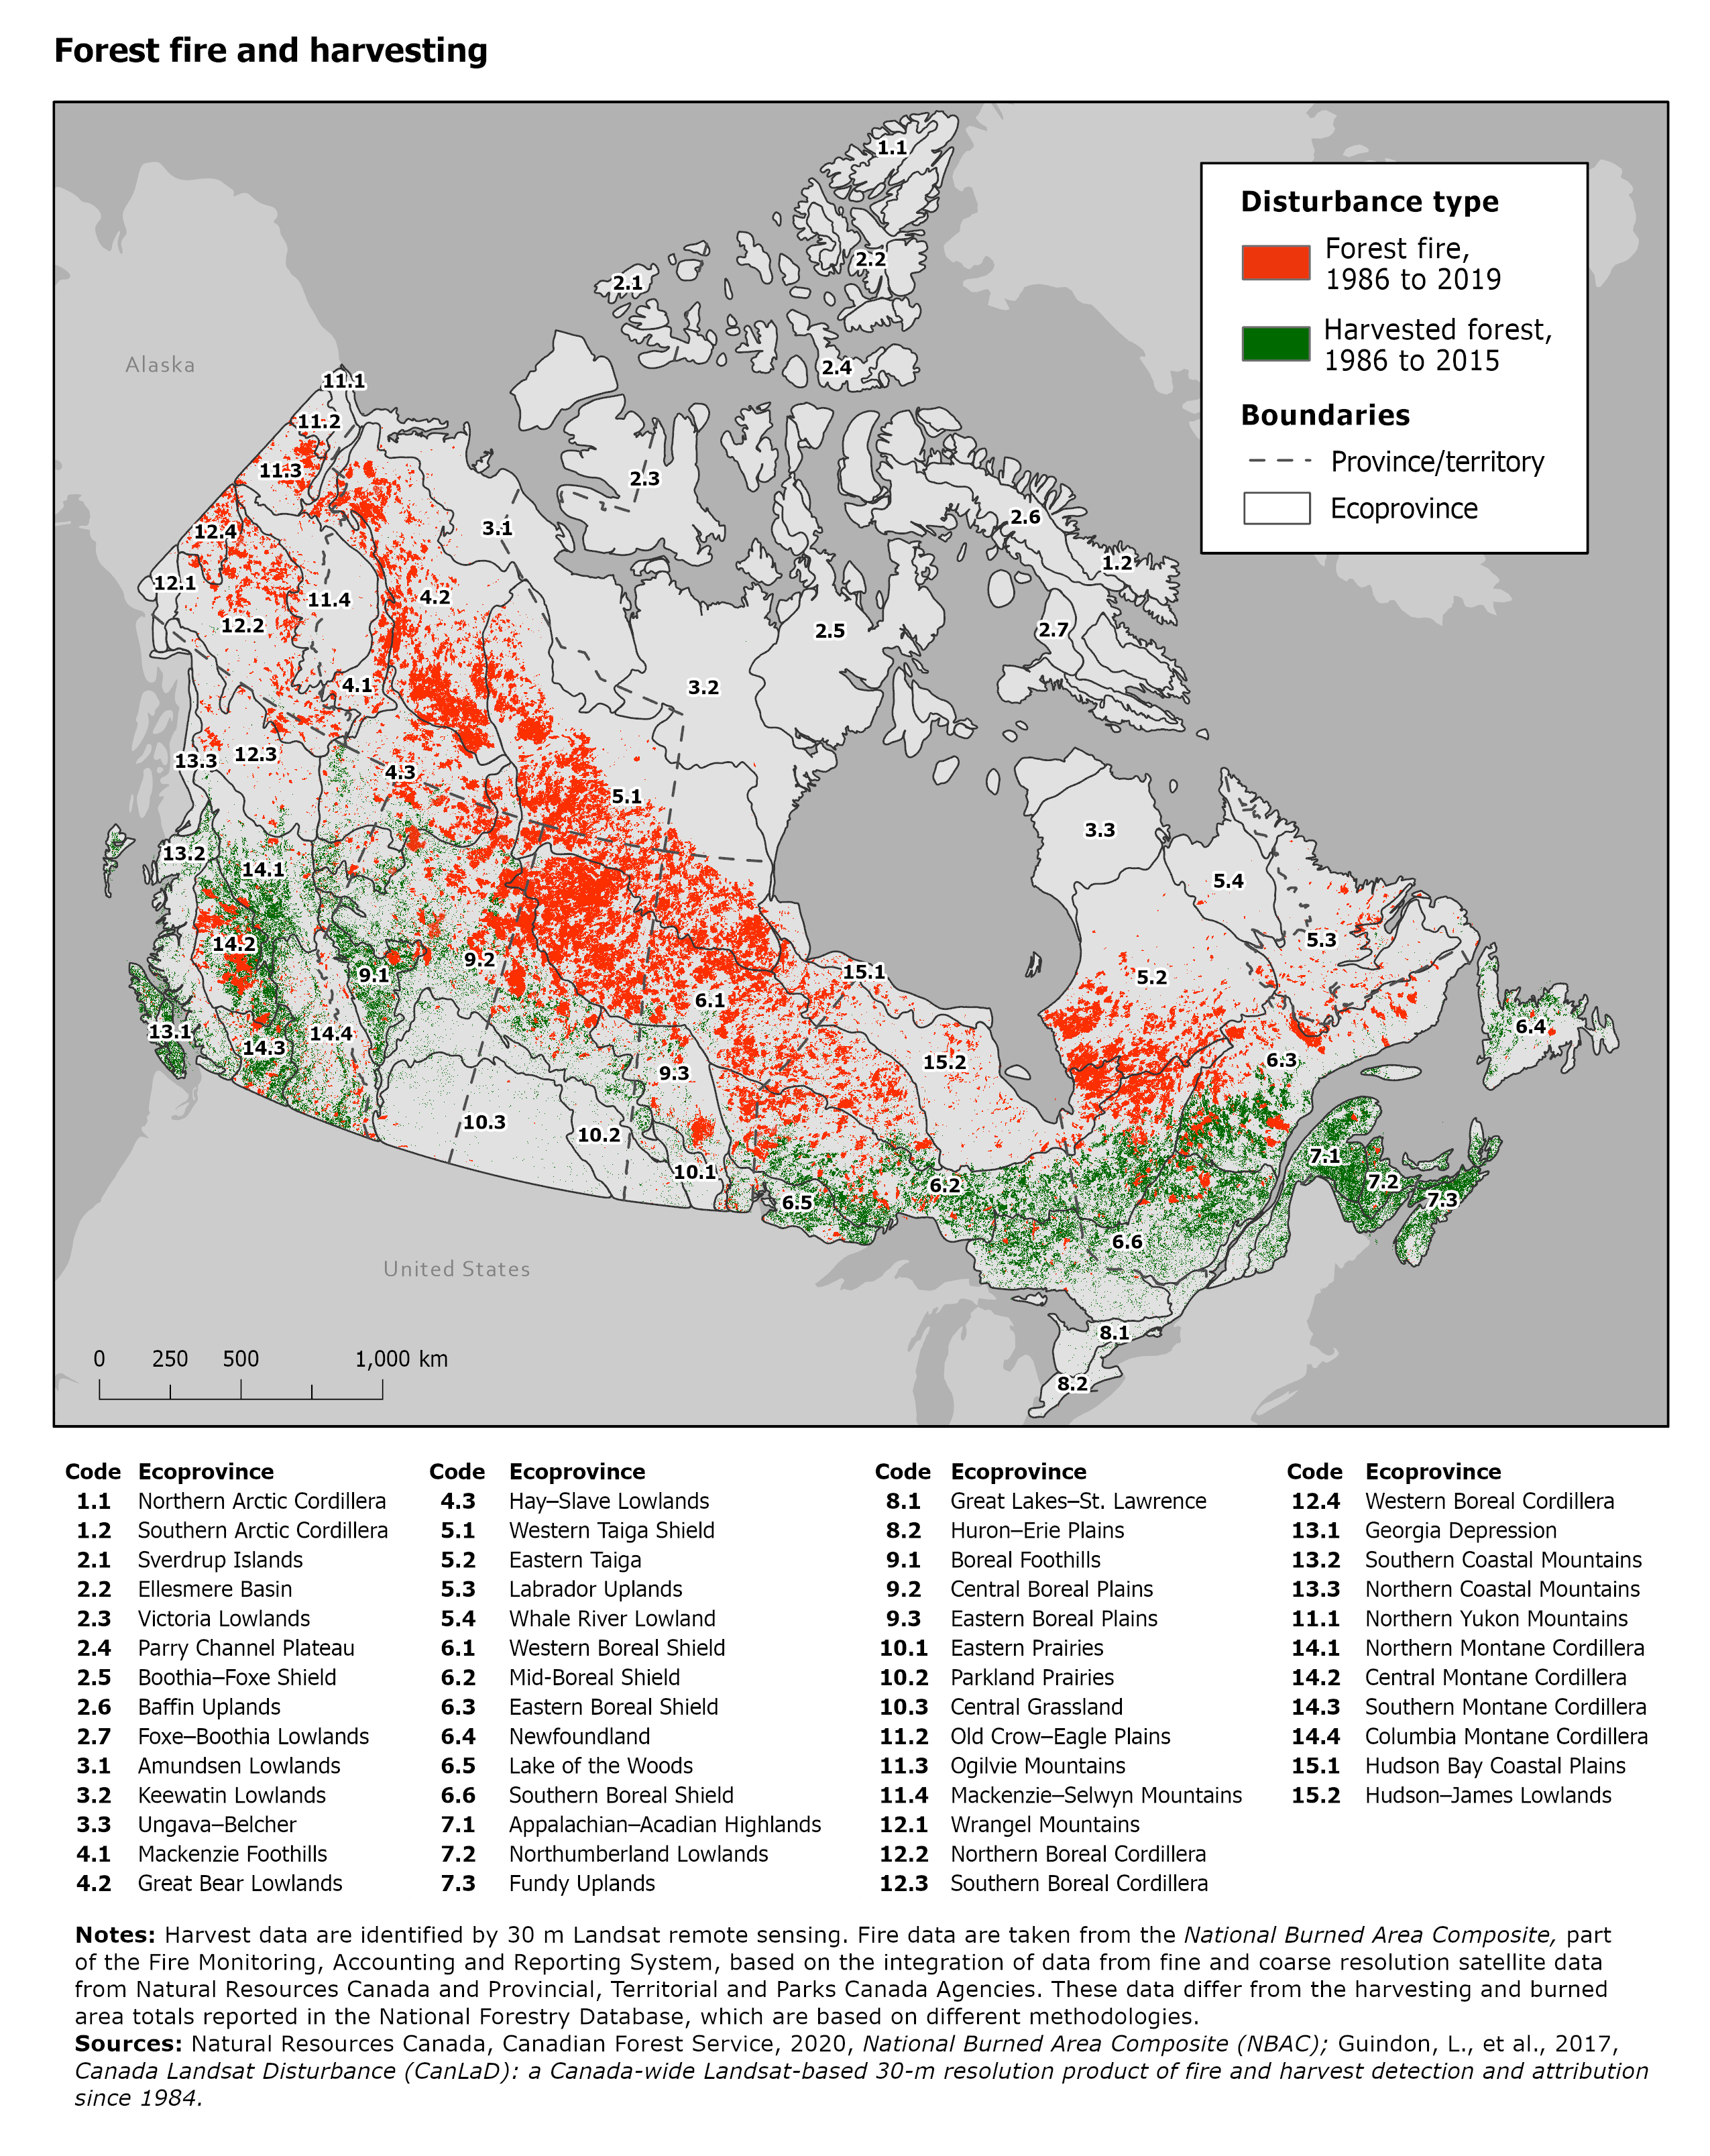
The title of this map is “Forest fire and harvesting.” This map provides a visual representation of forest fire and harvesting disturbance in Canada over several decades.
On the page, there is one large map of Canada, a legend to the upper right and a scale bar below. The map depicts ecoprovinces with a thin black boundary line labeled with their ecoprovince codes. Fine black dashed lines show provincial and territorial boundaries. Below the map, ecoprovince codes and their corresponding names are listed for reference.
The map shows the area affected by disturbance types by colour. The legend contains two categories: red displays forest fire disturbance between 1986 and 2019 and green displays harvested forest between 1986 and 2015.
The map shows that forest harvesting is the more common type of disturbance in southern Canada and appears particularly prevalent in Quebec, British Columbia and New Brunswick. Large expanses of the boreal forest stretching from the Yukon to Northern Quebec were affected by forest fires.
Notes: Harvest data are identified by 30 m Landsat remote sensing. Fire data are taken from the National Burned Area Composite, part of the Fire Monitoring, Accounting and Reporting System, based on the integration of data from fine and coarse resolution satellite data from Natural Resources Canada and Provincial, Territorial and Parks Canada Agencies. These data differ from the harvesting and burned area totals reported in the National Forestry Database, which are based on different methodologies.
Sources:
Natural Resources Canada, Canadian Forest Service, 2020, National Burned Area Composite (NBAC), http://cwfis.cfs.nrcan.gc.ca/datamart (accessed October 26, 2020);
Guindon, L., et al., 2017, Canada Landsat Disturbance (CanLaD): a Canada-wide Landsat-based 30-m resolution product of fire and harvest detection and attribution since 1984, https://doi.org/10.23687/add1346b-f632-4eb9-a83d-a662b38655ad (accessed July 20, 2020);
Data files downloaded from https://opendata.nfis.org/mapserver/nfis-change_eng.html (accessed July 20, 2020).
| Colour | Disturbance type |
|---|---|
| Red | Forest fire (1986 to 2019) |
| Green | Harvested forest (1986 to 2015) |
| Shape | Boundary |
| Dashed line | Province/territory |
| Black outline | Ecoprovince |
| Code | Fire, 1986 to 2019 | Harvest, 1986 to 2015 | |
|---|---|---|---|
| km2 | |||
| Canada | Note ...: not applicable | 761,510 | 258,422 |
| Northern Arctic Cordillera | 1.1 | 0 | 0 |
| Southern Arctic Cordillera | 1.2 | 0 | 0 |
| Sverdrup Islands | 2.1 | 0 | 0 |
| Ellesmere Basin | 2.2 | 0 | 0 |
| Victoria Lowlands | 2.3 | 0 | 0 |
| Parry Channel Plateau | 2.4 | 0 | 0 |
| Boothia–Foxe Shield | 2.5 | 0 | 0 |
| Baffin Uplands | 2.6 | 0 | 0 |
| Foxe–Boothia Lowlands | 2.7 | 0 | 0 |
| Amundsen Lowlands | 3.1 | 286 | 0 |
| Keewatin Lowlands | 3.2 | 28 | 1 |
| Ungava–Belcher | 3.3 | 0 | 0 |
| Mackenzie Foothills | 4.1 | 14,292 | 37 |
| Great Bear Lowlands | 4.2 | 72,140 | 155 |
| Hay–Slave Lowlands | 4.3 | 30,344 | 3,180 |
| Western Taiga Shield | 5.1 | 124,147 | 114 |
| Eastern Taiga | 5.2 | 42,748 | 50 |
| Labrador Uplands | 5.3 | 8,990 | 36 |
| Whale River Lowland | 5.4 | 367 | 1 |
| Western Boreal Shield | 6.1 | 164,378 | 3,486 |
| Mid-Boreal Shield | 6.2 | 53,716 | 46,285 |
| Eastern Boreal Shield | 6.3 | 28,591 | 21,965 |
| Newfoundland | 6.4 | 1,026 | 4,540 |
| Lake of the Woods | 6.5 | 2,166 | 7,824 |
| Southern Boreal Shield | 6.6 | 5,542 | 31,543 |
| Appalachian–Acadian Highlands | 7.1 | 453 | 18,439 |
| Northumberland Lowlands | 7.2 | 457 | 7,743 |
| Fundy Uplands | 7.3 | 106 | 13,503 |
| Great Lakes–St. Lawrence Lowlands | 8.1 | 42 | 1,035 |
| Huron–Erie Plains | 8.2 | 8 | 161 |
| Boreal Foothills | 9.1 | 6,235 | 15,013 |
| Central Boreal Plains | 9.2 | 71,476 | 19,694 |
| Eastern Boreal Plains | 9.3 | 9,775 | 2,132 |
| Eastern Prairies | 10.1 | 179 | 235 |
| Parkland Prairies | 10.2 | 215 | 1,021 |
| Central Grassland | 10.3 | 502 | 668 |
| Northern Yukon Mountains | 11.1 | 358 | 0 |
| Old Crow–Eagle Plains | 11.2 | 1,332 | 0 |
| Ogilvie Mountains | 11.3 | 10,492 | 2 |
| Mackenzie–Selwyn Mountains | 11.4 | 3,517 | 15 |
| Wrangel Mountains | 12.1 | 23 | 0 |
| Northern Boreal Cordillera | 12.2 | 30,564 | 339 |
| Southern Boreal Cordillera | 12.3 | 5,186 | 359 |
| Western Boreal Cordillera | 12.4 | 9,886 | 39 |
| Georgia Depression | 13.1 | 35 | 3,470 |
| Southern Coastal Mountains | 13.2 | 1,006 | 8,553 |
| Northern Coastal Mountains | 13.3 | 48 | 35 |
| Northern Montane Cordillera | 14.1 | 2,786 | 12,914 |
| Central Montane Cordillera | 14.2 | 18,628 | 14,985 |
| Southern Montane Cordillera | 14.3 | 3,979 | 8,397 |
| Columbia Montane Cordillera | 14.4 | 5,624 | 10,198 |
| Hudson Bay Coastal Plains | 15.1 | 1,888 | 1 |
| Hudson–James Lowlands | 15.2 | 27,951 | 253 |
| ... not applicable | |||
- Date modified: