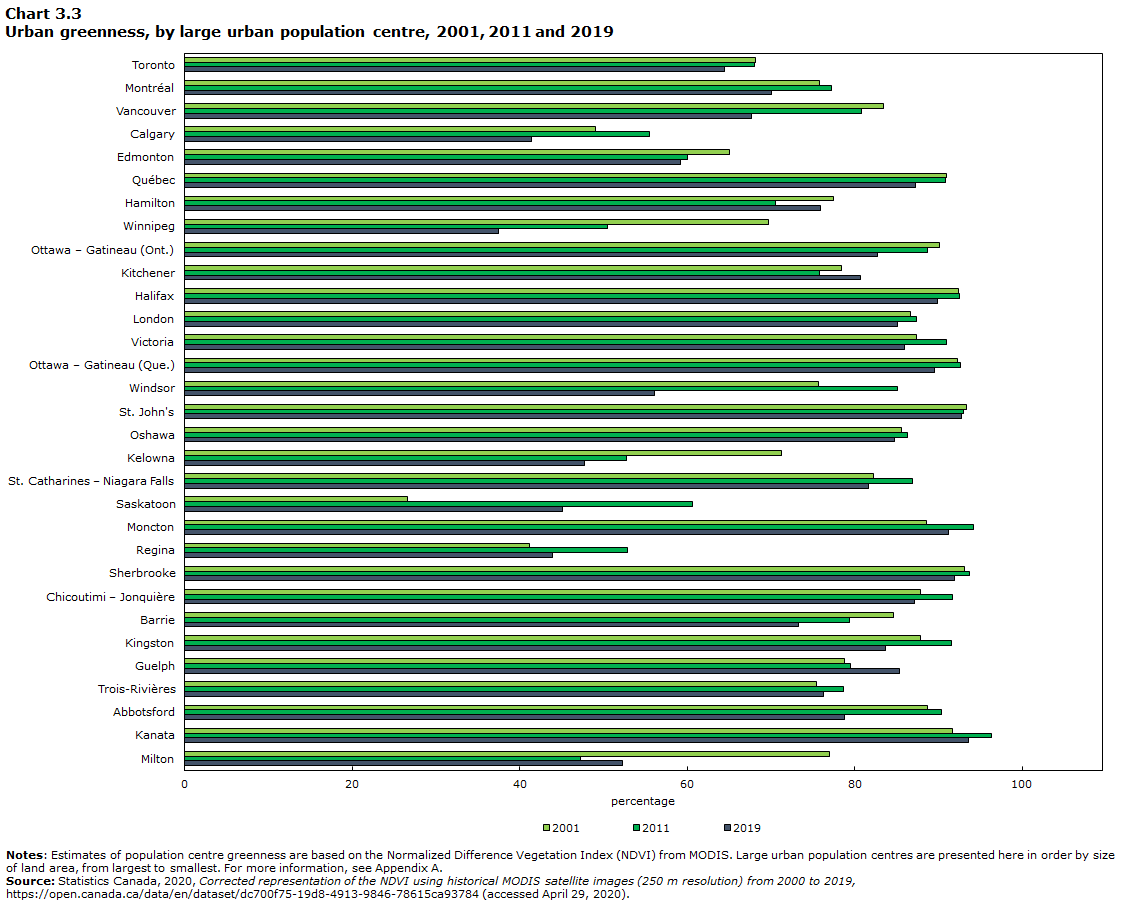
Chart 3.3
Urban greenness, by large urban population centre, 2001, 2011 and 2019

Data table for Chart 3.3
| 2001 | 2011 | 2019 | |
|---|---|---|---|
| percent | |||
| Toronto | 69 | 68 | 65 |
| Montréal | 76 | 78 | 70 |
| Vancouver | 84 | 81 | 68 |
| Calgary | 49 | 56 | 42 |
| Edmonton | 65 | 60 | 60 |
| Québec | 91 | 91 | 88 |
| Hamilton | 78 | 71 | 76 |
| Winnipeg | 70 | 51 | 38 |
| Ottawa – Gatineau (Ont.) | 91 | 89 | 83 |
| Kitchener | 79 | 76 | 81 |
| Halifax | 93 | 93 | 90 |
| London | 87 | 88 | 86 |
| Victoria | 88 | 91 | 86 |
| Ottawa – Gatineau (Que.) | 93 | 93 | 90 |
| Windsor | 76 | 85 | 56 |
| St. John's | 94 | 93 | 93 |
| Oshawa | 86 | 87 | 85 |
| Kelowna | 72 | 53 | 48 |
| St. Catharines – Niagara Falls | 83 | 87 | 82 |
| Saskatoon | 27 | 61 | 46 |
| Moncton | 89 | 95 | 92 |
| Regina | 42 | 53 | 44 |
| Sherbrooke | 94 | 94 | 92 |
| Chicoutimi – Jonquière | 88 | 92 | 87 |
| Barrie | 85 | 80 | 74 |
| Kingston | 88 | 92 | 84 |
| Guelph | 79 | 80 | 86 |
| Trois-Rivières | 76 | 79 | 77 |
| Abbotsford | 89 | 91 | 79 |
| Kanata | 92 | 97 | 94 |
| Milton | 77 | 48 | 53 |
|
Notes: Estimates of population centre greenness are based on the Normalized Difference Vegetation Index (NDVI) from MODIS. Large urban population centres are presented here in order by size of land area, from largest to smallest. For more information, see Appendix A. Source: Statistics Canada, 2020, Corrected representation of the NDVI using historical MODIS satellite images (250 m resolution) from 2000 to 2019, https://open.canada.ca/data/en/dataset/dc700f75-19d8-4913-9846-78615ca93784 (accessed April 29, 2020). |
|||
- Date modified: