
Aboriginal Peoples Survey
Harvesting activities among First Nations people living off reserve, Métis and Inuit: Time trends, barriers and associated factors

Archived Content
Information identified as archived is provided for reference, research or recordkeeping purposes. It is not subject to the Government of Canada Web Standards and has not been altered or updated since it was archived. Please "contact us" to request a format other than those available.
by Mohan B. Kumar, Chris Furgal, Peter Hutchinson, Wade Roseborough and Stephanie Kootoo-Chiarello
Skip to text
Text begins
Mohan B. Kumar, Wade Roseborough and Stephanie Kootoo-Chiarello: Statistics Canada
Chris Furgal: Indigenous Environmental Studies & Sciences Program, Trent University
Peter Hutchinson: Canadian Partnership Against Cancer
Note to readers: Chris Furgal and Peter Hutchinson were primarily involved in the Inuit- and Métis-related parts of the study, respectively.
Acknowledgements
The authors wish to thank the valuable contribution of Eric Loring, Inuit Tapiriit Kanatami in the development of the proposal, analysis and drafting of the paper. His insight and interpretations greatly strengthened the paper. They also acknowledge the input and feedback on draft versions of the article provided by Esther Usborne (Inuit Tapiriit Kanatami); Annie Gingras (The Congress of Aboriginal Peoples); and Christopher Penney, James Falconer and Jennie Thompson (Indigenous Services Canada (ISC) and Crown-Indigenous Relations and Northern Affairs Canada (CIRNAC)).
Executive summary
Harvesting activities such as hunting, fishing, trapping and gathering wild plants have been part of Indigenous peoples’ ways of living for millennia. They have endured despite the impact of colonization, including the impacts of residential schools, relocation to permanent settlements and introduction of the wage economy. This paper examines trends in harvesting activities, specifically hunting, fishing or trapping and gathering wild plants or berries, among First Nations people living off reserve, Métis and Inuit using four cycles of the Aboriginal Peoples Survey (2001, 2006, 2012 and 2017). It also explores self-reported barriers to participation in harvesting activities and associated factors.
Key findings
First Nations people living off reserve
In 2017, one in three (33%) First Nations people living off reserve hunted, fished or trapped, and three in ten (30%) gathered wild plants or berries. Across four cycles of the Aboriginal Peoples Survey (APS), spanning 2001 and 2017, overall, little variation in prevalence of harvesting was seen. Characteristics that were associated with hunting, fishing or trapping include remoteness of residence, sex, household income, age, household type and involvement in First Nations organizations, social events or cultural activities. For example, the likelihood of hunting, fishing or trapping increased with increasing household income. Characteristics associated with gathering include remoteness, sex, being unemployed, household type, having spent time trying to find out more about First Nations history, traditions and culture, and being active in First Nations organizations, social events or cultural activities. First Nations people who had not hunted, fished or trapped in the previous year despite being interested reported several barriers to participation. The leading self-reported barriers to harvesting activities were time constraints and location: 41% reported not having enough time to hunt, fish or trap, and 28% cited location barriers. Time constraints were more likely to be reported by employed individuals (54%) than those unemployed (27%Note E : use with caution) or out of the labour force (23%). The results allude to the ties between harvesting activities and the wage economy.
Métis
Among Métis, in 2017, about one in three (35%) had hunted, fished or trapped. Across four cycles of the APS, the prevalence of hunting, fishing or trapping was lower in 2012 (36%) and 2017 (35%) compared to 2006 levels (44%). Among youth and young adults, a significant downward trend was evident after 2006. It decreased from 46% in 2006 to 38% in 2012 and 33% in 2017. For gathering wild plants or berries, no significant upward or downward trend was observed. Several characteristics were associated with participation in hunting, fishing or trapping including remoteness of place of residence, sex, household income, labour force status, age, health, and involvement in Métis organizations, social events or cultural activities. For example, those who were employed were significantly more likely to hunt, fish or trap than out-of-the-labour-force Métis. In 2017, Métis who had not harvested in the previous year in spite of being interested cited several barriers to participation. The leading barrier to hunting, fishing or trapping was time, reported by 47%. Nearly two-thirds (62%) of those employed reported not having enough time for these activities while a significantly smaller proportion of those unemployed (37%Note E : use with caution) and out of the labour force (20%) did so. For gathering, remoteness, sex, being unemployed, having spent time trying to find out more about Métis history, traditions and culture, and being active in Métis organizations, social events or cultural activities were associated with participation in this activity, and the predominant barrier was time. The findings on associated characteristics complement the self-reported barriers, and describe the relationship between participation in harvesting activities and the wage economy.
Inuit
Among Inuit in Inuit Nunangat, the Inuit homeland in Canada, about two-thirds (65%) had hunted, fished or trapped and about one-half (47%) had gathered wild plants or berries in 2017. Across four cycles of the APS, spanning nearly 20 years, a decreasing trend in participation in hunting, fishing or trapping emerged after 2006. When examined by age group, the declining trend was seen only among working-age adults. Participation decreased from 70% in 2006 to 63% in 2012 to 58% in 2017. Several socioeconomic and demographic characteristics were associated with participation in hunting, fishing or trapping including sex, labour force status, household type and involvement in Inuit organizations, social events or cultural activities. For example, employed Inuit were more likely than unemployed and out-of-the-labour-force Inuit to hunt, fish or trap. For gathering wild plants or berries, only Inuit Nunangat region of residence, sex, being out of the labour force and being active in Inuit organizations, social events or cultural activities were associated with participation. Inuit who had not hunted, fished or trapped in the previous year despite being interested identified several barriers to participation. The predominant barriers include time, money and location. Time (33%) and monetary (29%) barriers were cited by about one in three, while location barriers were reported by one in five (19%). Inuit who were employed (47%) were more than twice as likely to report time-related barriers to hunting, fishing or trapping than those unemployed (21%Note E : use with caution) or out of the labour force (20%Note E : use with caution). In contrast, employed Inuit (21%) were significantly less likely to report monetary barriers than the other two labour force groups (58% among the unemployed and 31% among out-of-the-labour-force Inuit). These factors and barriers describe some of the features of the mixed economy in Inuit regions that blends harvesting with the wage economy, and allude to the tensions between participation in harvesting activities and wage economy.
Background
Harvesting activities such as hunting, fishing, trapping and gathering wild plants have been part of Indigenous peoples’ way of life in Canada for millennia. Despite the impact of colonization, and the resulting effect of residential schools, relocation to permanent settlements, introduction of the wage economy, and political constraints which directly or indirectly impacted harvesting activities,Note 1Note 2Note 3 they have endured. However, as a result of continuing economic, social and political pressures, emerging climatic factors, and potentially decreased transmission of traditional knowledge and skills, participation in these activities in many communities is declining.Note 3Note 4 This is of great concern considering the multiple benefits of engagement in harvesting activities.
Participation in harvesting activities has been identified as being important for the fostering cultural identity and morale.Note 5 Among InuitNote 5Note 6Note 7 and First Nations people on reserve,Note 8 it is key to meeting nutritional needs and supporting food security. Other advantages include increased physical activity, prevention of chronic disease, better mental health, and lower food costs.Note 5 There are also mostly unrecognized benefits to the economy. Harvesting and gathering activities are conservatively estimated to have a “shadow value” of over $10 million in the Qikiqtaaluk Region of Nunavut alone.Note 9 Despite these benefits, a clear national picture of harvesting activities is missing.
Some studies have examined prevalence of participation at a snapshot in time. In 1991, approximately 50-80% of Registered Indians, or those who are registered under the Indian Act of Canada, participated in traditional activities with differences being influenced by place of residence, age group and gender.Note 10 Among Métis in Canada, in 2006, fishing and gathering wild plants were the most prevalent harvesting activities, with 40% and 30%, respectively, of those 15 years or older engaged in these activities.Note 11 Among Inuit, studies have alluded to a decline in participation in harvesting activities in the younger generation.Note 12Note 13Note 14 However, few studies have examined trends over time among off-reserve First Nations people and Métis. Further, there is ample evidence of growing and shifting challenges to harvesting activities among First Nations people and Inuit.Note 3Note 4Note 14
Many studies have explored barriers to participation in harvesting activities. Time limitations due to employment is the most frequently reported barrier.Note 3 School attendance and family responsibilities also exacerbate the time constraint. This is followed by ever-increasing financial cost for vehicles, equipment and fuel,Note 15Note 16Note 17Note 18 ammunition costs, longer travel distances, and obtaining gun licences.Note 3Note 16Note 19 Employment in the context of harvesting activities has been portrayed as a double-edged sword since it provides the financial resources to procure equipment and supplies but reduces the time available for these activities.Note 3 Other factors include a lack of interest and/or knowledge required for harvesting activities,Note 3Note 16 poor health or disability, school attendance, childcare and declining game animal population numbers.Note 3
The role of the residential school system on harvesting activities today is expected to be significant because of its impact on multiple aspects of Indigenous peoples lives.Note 20Note 21Note 22Note 23 In this system, parents and elders could not transmit their traditional knowledge and skills when children were removed from their home, and many were prohibited from practicing traditional activities.Note 24 The intergenerational impacts of residential school attendance extend to harvesting activities.Note 3Note 24
Climate change is also playing an increasingly significant role in influencing harvesting activities, particularly among Indigenous people in the Arctic, since it is making these activities more dangerous and, by some reports, restricting access to typical hunting areas.Note 25Note 26Note 27 It has influenced changes in the appearance and availability of fish species, declines in numbers of caribou and moose, hunting periods, and changes to weather conditions affecting travel and safe access to harvesting areas.Note 28Note 19 Other environmental impacts on harvesting include contamination of traditional foods.Note 29 In totality, the barriers to harvesting activities are considered “complex, dynamic, and occur[ing] at multiple scales of experience.”Note 3
Several programs have been developed to support harvesting activities among First Nations people, Métis and Inuit. These programs include the Commercial Harvest Program, Traditional Harvest Program, Western Harvester’s Assistance Program, community organized hunts, Take a Kid Trapping Program, to name a few.Note 29Note 30 In Nunavut, the Nunavut Harvester Support Program helps members obtain hunting and fishing supplies.Note 16 In Nunavik the Inuit Hunting, Fishing and Trapping Support Program provides a variety of forms of support and assistance to increase participation in, success of and contributions by participation in these activities to community health and well-being.Note 31
While there are numerous studies on harvesting activities, many are often limited to Inuit or on-reserve First Nations peoples. Furthermore, a national picture on trends, reasons for participating or not participating, and factors associated with harvesting activities among First Nations people living off reserve, Métis and Inuit is lacking. This paper will contribute to the growing body of literature and could inform the development of tailored programs and policies to increase participation.
Aim of study
This paper aims to address existing information gaps on prevalence, trends and factors associated with harvesting activities by answering several questions using the nationally representative APS over several cycles. These questions include: (1) is participation in harvesting activities – specifically, hunting, fishing or trapping and gathering wild plants or berries – changing over time among First Nations people living off reserve, Métis and Inuit, (2) what labour force, socioeconomic and demographic factors are associated with participation in harvesting activities, and (3) what are the reasons for participation and non-participation in harvesting activities, and are they different by sex, age group, labour force status, place of residence and family type? The findings could further understanding of harvesting barriers and facilitators among these populations. This could inform the development of policies and programs to increase participation in harvesting activities.
Note to reader: While the time trends are based on four cycles of the APS, the bulk of the statistics presented are based on two cycles of the APS: 2012 and 2017. The 2012 APS was used where similar data was not available from the 2017 APS. The reference years are indicated at the beginning of the section as applicable.
Results
Harvesting among First Nations people living off-reserve
Hunting, fishing, trapping and gathering wild plants have been an integral part of First Nations people’s way of living since time immemorial. These activities are the foundations of cultural identity for many First Nations people in Canada. They are also important for livelihood, nutrition, health and physical fitness, and retaining traditional knowledge of the land and way of life of First Nations people.Note 32 Land-based practices vary by region, availability of food species and traditional practices.Note 32 In spite of the detrimental effects of colonization, including the impacts of residential schools and other economic, social and political factors such as the introduction of the wage economy, harvesting activities have endured.Note 3Note 24
Several barriers to harvesting have been identified previously among First Nations people living on reserve. These include time limitations as a result of employment and lack of interest and/or harvesting knowledge.Note 3 Other constraints include poor health, childcare responsibilities and cost of harvesting. Barriers vary by region and community. For example, among two communities in the same reserve in Alberta, the predominant barriers differed. In one, it was the financial cost of harvesting, while in the other it was not having enough time as a result of being employed.Note 3 Barriers also vary by age and sex.
Little is known about these activities among First Nations people living off reserve. This section explores trends in participation in harvesting activities, factors associated with participation, and reasons for participation and non-participation among off-reserve First Nations people aged 15 years or older.
Prevalence of harvesting activities among off-reserve First Nations people varies little by province and territory
In 2017, nearly one-half (47%) of First Nations people living off reserve reported having engaged in harvesting activities, i.e. hunting, fishing, trapping or gathering wild plants or berries in the past 12 months. One in three (33%) hunted, fished or trapped, and a somewhat lower proportion (30%) gathered wild plants or berries.
Prevalence of hunting, fishing or trapping (Map 1) showed little variation by province and territory with the exception of Yukon (58%) and Newfoundland and Labrador (56%), where First Nations people living off reserve were significantly more likely to engage in this activity than those in other jurisdictions (ranging from 28% to 37%). The patterns were similar for gathering wild plants or berries (Map 2).

Description for Map 1
| Province or Territory | Percent |
|---|---|
| Newfoundland and Labrador | 56 |
| Prince Edward Island | Note F: too unreliable to be published |
| Nova Scotia | 33 |
| New Brunswick | 35 |
| Quebec | 35 |
| Ontario | 34 |
| Manitoba | 30 |
| Saskatchewan | 33 |
| Alberta | 32 |
| British | 28 |
| Yukon | 58 |
| Northwest Territories | 37 |
| Nunavut | 43Note E: Use with caution |
|
E use with caution F too unreliable to be published Source: Statistics Canada, Aboriginal Peoples Survey, 2017. |
|
This map shows the percent of First Nations people living off reserve, aged 15 or older, who had hunted, fished or trapped in the previous 12 months in 2017 by province and territory. The provinces and territories are shown in lighter or darker shades of green based on the percent.
| Colour | Description |
|---|---|
| Lightest green | Represents percentages less than 25% |
| Second darkest green | Represents percentages from 25% to less than 34% |
| Third darkest green | Represents percentages from 34% to less than 50% |
| Darkest green | Represents percentages 50% or greater |

Description for Map 2
| Province or Territory | Percent |
|---|---|
| Newfoundland and Labrador | 64 |
| Prince Edward Island | Note F: too unreliable to be published |
| Nova Scotia | 41 |
| New Brunswick | 44 |
| Quebec | 24 |
| Ontario | 28 |
| Manitoba | 23 |
| Saskatchewan | 24 |
| Alberta | 29 |
| British | 30 |
| Yukon | 47 |
| Northwest Territories | 30 |
| Nunavut | Note F: too unreliable to be published |
|
F too unreliable to be published Source: Statistics Canada, Aboriginal Peoples Survey, 2017. |
|
This map shows the percent of First Nations people living off reserve, aged 15 or older, who had gathered wild plants or berries in the previous 12 months in 2017 by province and territory. The provinces and territories are shown in lighter or darker shades of purple based on the percent.
| Colour | Description |
|---|---|
| Lightest purple | Represents percentages less than 25% |
| Second darkest purple | Represents percentages from 25% to less than 34% |
| Third darkest purple | Represents percentages from 34% to less than 50% |
| Darkest purple | Represents percentages 50% or greater |
Little variation in prevalence of hunting, fishing or trapping across cycles among First Nations people living off reserve
While the picture from 2017 provides the most recent snapshot of harvesting activities among First Nations people living off reserve, examining prevalence over time could identify potential trends. To date, few studies have examined trends in prevalence of harvesting over time among First Nations people,Note 33 particularly among those living off reserve. When participation in harvesting activities was compared over four cycles of the APS among First Nations people living off reserve aged 15 or older, some variation in prevalence of hunting, fishing or trapping was evident. The prevalence was lower in 2017 (33%) compared to 2001 and 2006 (37%), representing a 10% decrease. The prevalence of gathering wild plants or berries did not markedly vary across the four cycles.
Among the three age groups, older adults (aged 55 or older) were consistently less likely to hunt, fish or trap than youth and young adults (aged 15 to 24) or core working-age adults (aged 25 to 54) across the cycles (Chart 1). No significant upward or downward trend was seen in the three age groups. However, among youth and young adults, the prevalence in 2017 (33%) was significantly lower than in 2006 (41%) and 2012 (38%).

Data table for Chart 1
| Age group | 2001 | 2006 | 2012 | 2017 | ||||||||
|---|---|---|---|---|---|---|---|---|---|---|---|---|
| Percent | 95% confidence interval | Percent | 95% confidence interval | Percent | 95% confidence interval | Percent | 95% confidence interval | |||||
| Lower | Upper | Lower | Upper | Lower | Upper | Lower | Upper | |||||
| 15 to 24 years | 36 | 33 | 39 | 41 | 38 | 44 | 38 | 34 | 41 | 33 | 30 | 35 |
| 25 to 54 years | 39 | 37 | 42 | 38 | 37 | 40 | 37 | 34 | 39 | 36 | 34 | 38 |
| 55 years or older | 27 | 24 | 31 | 29 | 26 | 32 | 26 | 23 | 30 | 28 | 26 | 30 |
| Sources: Statistics Canada, Aboriginal Peoples Survey, 2001, 2006, 2012 and 2017. | ||||||||||||
Youth and young adults were less likely to participate in wild plant or berry gathering than those in other age groups in most cycles (Chart 2). Little variation in prevalence was evident across cycles among the three age groups.
Data table for Chart 2
| Age group | 2001 | 2006 | 2012 | 2017 | ||||||||
|---|---|---|---|---|---|---|---|---|---|---|---|---|
| Percent | 95% confidence interval | Percent | 95% confidence interval | Percent | 95% confidence interval | Percent | 95% confidence interval | |||||
| Lower | Upper | Lower | Upper | Lower | Upper | Lower | Upper | |||||
| 15 to 24 years | 20 | 17 | 22 | 26 | 24 | 28 | 23 | 21 | 26 | 22 | 20 | 24 |
| 25 to 54 years | 31 | 29 | 33 | 31 | 30 | 33 | 30 | 28 | 33 | 32 | 30 | 34 |
| 55 years or older | 28 | 25 | 33 | 28 | 25 | 31 | 31 | 27 | 35 | 33 | 31 | 35 |
| Sources: Statistics Canada, Aboriginal Peoples Survey, 2001, 2006, 2012 and 2017. | ||||||||||||
Males were consistently more likely to hunt, fish or trap than females. For males, a significantly lower percentage (17% lower) participated in 2017 (42%) compared with 2006 (50%). Among females, little variation was seen from cycle to cycle. Females were consistently more likely to gather wild plants or berries than males. No upward or downward trend emerged in either sex.
Off-reserve First Nations people living in rural areas were consistently more likely to hunt, fish or trap and gather wild plants or berries than those in urban areas with no notable difference in prevalence over cycles.
Between Status Indians, or those who are Registered or Treaty Indians as defined by the Indian Act of Canada, and non-Status Indians, no significant differences in prevalence of hunting, fishing or trapping was seen from one cycle to another with the exception of 2006, when it was significantly higher among Status Indians (41%) than non-Status Indians (35%). In both groups, no upward or downward trend was evident. No significant differences across cycles or a trend was seen for gathering wild plants or berries.
Trends in potentially influential factors
Harvesting trends should be viewed in the context of changes to potentially influential factors including urbanization, engagement in the wage economy, socio-political environment, demographic changes to name a few.
Despite its youthful structure, the population of First Nations people living off reserve is somewhat aging (Chart 3). In fact, the proportion of those over the age of 55 has increased since 2001. However, the proportion of youth and young adults has remained somewhat invariant, while the proportion of 35-to-44-year-olds has significantly decreased. The median age of the 15-plus population increased from 35 years in 2001 to 39 years in 2017.

Data table for Chart 3
| Socioeconomic and demographic characteristics | 2001 | 2006 | 2012 | 2017 | ||||||||
|---|---|---|---|---|---|---|---|---|---|---|---|---|
| Percent | 95% confidence interval | Percent | 95% confidence interval | Percent | 95% confidence interval | Percent | 95% confidence interval | |||||
| Lower | Upper | Lower | Upper | Lower | Upper | Lower | Upper | |||||
| Age | ||||||||||||
| 15 to 24 years | 24 | 23 | 25 | 23 | 22 | 25 | 24 | 23 | 25 | 24 | 23 | 24 |
| 25 to 34 years | 22 | 21 | 24 | 19 | 18 | 20 | 18 | 17 | 19 | 18 | 17 | 20 |
| 35 to 44 years | 25 | 23 | 26 | 21 | 20 | 22 | 20 | 18 | 21 | 16 | 15 | 17 |
| 45 to 54 years | 16 | 15 | 17 | 19 | 18 | 20 | 18 | 16 | 19 | 19 | 18 | 20 |
| 55 to 64 years | 8 | 7 | 9 | 11 | 10 | 12 | 13 | 11 | 14 | 14 | 13 | 14 |
| 65 years or older |
5 | 4 | 6 | 7 | 6 | 8 | 8 | 7 | 9 | 9 | 9 | 10 |
| Median age of 15+ population (years) | 35 | 35 | 36 | 38 | 37 | 39 | 38 | 38 | 39 | 39 | 38 | 40 |
| Education | ||||||||||||
| Less than high school | 38 | 36 | 39 | 35 | 33 | 36 | 25 | 24 | 27 | 20 | 19 | 21 |
| High school | 14 | 13 | 16 | 15 | 14 | 16 | 15 | 14 | 17 | 16 | 15 | 18 |
| Post-secondary education below bachelor's level | 42 | 41 | 44 | 41 | 39 | 42 | 50 | 48 | 52 | 53 | 51 | 54 |
| University or higher |
5 | 5 | 6 | 10 | 9 | 11 | 10 | 9 | 11 | 11 | 10 | 12 |
| Labour force status | ||||||||||||
| Employment rate | 57 | 55 | 59 | 60 | 59 | 61 | 57 | 55 | 58 | 55 | 53 | 56 |
| Unemployment rate | 14 | 13 | 15 | 10 | 9 | 11 | 14 | 12 | 16 | 14 | 13 | 15 |
| Not in the labour force | 34 | 32 | 36 | 33 | 32 | 35 | 35 | 33 | 36 | 36 | 35 | 38 |
| Geography | ||||||||||||
| Urban | 76 | 75 | 77 | 76 | 74 | 77 | 80 | 79 | 82 | 77 | 76 | 78 |
| Rural | 23 | 22 | 24 | 24 | 22 | 25 | 19 | 18 | 21 | 23 | 22 | 24 |
| Sources: Statistics Canada, Aboriginal Peoples Survey, 2001, 2006, 2012 and 2017. | ||||||||||||
The off-reserve First Nations population is also making educational advancements. The proportion of those with less than a high school education has significantly decreased year over year (Chart 3). In parallel, the proportion of those with a post-secondary education has increased. Despite these trends, the employment rate has decreased, while the unemployment rate has not changed significantly. However, it is important to note that these rates are a snapshot in time and reflect the economic conditions at the time of the survey. Year-by-year analysis has previously show that there are significant fluctuations in rates over time among First Nations people living off reserve.Note 34 First Nations people living off reserve predominantly reside in urban areas (roughly 75%) (Chart 3). This has changed little over the last four cycles of the APS.
While examination of these characteristics suggests factors that may have potentially influenced the trends, it is important to note that the statistical associations between these characteristics and the trends in participation were not explored in this report.
First Nations people living off reserve harvest mainly for own use
In 2017, almost all First Nations people who had participated in hunting, fishing or trapping did so either for their own, or their own family’s use (85%) or for pleasure or leisure (81%). In interpreting the findings for pleasure or leisure, it is important to distinguish this from sport hunting, which is often associated with reasons of pleasure and leisure. For many First Nations people these activities provide a sense of identity, connection with the land, and an opportunity to spend time with community members, family or friends.Note 35Note 36 Roughly four in ten engaged in hunting, fishing or trapping to share with the community (40%) or for cultural reasons (37%). Far fewer (4%) did so for money or to supplement their income.
Almost all off-reserve First Nations people that had gathered wild plants or berries, did so for their own or own family’s use (92%), and about seven in ten (72%) for pleasure or leisure. About one half engaged in this activity to share the harvest with their community (50%) or for cultural reasons (49%). Four percent engaged in this activity for money or to supplement their income.
Why off-reserve First Nations people hunt, fish or trap varies by socioeconomic and demographic factors
Select reasons for hunting, fishing or trapping were examined by socioeconomic and demographic factors with the aim of uncovering findings that could inform tailored programs and policies. Also, specifically, it can identify those who are more likely to share their harvest with others in the community. These may have implications for nutrition and food security. It should be noted that the reasons are not mutually exclusive as individuals could report more than one reason for participating.
When it came to hunting, fishing or trapping for own use or own family’s use, the only difference was seen between age groups – youth and young adults (76%) were less likely to participate for this reason than working-age adults (86%) or older adults (89%) (Table 1). Hunting, fishing or trapping to share with others in the community was significantly more prevalent among unemployed First Nations people (58%) than those employed (37%) or out of the labour force (39%). This was also more likely among males (42%) than females (37%). Youth and young adults (32%) were less likely to hunt, fish or trap for cultural reasons than core working-age adults (39%) and older adults (40%). Unemployed individuals (48%) were more likely to participate for cultural reasons than those that were employed (36%) or out-of-the-labour-force (37%). Males (5%) were more than twice as likely as females (2%Note E : use with caution) to engage in this activity for money or to supplement income. Unemployed individuals (9%Note E : use with caution) were three times as likely as employed individuals (3%Note E : use with caution) to partake for this reason. Those living in rural areas (5%) were also more likely to report this reason than those in urban areas (3%). Some of these patterns were similar when examining gathering wild plants or berries for monetary reasons and cultural reasons (Table 1).
| Reasons for hunting, fishing or trapping in the previous 12 months | Reasons for gathering wild plants or berries in the previous 12 months | |||||||||||
|---|---|---|---|---|---|---|---|---|---|---|---|---|
| For pleasure or leisure | Own use/family’s use | To share with others in the community | For cultural reasons | For money or to supplement income | For some other reason | For pleasure or leisure | Own use/family’s use | To share with others in the community | For cultural reasons | For money or to supplement income | For some other reason | |
| percent | ||||||||||||
| Sex | ||||||||||||
| Males | 81 | 84 | 42Note * | 37 | 5Note * | 9 | 67Note * | 91 | 48 | 44Note * | 5Note * | 9 |
| Females (reference category) | 81 | 86 | 37 | 38 | 2Note E: Use with caution | 9 | 75 | 94 | 51 | 51 | 3Note E: Use with caution | 10 |
| Age group | ||||||||||||
| 15 to 24 years | 80 | 76Note * | 37 | 32Note * | 5Note E: Use with caution | 10 | 69 | 88 | 45 | 42Note * | 5Note E: Use with caution | 10 |
| 25 to 54 years (reference category) | 81 | 86 | 40 | 39 | 3Note E: Use with caution | 8 | 71 | 92 | 50 | 49 | 3Note E: Use with caution | 8 |
| 55 years or older | 81 | 89 | 44 | 40 | 5 | 10 | 74 | 96Note * | 54 | 51 | 3Note E: Use with caution | 11 |
| Labour force status | ||||||||||||
| Employed (reference category) | 84 | 84 | 37 | 36 | 3Note E: Use with caution | 8 | 72 | 92 | 50 | 49 | 3Note E: Use with caution | 9 |
| Unemployed | 72Note * | 84 | 58Note * | 48Note * | 9Note E: Use with cautionNote * | 11Note E: Use with caution | 69 | 92 | 55 | 54 | 8Note E: Use with cautionNote * | 12 |
| Out of the labour force | 77Note * | 87 | 39 | 37 | 5Note * | 8 | 71 | 94 | 49 | 47 | 4Note E: Use with caution | 9 |
| Place of residence | ||||||||||||
| Urban | 83Note * | 84 | 39 | 37 | 3Note * | 8 | 72 | 92 | 49 | 50 | 3 | 9 |
| Rural (reference category) | 77 | 86 | 41 | 38 | 5 | 10 | 70 | 94 | 51 | 45 | 4Note E: Use with caution | 10 |
E use with caution
Source: Statistics Canada, Aboriginal Peoples Survey, 2017. |
||||||||||||
Four in ten off-reserve First Nations people who harvest do it at least weekly during season
Knowledge of frequency of participation and the perception of adequacy of time spent, and their socioeconomic and demographic profiles, can also better inform policies and programs to support harvesting among off-reserve First Nations people.
Frequency of participation
In 2017, off-reserve First Nations people who had engaged in harvesting activities were asked how often they participated in these activities during harvesting season. About four in ten (39%) had hunted, fished or trapped at least once a week (“higher frequency”). Three in ten had participated at least once a month but less than once a week, and a similar proportion had participated less than once a month (32%). Patterns were similar for gathering wild plants or berries.
Older adults (49%) were significantly more likely to hunt, fish or trap at a higher frequency than youth and young adults and core working-age adults (36% each) (Table 2). Interestingly, unemployed (48%) and out-of-the-labour-force individuals (43%) were more likely to do so than employed (35%). Somewhat similar patterns also emerged for gathering wild plants or berries.
| Hunted, fished or trapped at least once a week during season | Gathered wild plants or berries at least once a week during season | |
|---|---|---|
| percent | ||
| Sex | ||
| Males | 43Note * | 43 |
| Females (reference category) | 33 | 45 |
| Age group | ||
| 15 to 24 years | 36 | 30Note * |
| 25 to 54 years (reference category) | 36 | 44 |
| 55 years or older | 49Note * | 54Note * |
| Labour force status | ||
| Employed (reference category) | 35 | 40 |
| Unemployed | 48Note * | 43 |
| Out of the labour force | 43Note * | 52Note * |
| Place of residence | ||
| Urban | 33Note * | 37Note * |
| Rural (reference category) | 50 | 59 |
Source: Statistics Canada, Aboriginal Peoples Survey, 2017. |
||
Six in ten off-reserve First Nations people who harvest would like to spend more time on this activity
In 2012, those who had engaged in these activities for money, to supplement their income, for own use or their family’s use, or to share with others in their own or other communities, were asked if they were satisfied with time spent on harvesting activities.
About six in ten (57%) wanted to spend more time on hunting, fishing or trapping (than they had in the past 12 months) and four in ten (42%) thought they were spending the right amount of time participating in these activities. Off-reserve First Nations men (61%) were more likely to want to spend more time on this activity than women (50%). So were core working-age adults (62%) when compared with youth and young adults (48%) or older adults (50%). The perception did not vary significantly by degree of rurality or between Status- and non-Status Indians.
When it came to gathering wild plants or berries, about six in ten (62%) thought they were spending the right amount of time on this activity and one in three (35%) expressed that they would like to spend more time participating in these activities. Socioeconomic and demographic patterns for gathering were similar to that for hunting, fishing or trapping.
When those who had wanted to spend more time were asked what reasons have prevented them from doing these activities more often, the leading reason, expressed by two-thirds, was not having enough time. About one in six (16%) said they did not have enough money for supplies or equipment. About one in eight said the location (12%) prevented them from hunting, fishing or trapping more often. Time barrier was more likely to be reported by working-age adults (74%) than youth and young adults (55%) or older adults (48%). This was also the case among employed (80%) when compared with unemployed (46%Note E : use with caution) or out-of-the-labour-force individuals (40%). A monetary barrier was cited by unemployed (33%Note E : use with caution) more than employed (13%Note E : use with caution) individuals. For the location barrier, youth and young adults (21%) were twice as likely as core working-age adults (10%Note E : use with caution) to identify this as a limitation. This was also the case for unemployed (22%Note E : use with caution) compared with employed individuals (9%Note E : use with caution).
For gathering wild plants or berries, the leading barriers to more frequent participation were time (66%) and location (19%). Core working-age adults (73%) were more likely than older adults (49%) to report time constraints. Employed (80%) as opposed to out-of-the-labour-force individuals (42%) were nearly twice as likely to cite this reason. Off-reserve First Nations people living in urban areas (24%) were nearly five times as likely to say location was a barrier as those in rural areas (5%Note E : use with caution).
Barriers to participation: Time and location constraints leading barriers to harvesting
In 2012, among off-reserve First Nations people who had not participated in hunting, fishing or trapping in the prior year, about four in ten (38%) expressed interest in participating. Men (49%) were more likely than women (32%) to acknowledge interest. Core working-age adults (42%) were more likely than youth and young adults (38%) and older adults (27%) to want to hunt, fish or trap. Unemployed individuals (47%) were more likely than employed (39%) or out-of-the-labour-force individuals (34%) to express interest. Status Indians (40%) were more likely than non-Status Indians (34%) to be interested in participating. The leading reason for not participating was not having enough time (41%) followed by location (28%) (Chart 4). About one in seven reported not having enough money, having no one to do it with or other reasons.

Data table for Chart 4
| Reasons for non-participation | Percent | 95% confidence interval | |
|---|---|---|---|
| Lower | Upper | ||
| Not enough time | 41 | 36 | 45 |
| Location | 28 | 25 | 32 |
| Not enough money for equipment or supplies |
15 | 12 | 17 |
| No one to hunt, fish or trap with | 13 | 11 | 16 |
| Physical disability | 9 | 5 | 14 |
| Quota restrictions | 2 | 1 | 4 |
| Fewer animals | Note F: too unreliable to be published | Note F: too unreliable to be published | Note F: too unreliable to be published |
| Other | 16 | 13 | 19 |
|
F too unreliable to be published Note: Percentages are computed using the number of people who were interested but did not participate in the described activity in the previous year as the denominator. Source: Statistics Canada, Aboriginal Peoples Survey, 2012. |
|||
One in four off-reserve First Nations people who had not gathered wild plants or berries in the previous year wanted to engage in these activities. Women (29%) were more likely than men (20%) to express this interest. Core working-age adults (28%) were more likely than youth and young adults (20%) and older adults (22%) to want to do this activity. Unemployed off-reserve First Nations people (30%) were more likely than employed (24%) or those in not the labour force (24%) to report this. Those in female lone-parent households (31%) were more likely to want to gather than those in couple-headed households with children (23%) or male lone-parent households (21%Note E : use with caution). Status Indians (27%) were more likely than non-Status Indians (19%) to want to gather. The leading reason for not having gathered wild plants or berries despite an interest was not having enough time (41%). About three in ten (29%) cited location while one in five (21%) cited having no one to teach the skills needed. Other reasons were significantly less prevalent (10% or less).
To add to the picture on harvesting barriers among off-reserve First Nations people, the reasons for not participating were examined by select socioeconomic and demographic factors (Table 3). Among the age groups, youth and young adults (42%) and working-age adults (44%) were more likely than older adults (28%Note E : use with caution) to cite time barriers. Monetary barriers were less prevalent among older adults (7%Note E : use with caution) than core working-age adults (15%). Youth and young adults (21%) were more likely to indicate they had no one to hunt, fish or trap with than other age groups (about one in ten).
| Reasons for not having hunted, fished or trapped | Reasons for not having gathered wild plants or berries | ||||||||||||||
|---|---|---|---|---|---|---|---|---|---|---|---|---|---|---|---|
| Not enough time | Location | Not enough money for supplies or equipment | No one to do it with | Physical disability | Fewer animals | Quota restrictions | Other | Not enough time | Location | No one to teach needed skills | Physical disability, health or medical reasons | Not enough money for supplies or equipment | Fewer plants/berries to harvest | Other | |
| percent | |||||||||||||||
| Sex | |||||||||||||||
| Males | 44 | 26 | 13 | 12 | 8Note E: Use with caution | Note F: too unreliable to be published | Note F: too unreliable to be published | 15 | 46 | 27 | 16Note E: Use with caution | 7Note E: Use with caution | 3Note E: Use with caution | Note F: too unreliable to be published | 9Note E: Use with caution |
| Females (reference category) | 38 | 30 | 16 | 14 | 9Note E: Use with caution | Note F: too unreliable to be published | Note F: too unreliable to be published | 16Note E: Use with caution | 38 | 30 | 23 | 8Note E: Use with caution | 4Note E: Use with caution | 7Note E: Use with caution | 10Note E: Use with caution |
| Age group | |||||||||||||||
| 15 to 24 years | 42 | 26 | 19 | 21Note * | Note F: too unreliable to be published | Note F: too unreliable to be published | Note F: too unreliable to be published | 16 | 42 | 28 | 24 | Note F: too unreliable to be published | Note F: too unreliable to be published | 7Note E: Use with caution | 8Note E: Use with caution |
| 25 to 54 years (reference category) | 44 | 31 | 15 | 11 | 7Note E: Use with caution | Note F: too unreliable to be published | 2Note E: Use with caution | 15 | 44 | 31 | 22 | 4Note E: Use with caution | 4Note E: Use with caution | 7Note E: Use with caution | 10Note E: Use with caution |
| 55 years or older | 28Note E: Use with cautionNote * | 20Note E: Use with cautionNote * | 7Note E: Use with cautionNote * | 11Note E: Use with caution | 25Note E: Use with cautionNote * | Note F: too unreliable to be published | Note F: too unreliable to be published | Note F: too unreliable to be published | 29Note E: Use with cautionNote * | 26Note E: Use with caution | 13Note E: Use with cautionNote * | 26Note E: Use with cautionNote * | Note F: too unreliable to be published | Note F: too unreliable to be published | 11Note E: Use with caution |
| Labour force status | |||||||||||||||
| Employed (reference category) | 54 | 26 | 13 | 11 | Note F: too unreliable to be published | Note F: too unreliable to be published | Note F: too unreliable to be published | 15 | 53 | 24 | 19 | 2Note E: Use with caution | Note F: too unreliable to be published | 6Note E: Use with caution | 10Note E: Use with caution |
| Unemployed | 27Note E: Use with cautionNote * | 39Note * | 22Note E: Use with cautionNote * | 21Note E: Use with cautionNote * | Note F: too unreliable to be published | Note F: too unreliable to be published | Note F: too unreliable to be published | 11Note E: Use with caution | 23Note E: Use with cautionNote * | 39Note E: Use with cautionNote * | 36Note E: Use with cautionNote * | Note F: too unreliable to be published | Note F: too unreliable to be published | Note F: too unreliable to be published | Note F: too unreliable to be published |
| Out of the labour force | 23Note * | 28 | 15 | 14 | 20Note E: Use with caution | Note F: too unreliable to be published | Note F: too unreliable to be published | 19Note E: Use with caution | 27Note * | 34Note * | 19 | 17Note E: Use with cautionNote * | 2Note E: Use with caution | 6Note E: Use with caution | 10 |
| Place of residence | |||||||||||||||
| Urban | 39 | 32Note * | 16Note * | 14 | 8Note E: Use with caution | Note F: too unreliable to be published | Note F: too unreliable to be published | 14 | 40 | 31Note * | 22 | 7Note E: Use with caution | 4Note E: Use with caution | 6Note E: Use with caution | 9 |
| Rural (reference category) | 49 | 7Note E: Use with caution | 6Note E: Use with caution | 10Note E: Use with caution | 11Note E: Use with caution | Note F: too unreliable to be published | Note F: too unreliable to be published | 24Note E: Use with caution | 47 | 17Note E: Use with caution | 17Note E: Use with caution | 9Note E: Use with caution | Note F: too unreliable to be published | Note F: too unreliable to be published | 12Note E: Use with caution |
|
E use with caution F too unreliable to be published
Source: Statistics Canada, Aboriginal Peoples Survey, 2012. |
|||||||||||||||
Working-age adults (31%) were more likely than older adults (20%Note E : use with caution) to identify location as barrier. For gathering wild plants or berries, the predominant reason was not having enough time (41%). About three in ten (29%) reported location as a barrier to gathering. Other reasons were reported by one in ten or less. Core working-age adults (44%) were more likely than older adults (29%Note E : use with caution) to cite time as a barrier to gathering (Table 3). Not having someone to teach the skills needed was more likely to be identified as a barrier by youth and young adults (24%) and working-age adults (22%) than older adults (13%Note E : use with caution). Older adults (26%Note E : use with caution) were several times more likely to cite poor health or disability as a barrier than working-age adults (4%Note E : use with caution).
Given that the off-reserve First Nations population is mostly urban, the reasons for non-participation were broken down by place of residence – urban and rural. Significant differences in monetary and location barriers emerged between those living in urban and rural areas (Table 3). As expected, location was more frequently cited among urban off-reserve First Nations people (32%) as a barrier to hunting, fishing or trapping than those living in rural areas (7%Note E : use with caution). Urban dwellers (16%) were more likely to cite monetary reasons for not hunting, fishing or trapping than rural dwellers (6%Note E : use with caution).
Do employed, unemployed and out-of-the-labour-force individuals face different challenges to participating in hunting, fishing or trapping? As expected, employed off-reserve First Nations people (54%) were more likely to face time constraints than unemployed (27%Note E : use with caution) or out-of-the-labour-force people (23%) (Table 3). Unemployed people (22%Note E : use with caution) were more likely to cite not having enough money for equipment or supplies as the reason for not hunting, fishing or trapping than those employed (13%) or out of the labour force (15%). Interestingly, unemployed people (21%Note E : use with caution) were nearly twice as likely to report not having someone to hunt, fish or trap with as a barrier as employed people (11%). A similar trend for those citing location as a barrier was evident (39% for unemployed and 26% for employed). For gathering wild plants or berries, as with hunting, fishing or trapping, employed (53%) individuals were more likely than the unemployed (23%Note E : use with caution) or out-of-the-labour-force individuals (27%) to say time constraints prevented them from taking part in these activities.
When examining family type, female lone-parent families (22%) were significantly more likely to report monetary reasons for not hunting, fishing or trapping than couple-headed families with (13%) or without children (8%Note E : use with caution) (Table 3). They were also more likely to cite not having anyone to do it with (21%) when compared couple-headed families without (7%Note E : use with caution) and with children (14%Note E : use with caution).
Factors associated with participation in harvesting activities among First Nations people living off reserve: household income and remoteness matter among other factors
Examining socioeconomic and demographic characteristics of those who had and had not participated in harvesting activities offers insight into factors that are correlated with participation. However, it is important to examine associations of each of these factors with participation in the context of other factors. For example, participation varied by age group, and it could be suggested that age is a factor for participation. Yet, it is important to investigate if age would remain a factor after accounting for health and household income, for example. To this end, multivariate analysis was carried out using the 2017 APS. This enables an examination of the association of each factor while simultaneously accounting for other factors that could also be associated. Factors included in this analysis were remoteness, the individual’s sex, age group, health, household income (quintiles of household income after tax, adjusted for household size), labour force status, household type and sense of belonging to First Nations culture and activities. These factors were chosen based on previous findings related to harvesting activities among First Nations people, Métis and Inuit and bivariate analysis (data not shown). Other factors, while important, could not be explored here due to data limitations. These include levels of transmission of traditional knowledge, awareness of hunting rights of First Nations people, and changes to policies related to harvesting. Since education and labour force status were considered in this analysis as potential factors, the analysis was restricted to those 25 years or older.
In 2017, after adjusting for other factors, as expected, remoteness of the place of residence was significantly associated with the likelihood of participation. The remoteness index used here is based on proximity to and the size of the population (or service) agglomerations.Note 37 A one unit increase in remoteness was associated with a 3% increase in odds of having hunted, fished or trapped after adjusting for other factors (Table 4). For example, an off-reserve First Nations person living in Edmonton was predicted to be 31% likely to have hunted, fished or trapped. In comparison, in Sioux Lookout, Ontario it was 52%, while in Norman Wells, Northwest Territories, it was 70%.
Sex and age were significantly associated with hunting, fishing or trapping. Off-reserve First Nations men were predicted to be 1.6 times more likely to participate compared with women (Table 4). Older adults were less likely to hunt, fish or trap than core working-age adults. Self-rated health was not significantly associated with participation.
| Predicted marginal (or odds ratioTable 4 Note 1) | 95% confidence interval | Risk ratioTable 4 Note 3 | ||
|---|---|---|---|---|
| Lower | Upper | |||
| Remoteness indexTable 4 Note 1 | 1.03Note * | 1.02 | 1.03 | Note ...: not applicable |
| percent | ratio | |||
| Sex | ||||
| Male | 45 | 42 | 49 | 1.56Note * |
| Female (reference category) | 29 | 27 | 31 | 1.00 |
| Adjusted after-tax household income quintilesTable 4 Note 2 | ||||
| Quintile 1 (poorest) | 27 | 22 | 34 | 0.65Note * |
| Quintile 2 | 30 | 26 | 35 | 0.72Note * |
| Quintile 3 | 35 | 32 | 39 | 0.83Note * |
| Quintile 4 | 39 | 36 | 43 | 0.93 |
| Quintile 5 (richest) (reference category) | 42 | 38 | 46 | 1.00 |
| Labour force status | ||||
| Employed (reference category) | 37 | 35 | 40 | 1.00 |
| Unemployed | 36 | 29 | 44 | 0.97 |
| Out of the labour force | 34 | 30 | 38 | 0.91 |
| Age group | ||||
| Working age adults (25-54 years) (reference category) | 38 | 35 | 41 | 1.00 |
| Older adults (55 years or older) | 31 | 28 | 34 | 0.81Note * |
| Health | ||||
| Excellent, very good or good | 37 | 35 | 39 | 1.09 |
| Fair or poor (reference category) | 34 | 30 | 38 | 1.00 |
| Household type | ||||
| Couple-headed family (reference category) | 38 | 36 | 40 | 1.00 |
| Male lone-parent family | 32 | 24 | 41 | 0.84 |
| Female lone-parent family | 29 | 24 | 34 | 0.76Note * |
| Spent time finding out more about First Nations history, traditions and culture |
||||
| Strongly agree | 38 | 35 | 42 | 1.42 |
| Agree | 37 | 34 | 39 | 1.36 |
| Neither agree nor disagree | 38 | 29 | 47 | 1.39 |
| Disagree | 31 | 27 | 36 | 1.15 |
| Strongly disagree (reference category) | 27 | 18 | 38 | 1.00 |
| Active in First Nations organizations, social events or cultural activities |
||||
| Strongly agree | 45 | 40 | 51 | 1.49Note * |
| Agree | 42 | 38 | 45 | 1.37Note * |
| Neither agree nor disagree | 36 | 29 | 43 | 1.17 |
| Disagree | 31 | 28 | 34 | 1.00 |
| Strongly disagree (reference category) | 30 | 25 | 37 | 1.00 |
... not applicable
|
||||
Harvesting activities, and hunting specifically, is an expensive endeavour. The high price of vehicles, equipment and gas impact First Nations peoples’, and in particular women’s, ability to engage in this activity.Note 29 Household income was significantly associated with the likelihood of having hunted, fished or trapped. The likelihood increased with increasing household income (Table 4). Compared to those in the richest income quintile, those in the poorest quintile were 35% (risk ratio=0.65) less likely to hunt, fish or trap. Those in the third quintile were 17% (risk ratio=0.83) less likely to participate compared with those in the richest. However, the likelihood was not significantly different between the fourth and fifth quintiles.
Labour force status was not significantly associated with the likelihood of participating in hunting, fishing or trapping. In initial models of the multivariate analysis, before the inclusion of household type, out-of-the-labour-force individuals were less likely than employed individuals to hunt, fish or trap (appendix Table A.1).
Household type or composition may influence the likelihood of participation in harvesting activities. Previous studies have suggested that children in lone-parent families were less likely to participate in hunting or fishing than those in couple-headed families.Note 38 Previously, among female heads of households in two First Nations communities, the odds of harvesting was significantly lower compared with their male counterparts.Note 3 In the current analysis, a similar finding emerged (Table 1). Those in female lone-parent households were less likely than those in couple-headed households (reference category) to engage in hunting, fishing or trapping.
Sense of belonging to First Nations culture and identity was assessed using several questions in the 2017 APS. Two measures of sense of belonging were examined in this analysis, namely having spent time trying to find out more about First Nations history, traditions, and culture; and being active in First Nations organizations, social events or cultural activities. The former was not associated with hunting, fishing or trapping while the latter was. Participation in hunting, fishing or trapping appeared to increase with being active in First Nations organizations, social events or cultural activities.
In another multivariate analysis, the association between socioeconomic and demographic factors and participation in gathering wild plants or berries among First Nations people living off reserve was examined (data not shown). As with hunting, fishing or trapping, remoteness of place of residence was associated with gathering. In contrast to hunting, fishing or trapping, men were less likely to participate than women. Also, age group and household income were not associated unlike that seen for hunting, fishing or trapping. Interestingly, off-reserve First Nations people who were unemployed were more likely to gather than those employed. Family type was associated with gathering wild plants or berries. Those in lone-parent households were less likely than couple-headed families to engage in gathering. Finally, those who were active in First Nations people organizations, social events or cultural activities, and those who had spent time trying to find out more about First Nations history, traditions and culture were more likely to gather wild plants or berries than their counterparts.
Discussion
Based on four cycles of APS data, the prevalence of hunting, fishing or trapping among off-reserve First Nations people showed a 10% decline between 2006 and 2017. While no significant downward or upward trend was seen in any age group, among youth and young adults, prevalence in 2017 was lower than in 2006 and 2012. Previously, among First Nations adults living on reserve across Canada, a decline of 43% for hunting and trapping and 33% for fishingNote 33 was observed from 2002/03 to 2015/16. The demographic and socioeconomic characteristics of the off-reserve First Nations population from each of the APS cycles provide some potential reasons for the decrease in prevalence of hunting, fishing or trapping in 2017. While no notable changes in proportion of urban dwellers was evident, there was an increase in education levels particularly post-secondary education below a bachelor’s level. It is possible that school attendance may have imposed time constraints resulting in less time to devote to harvesting, as has been seen among their on-reserve counterparts, particularly young adults.Note 3 It should be noted that higher levels of education completion may facilitate and hinder participation in harvesting activities. Higher levels of education is associated with being employed, which provides the financial means to harvest, but limits the time available for this activity. Other factors could also be implicated. The demands of family life, lack of interest and rising costs of hunting, fishing or trapping have been previously identified.Note 3
The self-reported barriers among youth and young adults add to the findings from the socioeconomic and demographic profile. The leading reasons for non-participation in this group were: not having enough time, location, no one to do it with and not having enough money for equipment or supplies. Previously among 20-to-39-year-old individuals, including First Nations people living in two reserve communities, not having enough time due to employment, lack of knowledge or interest and cost were the leading barriers to harvesting.Note 3 In the current analysis, the barriers of location and not having someone to partake in this activity are not unexpected given that these were reported by those living off reserve. Finding others who are interested and with harvesting skills and knowledge may be limited in urban areas where most off-reserve First Nations people live. However, many off-reserve First Nations people sometimes harvest on reserve in their communities.Note 39 Importantly, the common barriers of time and expense allude to their pervasiveness among First Nations people living on and off reserve.
While financial costs were not a leading barrier, it was more likely to be cited by the unemployed (compared with employed) and those in female lone-parent households (compared with couple-headed households). This is supported by the multivariate findings. Household income was significantly associated with hunting, fishing or trapping.
These results together provide some understanding of how the pressures of the wage economy and education, inadequate financial resources and family responsibilities intersect and could potentially affect participation in harvesting activities among First Nations people living off reserve.
Location was the second leading concern among First Nations people living off reserve. Harvesting areas may be located at a considerable distance away from urban areas. This is supported by the findings that location was about five times more likely to be reported as a barrier among those living in urban areas than rural areas.
The multivariate findings also suggest potential facilitators, or factors that are associated with increased participation. Specifically, being active in First Nations organizations, social events or cultural activities. The likelihood of participation increased with engagement in the above activities.
It should be noted that other previously-identified barriers could not be explored in this paper due to data limitations. The lack of or inadequate knowledge has been identified as a barrierNote 40 among First Nations people living on reserve. This could be a barrier among those living off reserve as well. However, data on this was not collected in the APS. Data on barriers relating to school attendance, and childcare responsibilities, which have been previously identified,Note 3 was also not collected.
These findings could inform tailored programs to reduce barriers and increase participation in harvesting activities among First Nations people living off reserve. Among youth and young adults, in addition to the leading barrier of time, factors such as location, having no one to harvest with and money were also identified. Organized harvesting activities or community hunts, similar to those that occur in many First Nations reserves,Note 41Note 42 could address some of these barriers off reserve as well. On many reserves, community hunts are also important for nutrition, knowledge transmission and decreasing inequities in availability of country food among elders, single mothers and others in need.Note 42Note 43 They may have similar benefits among First Nations people living off reserve. Findings on sociodemographic characteristics of non-participants who expressed interest in participation could inform tailored initiatives. For example, unemployed individuals were likely that employed or out-of-the-labour-force individuals to express interest in harvesting activities.
Harvesting activities among Métis
To date, there has been limited research on harvesting activities among Métis. Historically, Métis have engaged in hunting, fishing and trapping, and played a prominent role in the fur trade beginning in the latter half of the 1700s.Note 44Note 45 The semi-annual, large-scale Métis buffalo hunts in the 19th century are a part of Métis history and has been documented extensively.Note 44Note 46 To many Métis, harvesting activities are an integral part of Métis way of life and identity. In fact, hunting, fishing or trapping has been suggested to be one of the historical factors that impacted Métis identity.Note 47 Métis continue to engage in harvesting activities today. In 2006, fishing was found to be the most prevalent harvesting activity among Métis followed by gathering wild plants and hunting.Note 11 However, there is little other research on contemporary Métis harvesting activities or long-term trends in harvesting activities.
The challenges to participation in harvesting activities faced by Métis have not been explored sufficiently in previous literature with the exception of the social and political barriers.Note 46Note 48Note 49 For example, Métis were often stripped of hunting and trapping rights.Note 46 It is also expected that the pressures of the wage economy, socio-demographic changes and the impacts of residential school affect participation in harvesting activities. Several Métis children attended church-run boarding schools or other residences funded by the federal or provincial governments in the 20th century.Note 46 Residential school attendance has been associated with several negative health outcomes among Métis,Note 22 both directly and indirectly through socio-economic and community level factors.Note 23
This section explores trends in participation in hunting, fishing or trapping and gathering wild plants or berries using four cycles of the Aboriginal People Survey. It also examines factors associated with participation, and reasons for participation and non-participation among Métis aged 15 years or older.
A potential declining trend in hunting, fishing or trapping among Métis youth and young adults
Studies of trends in harvesting activities among Métis are few. In 2015, the Ministry of Environment and Natural Resources, Government of Northwest Territories published trends in hunting and fishing among Dene/Métis in the territory. These suggested that prevalence of hunting or fishing for subsistence had changed little from 1983 to 1993 (about 30%).Note 50 Trends including estimates for more recent years have yet to be published. In this section, using the 2001, 2006, 2012 and 2017 APS cycles, trends in participation in harvesting activities among Métis are examined.
Among Métis aged 15 or older, the prevalence of hunting, fishing or trapping was lower in 2012 and 2017 than in 2001 and 2006. The prevalence in 2017 (35%) represented a 19% decrease compared with the 2006 level (44%). However, the prevalence in the latest two cycles (2012 and 2017) were not significantly different from each other. No significant changes in prevalence was seen for gathering wild plants or berries over the four cycles (data not shown).
Among the three age groups, the prevalence of hunting, fishing or trapping was consistently lower among those 55 years or older (older adults) compared to the others (Chart 5). Among youth and young adults (aged 15 to 24), a significant downward trend was apparent after 2006. Prevalence decreased from 46% in 2006 to 38% in 2012 and 33% in 2017. However, when compared with 2001 levels, no downward trend was observed.
Data table for Chart 5
| Age group | 2001 | 2006 | 2012 | 2017 | ||||||||
|---|---|---|---|---|---|---|---|---|---|---|---|---|
| Percent | 95% confidence interval | Percent | 95% confidence interval | Percent | 95% confidence interval | Percent | 95% confidence interval | |||||
| Lower | Upper | Lower | Upper | Lower | Upper | Lower | Upper | |||||
| 15 to 24 years | 40 | 37 | 43 | 46 | 44 | 49 | 38 | 35 | 42 | 33 | 31 | 36 |
| 25 to 54 years | 43 | 42 | 45 | 46 | 44 | 47 | 39 | 36 | 41 | 39 | 37 | 41 |
| 55 years or older | 32 | 28 | 36 | 34 | 31 | 37 | 29 | 26 | 33 | 30 | 29 | 32 |
| Sources: Statistics Canada, Aboriginal Peoples Survey, 2001, 2006, 2012 and 2017. | ||||||||||||
Youth and young adults were less likely to have participated in the gathering of wild plants or berries over most cycles when compared to other age groups (Chart 6). Little variation between cycles was seen in any age group.

Data table for Chart 6
| Age group | 2001 | 2006 | 2012 | 2017 | ||||||||
|---|---|---|---|---|---|---|---|---|---|---|---|---|
| Percent | 95% confidence interval | Percent | 95% confidence interval | Percent | 95% confidence interval | Percent | 95% confidence interval | |||||
| Lower | Upper | Lower | Upper | Lower | Upper | Lower | Upper | |||||
| 15 to 24 years | 20 | 17 | 22 | 25 | 23 | 27 | 20 | 17 | 22 | 19 | 17 | 21 |
| 25 to 54 years | 30 | 29 | 32 | 32 | 31 | 34 | 30 | 28 | 33 | 28 | 27 | 30 |
| 55 years or older | 32 | 29 | 36 | 26 | 24 | 29 | 33 | 29 | 37 | 30 | 28 | 32 |
| Sources: Statistics Canada, Aboriginal Peoples Survey, 2001, 2006, 2012 and 2017. | ||||||||||||
Males were consistently more likely to hunt, fish or trap than females, however both males and females exhibited similar trends over time (data not shown). Prevalence of gathering wild plants or berries was not significantly different across cycles. And, the trends in both sexes remained relatively unchanged across cycles. While the prevalence of gathering wild plants or berries was higher among Métis women compared with men in some cycles, in others, no significant differences emerged.
Métis in rural areas were consistently more likely to hunt, fish or trap and gather wild plants or berries than those in urban areas. Prevalence of hunting, fishing or trapping in urban areas in 2012 and 2017, while not significantly different from rural areas, was lower in 2006 (data not shown). Regarding gathering of wild plants or berries, no significant differences across cycles were evident.
Trends in potentially influencing factors
Changes in factors such as urbanization, engagement in the wage economy, socio-political environment, demographic changes may have influenced the trends in harvesting activities, and harvesting trends should be examined in the context of these changes.
Despite its youthful structure, the Métis population has been getting somewhat older. This is clearly evident with the increase in median age of the Métis population (Chart 7). Among those aged 15 years or older, the median age increased from 36 to 42 years from 2006 to 2017. And, the proportions of 15-to-24-year-olds, 25-to-34-year-olds and 35-to-44-year olds decreased, and the proportion of adults 55 years or older increased.
Data table for Chart 7
| Socioeconomic and demographic characteristics | 2001 | 2006 | 2012 | 2017 | ||||||||
|---|---|---|---|---|---|---|---|---|---|---|---|---|
| Percent | 95% confidence interval | Percent | 95% confidence interval | Percent | 95% confidence interval | Percent | 95% confidence interval | |||||
| Lower | Upper | Lower | Upper | Lower | Upper | Lower | Upper | |||||
| Age | ||||||||||||
| 15 to 24 years | 26 | 24 | 27 | 22 | 21 | 24 | 22 | 21 | 24 | 20 | 20 | 21 |
| 25 to 34 years | 21 | 19 | 22 | 19 | 18 | 20 | 18 | 17 | 19 | 17 | 16 | 19 |
| 35 to 44 years | 23 | 22 | 24 | 21 | 20 | 22 | 17 | 16 | 18 | 16 | 15 | 17 |
| 45 to 54 years | 17 | 16 | 18 | 19 | 18 | 20 | 19 | 18 | 21 | 19 | 18 | 20 |
| 55 to 64 years | 9 | 8 | 10 | 11 | 10 | 12 | 14 | 13 | 15 | 17 | 16 | 17 |
| 65 years or older |
5 | 5 | 6 | 7 | 6 | 8 | 9 | 8 | 10 | 11 | 11 | 12 |
| Median age of 15+ population (years) | 36 | 35 | 36 | 38 | 38 | 39 | 39 | 39 | 40 | 42 | 41 | 43 |
| Education | ||||||||||||
| Less than high school | 34 | 33 | 36 | 29 | 28 | 30 | 21 | 20 | 23 | 15 | 14 | 16 |
| High school | 16 | 15 | 17 | 16 | 15 | 17 | 18 | 16 | 19 | 16 | 15 | 17 |
| Post-secondary education below bachelor's level | 44 | 43 | 46 | 45 | 43 | 46 | 50 | 48 | 52 | 56 | 55 | 57 |
| University or higher |
6 | 5 | 6 | 10 | 9 | 11 | 11 | 10 | 12 | 13 | 11 | 14 |
| Labour force status | ||||||||||||
| Employment rate | 64 | 62 | 65 | 67 | 66 | 69 | 64 | 62 | 66 | 64 | 63 | 65 |
| Unemployment rate | 12 | 11 | 13 | 8 | 7 | 9 | 10 | 8 | 12 | 9 | 8 | 10 |
| Not in the labour force | 28 | 26 | 29 | 27 | 26 | 28 | 29 | 28 | 31 | 30 | 29 | 31 |
| Geography | ||||||||||||
| Urban | 70 | 69 | 71 | 71 | 70 | 73 | 74 | 73 | 76 | 72 | 71 | 73 |
| Rural | 29 | 28 | 30 | 28 | 27 | 30 | 26 | 24 | 27 | 28 | 27 | 29 |
| Sources: Statistics Canada, Aboriginal Peoples Survey, 2001, 2006, 2012 and 2017. | ||||||||||||
The education profile of the Métis population has been steadily improving as seen by the decreasing proportions of those with less than a high school education, and increasing proportions of those with post-secondary education (Chart 7). The labour market profile has changed somewhat over the cycles. The employment rate remained relatively unchanged, but the unemployment rate decreased after 2001 but increased in 2012. The proportion of those not in the labour force increased after 2006 and remained unchanged in the subsequent two cycles. However, it is important to note that these rates are a snapshot in time and reflect the economic conditions at the time of the survey. Year-by-year analysis has previously show that there are significant fluctuations in rates over time among Métis.Note 34 In terms of place of residence, the Métis population has remained predominantly urban (roughly 70%) with little variability. While examination of these characteristics suggests factors that may have influenced the trends, it is important to note that the statistical associations between these characteristics and the trends in participation were not explored in this report.
Métis primarily participate in harvesting for own use
Self-reported reasons for participation and non-participation in harvesting activities was examined to better understand the facilitators and barriers to harvesting activities among Métis. Almost all Métis who hunted, fished or trapped did so for pleasure or leisure (90%) or for own or own family’s use (84%). It should be recognized that for many Métis, engagement in harvesting activities is part of their identity and provides opportunities to commune with family and community.Note 36 In interpreting the findings for pleasure or leisure, it is important to distinguish this from sport hunting, which is often associated with reasons of pleasure and leisure. Three in ten (30%) had engaged in this activity to share the harvest with the community. About one in four (23%) had done it for cultural reasons. Three percent had done it for money or supplement their income.
Almost all Métis who had gathered wild plants or berries did so for own use or own family’s use (95%), while three fourths did so for pleasure or leisure (78%). About four in ten (44%) participated to share with the community and one in three for cultural reasons (33%). Lastly, four percent gathered wild plants or berries for monetary reasons.
Why Métis hunt, fish or trap varies by socioeconomic and demographic factors
Reasons for harvesting are expected to vary by socioeconomic and demographic factors, and could inform tailored programs and policies to support harvesting. Also, specifically, it can identify Métis who are more likely to share their harvest with others in the community. This may have implications for nutrition and food security. With this in mind, self-reported reasons were broken down by socioeconomic and demographic factors using data from the 2017 APS.
Youth and young adults (77%) were less likely to hunt, fish or trap for own use or own family’s use than core working-age adults (85%) or older adults (88%) (Table 5). Those in rural areas (89%) were more likely to participate for this reason compared with those in urban areas (81%). Unemployed Métis (40%) were more likely to hunt, fish or trap to share with others in the community than employed Métis (28%). Those in rural areas (35%) were also more likely to report this reason than those in urban areas (27%). Youth and young adults (15%) were less likely than working-age adults (24%) and older adults (26%) to hunt, fish or trap for cultural reasons. Those in rural areas (27%) were more likely to do so than those in urban areas (20%). Métis males (3%) were three times as likely to hunt, fish or trap for money or to supplement income as females (1%Note E : use with caution). Unemployed individuals (7%Note E : use with caution) were also more likely to engage in these activities for the same reason than employed (2%Note E : use with caution) or out-of-the-labour-force individuals (3%Note E : use with caution). This trend was also observed between Métis in rural areas (5%Note E : use with caution) compared with those in urban areas (1%Note E : use with caution). Such patterns did not always emerge for gathering wild plants or berries.
| Reasons for hunting, fishing or trapping in the previous 12 months | Reasons for gathering wild plants or berries in the previous 12 months | |||||||||||
|---|---|---|---|---|---|---|---|---|---|---|---|---|
| For pleasure or leisure | Own use/family’s use | To share with others in the community | For cultural reasons | For money or to supplement income | For some other reason | For pleasure or leisure | Own use/family’s use | To share with others in the community | For cultural reasons | For money or to supplement income | For some other reason | |
| percent | ||||||||||||
| Sex | ||||||||||||
| Males | 91 | 85 | 33Note * | 24 | 3Note * | 9 | 75Note * | 94 | 45 | 34 | 4Note E: Use with caution | 9 |
| Females (reference category) | 89 | 82 | 25 | 21 | 1Note E: Use with caution | 8 | 81 | 95 | 44 | 32 | 4 | 11 |
| Age group | ||||||||||||
| 15 to 24 years | 90 | 77Note * | 29 | 15Note * | 2Note E: Use with caution | 9 | 81 | 92 | 47 | 21Note * | 3Note E: Use with caution | 13Note E: Use with caution |
| 25 to 54 years (reference category) | 90 | 85 | 28 | 24 | 3Note E: Use with caution | 8 | 79 | 95 | 44 | 34 | 3Note E: Use with caution | 8 |
| 55 years or older | 90 | 88 | 34Note * | 26 | 4Note E: Use with caution | 9 | 75 | 96 | 43 | 36 | 4Note E: Use with caution | 12Note * |
| Labour force status | ||||||||||||
| Employed (reference category) | 91 | 84 | 28 | 23 | 2Note E: Use with caution | 9 | 79 | 95 | 44 | 32 | 3Note E: Use with caution | 9 |
| Unemployed | 82Note * | 81 | 40Note * | 26 | 7Note E: Use with cautionNote * | Note F: too unreliable to be published | 71 | 98Note * | 52 | 33 | Note F: too unreliable to be published | 9Note E: Use with caution |
| Out of the labour force | 88 | 84 | 32 | 21 | 3Note E: Use with caution | 6Note * | 77 | 95 | 44 | 35 | 5Note E: Use with cautionNote * | 12 |
| Place of residence | ||||||||||||
| Urban | 91Note * | 81Note * | 27Note * | 20Note * | 1Note E: Use with cautionNote * | 9 | 80Note * | 94 | 44 | 33 | 2Note E: Use with cautionNote * | 12Note * |
| Rural (reference category) | 88 | 89 | 35 | 27 | 5Note E: Use with caution | 8 | 75 | 96 | 45 | 33 | 6 | 8 |
|
E use with caution F too unreliable to be published
Source: Statistics Canada, Aboriginal Peoples Survey, 2017. |
||||||||||||
Among Métis harvesters, four in ten hunt, fish or trap at least weekly during season
Insight into the frequency of participation, including the desire for more frequent participation for some, and their socioeconomic and demographic profiles, can help further inform policies and programs to support harvesting among Métis.
Frequency of participation
In 2012, Métis who harvested were asked how often they participated in these activities during harvesting season. About four in ten (42%) who had hunted, fished or trapped, reported that they had participated at least once a week (“higher frequency”). About one in three participated at least once a month but less than once a week (29%) or less than once a month (30%). Males (46%) were more likely to hunt, fish or trap at a higher frequency than females (33%) (Table 6). Older adults (52%) were significantly more likely to do this than youth and young adults (35%) or core working-age adults (40%). As expected, the prevalence of higher frequency participation among those in rural areas (51%) was significantly higher than those in urban areas (35%). The overall trends for frequency of gathering wild plants or berries were similar to that for hunting, fishing or trapping. However, no differences for higher frequency gathering were evident by sex.
| Hunted, fished or trapped at least once a week during season | Gathered wild plants or berries at least once a week during season | |
|---|---|---|
| percent | ||
| Sex | ||
| Males | 46Note * | 44 |
| Females (reference category) | 33 | 46 |
| Age group | ||
| 15 to 24 years | 35 | 39 |
| 25 to 54 years (reference category) | 40 | 42 |
| 55 years or older | 52Note * | 53Note * |
| Labour force status | ||
| Employed (reference category) | 41 | 42 |
| Unemployed | 45 | 47 |
| Out of the labour force | 43 | 51Note * |
| Place of residence | ||
| Urban | 35Note * | 39Note * |
| Rural (reference category) | 51 | 53 |
Source: Statistics Canada, Aboriginal Peoples Survey, 2017. |
||
Six in ten Métis who harvest want to spend more time on it
In 2012, Métis who had engaged in harvesting activities for themselves or their family, money or to supplement their income, or to share with others in their own or other communities were asked about their satisfaction with time spent on this activity.
Among Métis who had hunted, fished or trapped, 60% wanted to spend more time doing these activities (than they had in past 12 months) while 39% felt that they were spending the right amount of time harvesting. Métis males (63%) who had hunted, fished or trapped were more likely than females (53%) to want to spend more time on these activities. Core working-age adults (64%) and youth and young adults (59%) were more likely to express this sentiment than older adults (47%). For gathering wild plants or berries, nearly two-thirds (65%) reported that they were spending the right amount of time on this activity, while one in three (33%) wanted to spend more time on it. Some differences by socio-economic characteristics were evident. Females (37%) were more likely to want to spend more time on this activity than males (27%). Core working-age adults (41%) were more likely than youth and young adults (19%Note E : use with caution) and older adults (24%) to report this.
Métis who had reported wanting to spend more time on hunting, fishing or trapping were asked what prevented them from engaging in these activities more often. The leading barrier was time, reported by 73%. The other reasons included not having money for supplies (13%) and location (11%). For gathering, the leading reasons were not having enough time (70%) and location (12%).
Barriers to participation: Time, monetary and location constraints are leading barriers
In 2012, among Métis who had not participated in hunting, fishing or trapping in the prior year, approximately four in ten (36%) were interested in participating. Males (47%) were more likely to want to hunt, fish or trap than females (29%). Core working-age adults (38%) were more likely than older adults (32%) to express interest. No significant differences emerged between employed, unemployed and those not in the labour force.
Among those with an interest, the predominant reason for non-participation was not having enough time (Chart 8), with about one-half (47%) citing this reason. Approximately one in seven cited location (15%) or not having money for equipment or supplies (15%). About one in ten cited having no one to do it with (10%) or having a disability (9%) as barriers.
Data table for Chart 8
| Reasons for non-participation | Percent | 95% confidence interval | |
|---|---|---|---|
| Lower | Upper | ||
| Not enough time | 47 | 43 | 51 |
| Not enough money for equipment or supplies | 15 | 12 | 18 |
| Location | 15 | 13 | 18 |
| No one to hunt, fish or trap with | 10 | 8 | 13 |
| Physical disability | 9 | 7 | 12 |
| Quota restrictions | 1 | 0 | 2 |
| Fewer animals | Note F: too unreliable to be published | Note F: too unreliable to be published | Note F: too unreliable to be published |
| Other | 19 | 16 | 22 |
|
F too unreliable to be published Note: Percentages are computed using the number of people who were interested but did not participate in the described activity in the previous year as the denominator. Source: Statistics Canada, Aboriginal Peoples Survey, 2012. |
|||
Among Métis who hadn’t gathered wild plants in the previous year, 19% expressed interest in gathering. Females (21%) were more likely to be interested in this than men (16%). Core working-age adults (20%) were more likely than youth and young adults (17%) and older adults (16%) to report this. Those who were unemployed (27%) were more likely than employed (18%) or those out of the labour force (18%) to want to gather. The leading reason for not having gathered was the lack of time, with 46% citing this reason. About one in four (27%) also identified location as a barrier, and one in five (20%) said not having someone to teach the skills was the reason for non-participation. Other reasons were cited by one in ten or less.
Among youth and young adults, the leading reasons for not hunting, fishing or trapping were not having enough time (51%), location (21%), and not having any one to do it with (16%). For gathering wild plants or berries, the predominant reasons were not having enough time (39%Note E : use with caution) and location (38%). Also, about one in four (26%Note E : use with caution) stated that having no one to teach them skills was a barrier.
By labour force status, as expected, employed Métis (62%) were more likely to cite time constraints as the reason for not participating than those unemployed (37%Note E : use with caution), who were more likely to report this barrier than those out of the labour force (20%) (Table 7). In contrast, unemployed individuals (29%Note E : use with caution) were more likely than employed individuals (14%) to cite monetary reasons. No significant differences were seen by labour force status for those citing not having someone to hunt, fish or trap with them as a barrier. More revealingly, those not in the labour force (24%) were nearly 10 times more likely to cite physical disability as the reason for non-participation than those employed (2%Note E : use with caution). In the 2016 Census, about one-half of Métis out of the labour force were those 55 years or older.Note 51 Location was cited by a higher proportion of unemployed Métis (27%Note E : use with caution) than employed Métis (12%).
| Reasons for not having hunted, fished or trapped | Reasons for not having gathered wild plants or berries | ||||||||||||||
|---|---|---|---|---|---|---|---|---|---|---|---|---|---|---|---|
| Not enough time | Location | No one to do it with | Not enough money for supplies or equipment | Physical disability | Fewer animals | Quota restrictions | Other | Not enough time | Location | No one to teach needed skills | Physical disability, health or medical reasons | Fewer plants/berries to harvest | Not enough money for supplies or equipment | Other | |
| percent | |||||||||||||||
| Sex | |||||||||||||||
| Males | 53Note * | 14 | 9 | 16 | 10Note E: Use with caution | Note F: too unreliable to be published | Note F: too unreliable to be published | 18 | 51 | 21Note * | 19 | 5Note E: Use with caution | 4Note E: Use with caution | Note F: too unreliable to be published | 8Note E: Use with caution |
| Females (reference category) | 41 | 16 | 12 | 14 | 8Note E: Use with caution | Note F: too unreliable to be published | Note F: too unreliable to be published | 21 | 43 | 31 | 20 | 7Note E: Use with caution | 4Note E: Use with caution | 3Note E: Use with caution | 10 |
| Age group | |||||||||||||||
| 15 to 24 years | 51 | 21 | 16Note * | 15 | Note F: too unreliable to be published | Note F: too unreliable to be published | Note F: too unreliable to be published | 21 | 39Note E: Use with cautionNote * | 38Note * | 26Note E: Use with caution | Note F: too unreliable to be published | 6Note E: Use with caution | Note F: too unreliable to be published | 6Note E: Use with caution |
| 25 to 54 years (reference category) | 52 | 15 | 7 | 16 | 7Note E: Use with caution | Note F: too unreliable to be published | Note F: too unreliable to be published | 17 | 53 | 25 | 18 | 5 | 4Note E: Use with caution | 3Note E: Use with caution | 7Note E: Use with caution |
| 55 years or older | 32Note * | 11Note E: Use with caution | 13Note E: Use with caution | 12Note E: Use with caution | 23Note E: Use with cautionNote * | Note F: too unreliable to be published | Note F: too unreliable to be published | 22 | 34Note * | 18Note E: Use with caution | 18Note E: Use with caution | 18Note E: Use with cautionNote * | Note F: too unreliable to be published | Note F: too unreliable to be published | 19Note E: Use with cautionNote * |
| Labour force status | |||||||||||||||
| Employed (reference category) | 62 | 12 | 9 | 14 | 2Note E: Use with caution | Note F: too unreliable to be published | Note F: too unreliable to be published | 16 | 57 | 22 | 19 | Note F: too unreliable to be published | 4Note E: Use with caution | 2Note E: Use with caution | 7Note E: Use with caution |
| Unemployed | 37Note E: Use with cautionNote * | 27Note E: Use with cautionNote * | 15Note E: Use with caution | 29Note E: Use with cautionNote * | Note F: too unreliable to be published | Note F: too unreliable to be published | Note F: too unreliable to be published | 19Note E: Use with caution | 31Note E: Use with cautionNote * | 43Note E: Use with cautionNote * | 35Note E: Use with caution | Note F: too unreliable to be published | Note F: too unreliable to be published | Note F: too unreliable to be published | Note F: too unreliable to be published |
| Out of the labour force | 20Note * | 18 | 12Note E: Use with caution | 14Note E: Use with caution | 24Note * | Note F: too unreliable to be published | Note F: too unreliable to be published | 25Note * | 29Note * | 31 | 17 | 16Note E: Use with caution | 5Note E: Use with caution | Note F: too unreliable to be published | 13Note E: Use with cautionNote * |
| Place of residence | |||||||||||||||
| Urban | 46 | 18Note * | 10 | 16 | 9Note E: Use with caution | Note F: too unreliable to be published | 1Note E: Use with caution | 19 | 44 | 29Note * | 21 | 7Note E: Use with caution | 3Note E: Use with caution | 4Note E: Use with caution | 9 |
| Rural (reference category) | 49 | 6Note E: Use with caution | 13Note E: Use with caution | 11Note E: Use with caution | 11 | Note F: too unreliable to be published | Note F: too unreliable to be published | 18Note E: Use with caution | 54 | 15Note E: Use with caution | 16Note E: Use with caution | 4Note E: Use with caution | 7Note E: Use with caution | Note F: too unreliable to be published | 11Note E: Use with caution |
|
E use with caution F too unreliable to be published
Source: Statistics Canada, Aboriginal Peoples Survey, 2012. |
|||||||||||||||
Among urban and rural Métis, no significant differences were evident for most reasons with the exception being location (18% versus 6%Note E : use with caution, respectively).
By household type, Métis in female lone-parent families (35%) were less likely than those in couple-headed families (51%) to report time constraints as the reason for not engaging in hunting, fishing or trapping. But, they were more likely to cite not having someone to participate with (17%Note E : use with caution) than two-parent families (7%). Also, location was reported as a barrier among a higher proportion of those in female lone-parent families (22%Note E : use with caution) than two-parent families (12%).
Factors associated with participation in harvesting activities among Métis: income, labour force and remoteness among others are associated with participation
Examining socioeconomic and demographic characteristics of those who had or had not participated in harvesting activities offers insight into correlated factors. However, it is important to examine the association of each of these factors with participation in the context of other factors. For example, participation varied by age group, and it could be suggested that age is a factor for participation. Yet, it is important to investigate if age would remain a factor after accounting for health and household income, for example. To this end, multivariate analysis was done using the 2017 APS. This enables an examination of the association of each factor while simultaneously accounting for other factors that could also be associated. Factors included in this analysis were remoteness of place of residence, the individual’s sex, age group, health, household income (quintiles of household income after tax, adjusted for household size), labour force status, and sense of belonging to Métis culture and activities. These factors were chosen based on previous literature on harvesting activities among First Nations people, Métis and Inuit and bivariate analysis (data not shown). The role of other factors such as level of traditional knowledge, the awareness of hunting rights among Métis, and changes to policies relating to harvesting is not examined here due to data limitations. The analysis was restricted to those 25 years or older since education and labour forces status variables were considered.
Among Métis 25 years or older, after accounting for several other factors, remoteness of place of residence was positively associated with engaging in hunting, fishing or trapping (Table 8). The remoteness index used here is based on proximity to and the size of the population (or service) agglomerations.Note 37 A one unit increase in remoteness was associated with a 4% increase in odds of participating in hunting, fishing or trapping among Métis after accounting for other factors. As an example, a Métis person living in Winnipeg was predicted to be 31% likely to hunt, fish or trap after accounting for other factors. In comparison, a Métis in Buffalo Narrows or Pinehouse in northern Saskatchewan is about 70% likely to engage in this activity.
Men were nearly twice as likely (1.9 times) as women to hunt, fish or trap (Table 8). Older adults were less likely than core working-age adults to engage in these activities. Métis in excellent, very good or good health were more likely than those who were not to participate. Those who were not in the labour force were less likely to hunt, fish or trap than those employed. Among Métis, older adults make up almost half (48%) of all those not in the labour force.Note 51 Given the physical and time demands of hunting, fishing or trapping,Note 3 it is not surprising that those out of the labour force are less likely to participate than those employed. Household income was significantly associated with hunting, fishing or trapping. Participation appeared to increase somewhat with increasing household income with some exceptions. Predicted likelihood of hunting, fishing or trapping among Métis in the poorest income quintile was 31% compared with 40% among those in the richest quintile.
Sense of belonging to Métis culture and identity was assessed using several questions in the 2017 APS. Two of these were used here based on preliminary analysis. Having spent time trying to find out more about Métis history, traditions and culture was not associated with hunting, fishing or trapping. However, being active in Métis organizations, social events or cultural activities was significantly associated with participation in hunting, fishing or trapping. Participation appeared to increase with increasing degree of affirmation with being active in Métis organizations, social events or cultural activities (Table 8).
| Predicted marginal (or odds ratioTable 8 Note 1) | 95% confidence interval | Risk ratioTable 8 Note 3 | ||
|---|---|---|---|---|
| Lower | Upper | |||
| Remoteness indexTable 8 Note 1 | 1.04Note * | 1.03 | 1.04 | Note ...: not applicable |
| percent | ratio | |||
| Sex | ||||
| Male | 48 | 46 | 50 | 1.88Note * |
| Female (reference group) | 26 | 24 | 28 | 1.00 |
| Adjusted after-tax household income quintilesTable 8 Note 2 | ||||
| Quintile 1 (poorest) | 31 | 27 | 34 | 0.77Note * |
| Quintile 2 | 34 | 30 | 37 | 0.85Note * |
| Quintile 3 | 36 | 33 | 40 | 0.92 |
| Quintile 4 | 41 | 38 | 45 | 1.04 |
| Quintile 5 (richest) (reference group) | 40 | 36 | 43 | 1.00 |
| Labour force status | ||||
| Employed (reference group) | 38 | 36 | 40 | 1.00 |
| Unemployed | 32 | 26 | 38 | 0.84 |
| Out of the labour force | 33 | 30 | 36 | 0.87Note * |
| Age group | ||||
| Working age adults (25-54 years) (reference group) | 39 | 37 | 41 | 1.00 |
| Older adults (55 years or older) | 32 | 30 | 34 | 0.81Note * |
| Health | ||||
| Excellent, very good or good | 37 | 36 | 39 | 1.17Note * |
| Fair or poor (reference group) | 32 | 29 | 35 | 1.00 |
| Spent time finding out more about Métis history, traditions and culture |
||||
| Strongly agree | 38 | 35 | 42 | 0.95 |
| Agree | 38 | 36 | 40 | 0.94 |
| Neither agree nor disagree | 31 | 24 | 39 | 0.76 |
| Disagree | 29 | 26 | 33 | 0.72 |
| Strongly disagree (reference group) | 41 | 32 | 50 | 1.00 |
| Active in Métis organizations, social events or cultural activities |
||||
| Strongly agree | 43 | 37 | 50 | 1.59Note * |
| Agree | 42 | 39 | 46 | 1.54Note * |
| Neither agree nor disagree | 38 | 33 | 44 | 1.41Note * |
| Disagree | 36 | 34 | 38 | 1.31Note * |
| Strongly disagree (reference group) | 27 | 23 | 32 | 1.00 |
... not applicable
|
||||
With regard to gathering wild plants or berries, remoteness of place of residence and sex were significantly associated with this activity. Métis women were more likely than men to gather (data not shown). Neither health nor household income was associated with this activity. Interestingly, unemployed Métis were more likely than employed Métis to engage in this activity. Being active in Métis organizations, social events or cultural activities, and having spent time finding out more about Métis history, traditions and culture were also associated with gathering.
Discussion
Studies relating to Métis harvesting in contemporary times are limited to date. This article adds to this small body of literature and could inform programs and initiatives to support and increase participation in these activities. The analysis of prevalence of participation using four cycles of the APS, which span nearly 20 years, suggested a decreased participation in hunting, fishing or trapping in the recent two cycles compared with 2001 and 2006. A significant decreasing trend was apparent among youth and young adults after 2006. The prevalence was 17% lower in 2012 and 28% lower in 2017 compared with 2006 levels.
Several factors may have influenced this trend. The socioeconomic and demographic profile of Métis based on the four cycles of the APS portray a somewhat aging, yet youthful, population, with an improving education profile. Despite this, in 2012 and 2017, the employment rate had decreased and the proportion not in the labour force had increased. Given that hunting, fishing or trapping are time and resource intensive, the decreased employment levels and increased education levels may offer an explanation. Those who are employed or in school are expected to have less time to participate in harvesting activities. Also, the higher proportions of those not in the labour force may reflect an increasing involvement in education and somewhat aging population. However, it should be noted that higher levels of education completion may facilitate or hinder participation in harvesting activities. Higher levels of education is associated with being employed, which may provide the financial means to harvest, but limits the time available for this activity. While there is evidence of the barriers resulting from employment and school attendance among InuitNote 9Note 52 and First Nations people living on reserve,Note 3 these connections with the wage economy have not be been explored in detail among Métis previously.
To develop initiatives or programs to increase participation in harvesting activities, an understanding of potential facilitators and barriers associated with these activities is essential. The multivariate analysis reported here suggest that employed Métis were more likely to hunt, fish or trap than unemployed or out-of-the-labour-force Métis. However, based on self-reported barriers, they are also more likely to report time constraints.
Other barriers including location and money were significantly less prevalent. However, the latter, was more prevalent among Métis who were unemployed. Poor health or disability was more prevalent among older Métis and those not in the labour force. It is likely that there is significant overlap between these groups given that older adults make up a significant proportion of those not in the labour force.Note 51 Those in female lone-parent families face multiple barriers. These include not having someone to participate with and location barriers.
Together the findings outline some of the barriers of harvesting activities among Métis. They also broadly describe the competing interests of involvement in the wage economy, family responsibilities, health and harvesting activities. The findings also allude to potential facilitators, or levers that may facilitate participation. Of particular significance was the association between being active in Métis organizations, social events or cultural activities. The likelihood of participation increased with increasing degree of affirmation with engagement in the above activities.
This analysis could inform potential strategies and tailored initiatives to support or increase the participation in harvesting activities among Métis. Among youth and young adults, these may need to address the barriers of time and not having someone to do it with. With employed Métis, these would need to primarily address the time barrier, while among the unemployed, it would be financial and location barriers.
Finally, self-reported reasons for participating, specifically, for own use and to share with others, may have implications for food security and nutrition among Métis. Understanding who is more likely to share with others, such as Métis hunters who are unemployed, could inform future research on sharing networks and initiatives to address food insecurity.
Harvesting activities among Inuit
Hunting, fishing, trapping and gathering wild berries has been a way of life for Inuit for millennia, and has endured despite the impact of colonization, forced relocation to permanent settlements, and the introduction of the wage economy.Note 1Note 2Note 3 Inuit were also impacted by the residential school system, and a large number of Inuit children were sent to schools starting in the mid-1950s. In some cases, they were sent to schools thousands of kilometers from their homes and went years without seeing their parents.Note 1 Many parents settled in communities around the schools to be close to their children, often giving up their traditional harvesting activities. Today, harvesting among Inuit encounters new challenges. Climate change has led to decreases in ice thickness rendering hunting activities more dangerous and less predictable than before.Note 25 It has also resulted in reported decreases to access to hunting and harvesting areas and availability of game.Note 25 Increased participation in the wage-economy and labour market activities means reduced time available for harvesting. In addition, costs of equipment and gas required for harvesting activities continue to increase.Note 4 Other previously reported barriers to participating in harvesting activities for Inuit include a lack of interest or knowledge, poor health and school attendance. However, barriers vary by region. In Nunavik, the predominant constraint reported was the cost of harvesting, while in Nunatsiavut, it was poor health.Note 3
As a result of these challenges and because of the dietary, economic and cultural importance of harvesting activities, many Inuit households have adapted to the new conditions. “Super-hunter” Inuit households, or households that dedicate significant resources to harvesting and have high rates of harvests, are also engaged in the wage-economy.Note 52Note 53 This adaptation has helped foster the continuation of the Inuit way of living.
Harvesting is considered central to economic life in small Inuit communities.Note 53 Harvesting and gathering activities are conservatively estimated to have a “shadow value” of over $10 million in Qikiqtaaluk Region of Nunavut alone.Note 9
To better understand trends in harvesting activities among Inuit, factors associated with participation in these activities and barriers to engagement, data from four cycles of the Aboriginal Peoples Survey were used. These findings could inform programs and policies that aim to encourage harvesting activities among Inuit while adding to the growing literature on this topic.
About two in three Inuit in Inuit Nunangat hunt, fish or trap
In 2017, two-thirds (65%) of Inuit in Inuit Nunangat, the Inuit homeland, had participated in hunting, fishing or trapping. Across Canada, about six in ten (56%) Inuit aged 15 years or older had participated. The prevalence among Inuit outside Inuit Nunangat was significantly lower (37%). About four in ten (42%) had gathered wild berries or plants across Canada, and one in two (47%) in Inuit Nunangat. The prevalence of this activity was significantly lower outside Inuit Nunangat (30%).
Participation in hunting, fishing or trapping was not significantly different by Inuit Nunangat region (Figure 3) with the exception of Inuvialuit region, where it was lower (57%). More variability in levels of gathering was evident by Inuit Nunangat regions (Figure 3). In 2017, it was highest among Inuit in Nunavik (70%). Prevalence in Nunatsiavut (63%) was higher than in the Inuvialuit region (44%), which was higher than in Nunavut (37%).
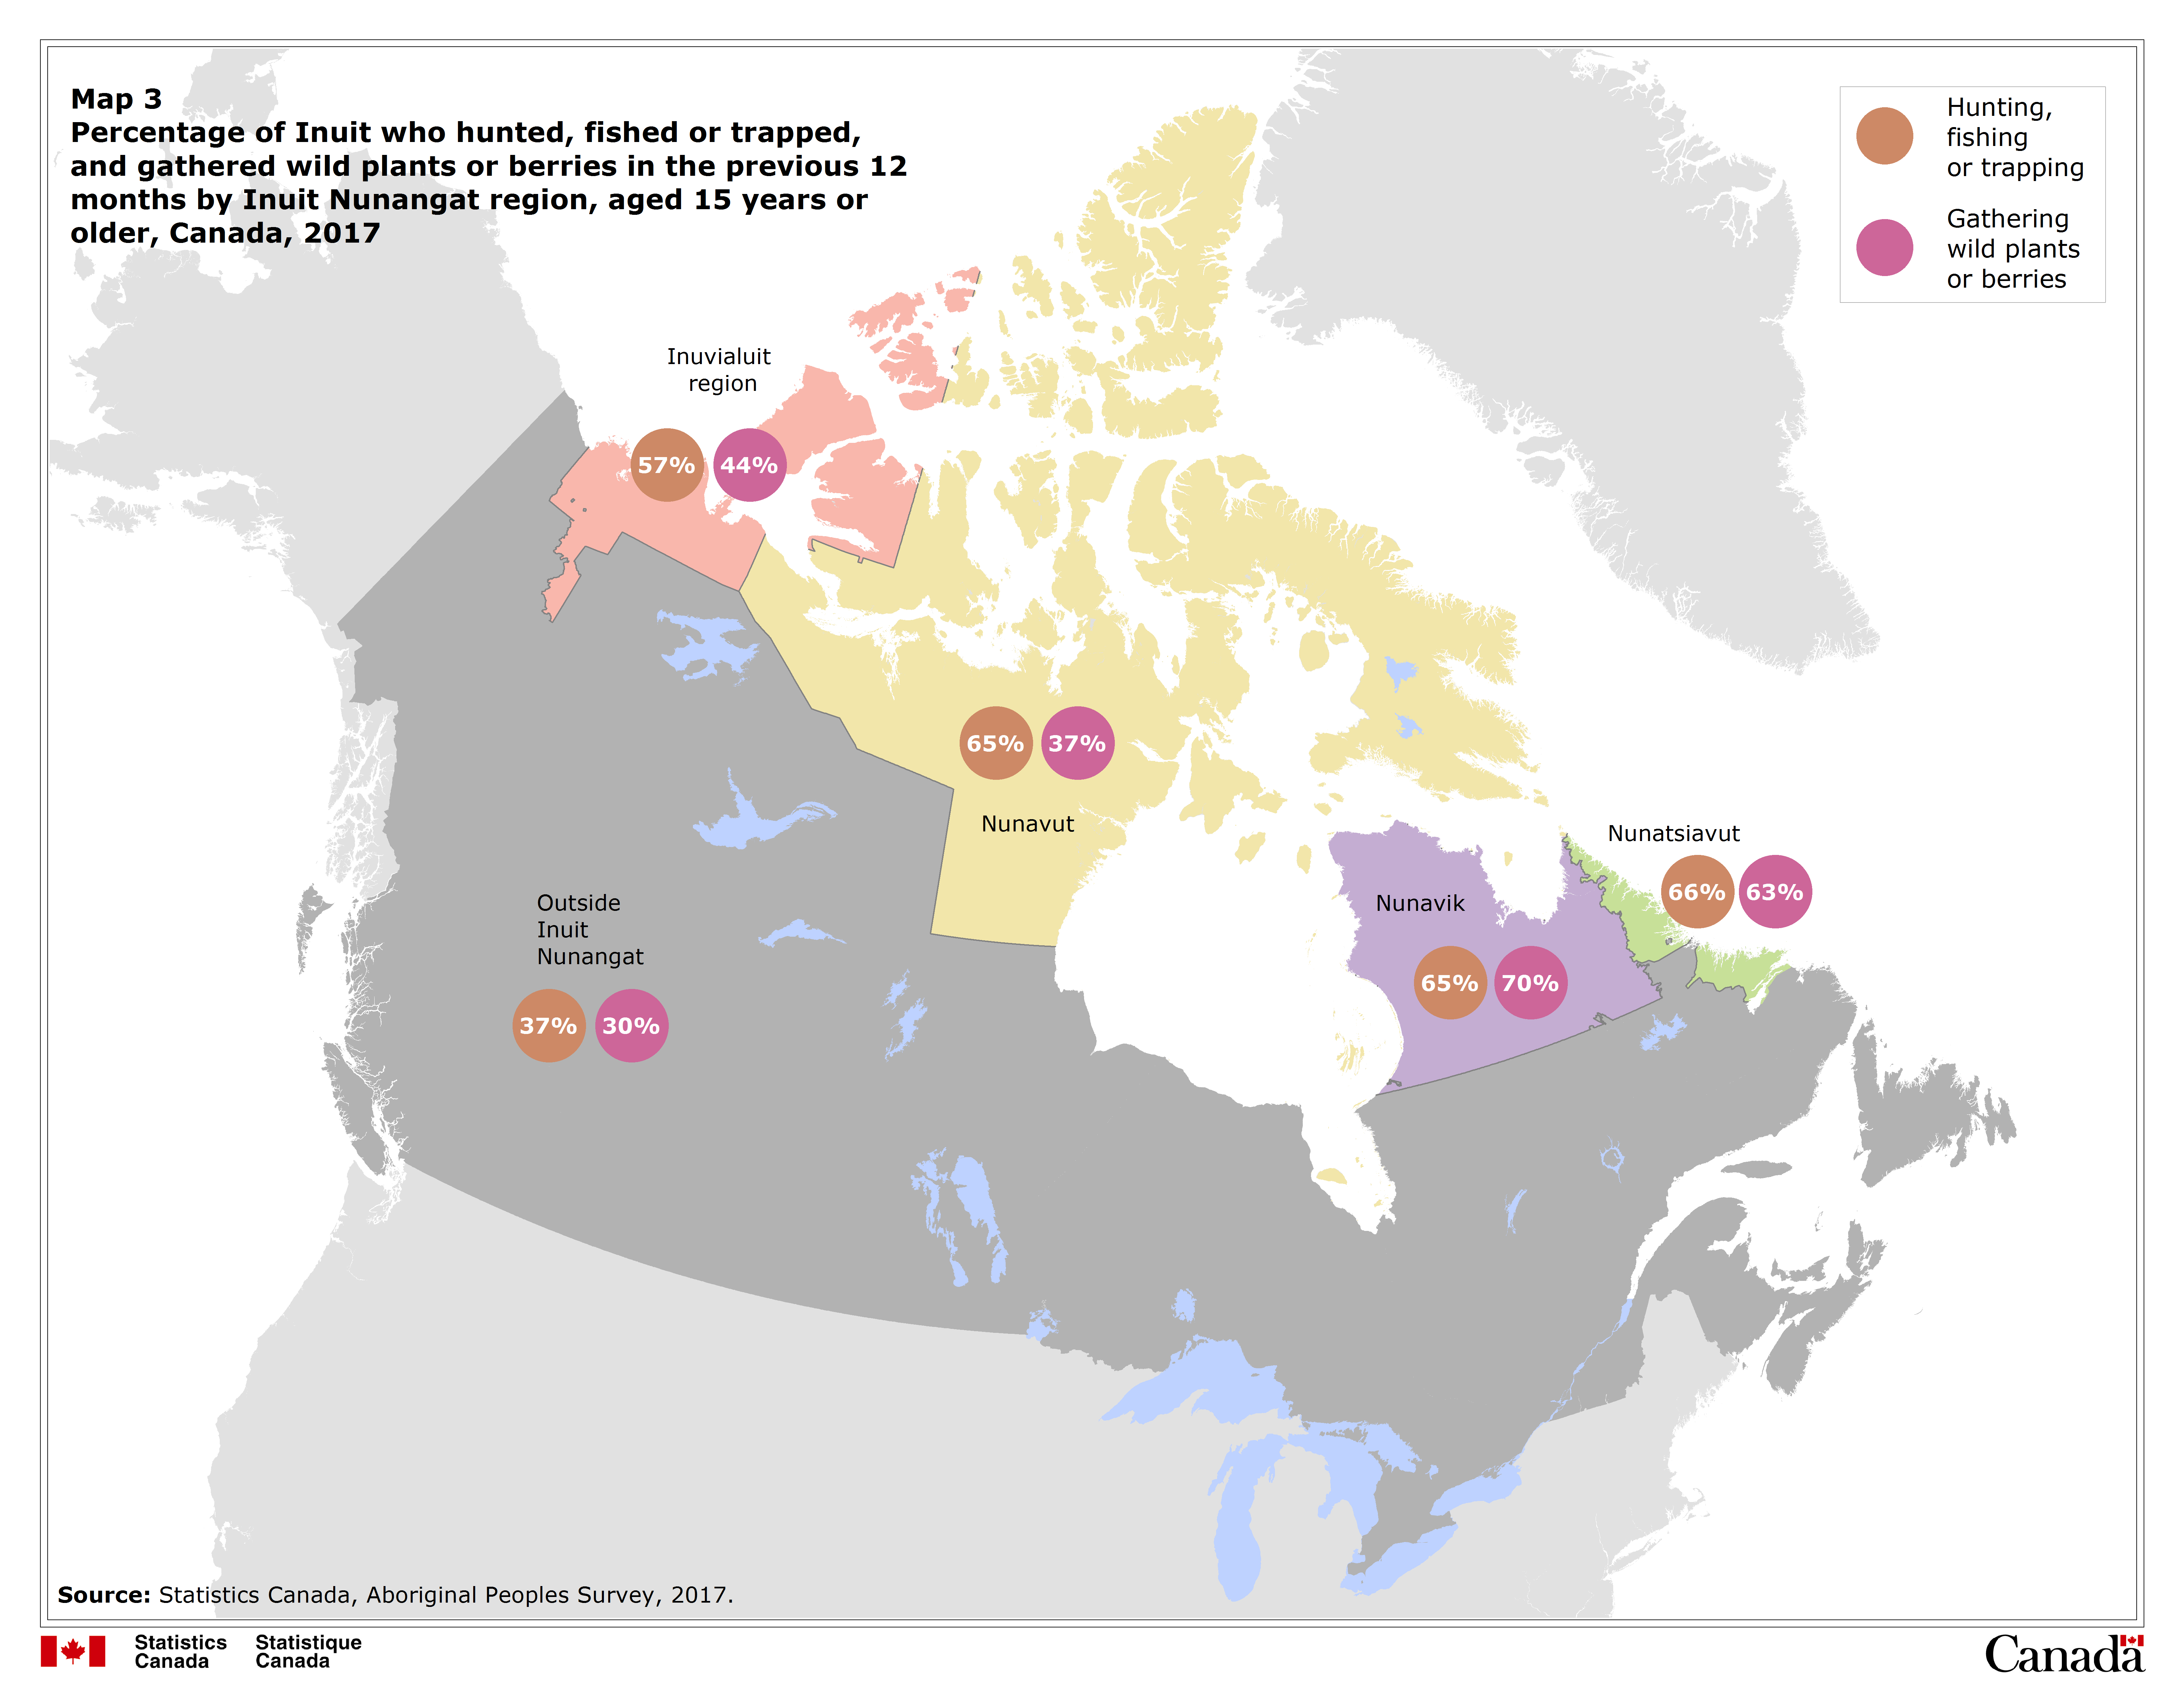
Description for Map 3
| Hunting, fishing or trapping | Gathering wild plants or berries | |
|---|---|---|
| percent | ||
| Nunatsiavut | 66 | 63 |
| Nunavik | 65 | 70 |
| Inuvialuit region | 57 | 44 |
| Nunavut | 65 | 37 |
| Outside Inuit Nunangat | 37 | 30 |
| Source: Statistics Canada, Aboriginal Peoples Survey, 2017. | ||
This map shows the percent of Inuit, aged 15 or older, who had hunted, fished or trapped and gathered wild plants or berries in the previous 12 months in 2017 by Inuit Nunangat region and region outside Inuit Nunangat. The percentages for hunting, fishing or trapping, and gathering are shown separately within circles in each Inuit Nunangat region and the area of Canada outside Inuit Nunangat.
| Colour | Description |
|---|---|
| Brown | Hunting, fishing or trapping |
| Pink | Gathering wild plants or berries |
Participation in harvesting, particularly hunting, fishing or trapping, potentially declining among core working-age adults
Several studies have alluded to a decline in harvesting activities among Inuit in association with climate, social, economic and political changes.Note 4Note 12 To examine trends in harvesting activities by age group, sex and region, four cycles of the Aboriginal Peoples Survey were used.
Among Inuit overall, a decreasing trend in hunting, fishing or trapping was apparent (Chart 9). Prevalence decreased from 70% in 2006 to 62% in 2012 and 56% in 2017. When examined by age group, the declining trend was particularly evident among core working-age adults (aged 25 to 54). The gap between youth and young adults (aged 15 to 24) and core working-age adults, and older adults (aged 55 or older) appeared to widen with each cycle. In 2017, unlike in previous cycles, older Inuit were significantly less likely to hunt, fish or trap (49%) than the youth and young adults or core working-age adults (approximately 57%). While this signified an 18% decrease from 2006 levels in the younger age groups, it meant a 27% decrease in the older age group.
Males were consistently more likely to hunt, fish or trap. Among males, only the 2017 prevalence (66%) was lower than in other years (79%, 79% and 75% in 2001, 2006 and 2012, respectively). Among females, both the 2012 (51%) and 2017 (47%) levels were lower than the prevalence in other years (58% and 61% in 2001 and 2006, respectively).

Data table for Chart 9
| Age group | 2001 | 2006 | 2012 | 2017 | ||||||||
|---|---|---|---|---|---|---|---|---|---|---|---|---|
| Percent | 95% confidence interval | Percent | 95% confidence interval | Percent | 95% confidence interval | Percent | 95% confidence interval | |||||
| Lower | Upper | Lower | Upper | Lower | Upper | Lower | Upper | |||||
| 15 to 24 years | 69 | 65 | 72 | 70 | 66 | 73 | 62 | 56 | 68 | 57 | 54 | 60 |
| 25 to 54 years | 69 | 65 | 73 | 70 | 67 | 73 | 63 | 60 | 67 | 58 | 54 | 61 |
| 55 years or older | 68 | 62 | 73 | 67 | 62 | 72 | 59 | 48 | 69 | 49 | 46 | 53 |
| Sources: Statistics Canada, Aboriginal Peoples Survey, 2001, 2006, 2012 and 2017. | ||||||||||||
Across Inuit Nunangat regions, prevalence of hunting, fishing or trapping was lower in the Inuvialuit region compared with the other three regions in multiple cycles. In two regions, a downward trend in hunting, fishing or trapping was seen after 2006: Nunatsiavut and Nunavut (Chart 10).
Data table for Chart 10
| Inuit Nunangat region | 2001 | 2006 | 2012 | 2017 | ||||||||
|---|---|---|---|---|---|---|---|---|---|---|---|---|
| Percent | 95% confidence interval | Percent | 95% confidence interval | Percent | 95% confidence interval | Percent | 95% confidence interval | |||||
| Lower | Upper | Lower | Upper | Lower | Upper | Lower | Upper | |||||
| Nunatsiavut | 75 | 69 | 80 | 86 | 83 | 89 | 74 | 71 | 78 | 66 | 63 | 69 |
| Nunavik | 81 | 78 | 83 | 82 | 80 | 84 | 72 | 69 | 75 | 65 | 62 | 68 |
| Nunavut | 76 | 75 | 78 | 77 | 76 | 79 | 68 | 65 | 71 | 65 | 62 | 68 |
| Inuvialuit region | 63 | 58 | 68 | 73 | 69 | 77 | 67 | 62 | 71 | 57 | 54 | 60 |
| Outside Inuit Nunangat | 40 | 32 | 49 | 49 | 43 | 55 | 46 | 36 | 56 | 37 | 31 | 42 |
| Sources: Statistics Canada, Aboriginal Peoples Survey, 2001, 2006, 2012 and 2017. | ||||||||||||
Among Inuit outside Inuit Nunangat, in two cycles, the prevalence of hunting, fishing or trapping was higher among those in rural areas than urban areas: 2001 and 2006 (data not shown).
For gathering wild plants or berries, the trends were less dramatic and less consistent (Chart 11). For youth and young adults and older adults, the prevalence in 2012 and 2017, while not significantly different from each other, were lower than the 2006 level. For the core working-age adults, a decrease was observed when comparing prevalence of gathering in 2012 and 2017 to 2006 level. Inuit females were consistently more likely to participate than males. A somewhat downward trend was apparent among males (data not shown).

Data table for Chart 11
| Age group | 2001 | 2006 | 2012 | 2017 | ||||||||
|---|---|---|---|---|---|---|---|---|---|---|---|---|
| Percent | 95% confidence interval | Percent | 95% confidence interval | Percent | 95% confidence interval | Percent | 95% confidence interval | |||||
| Lower | Upper | Lower | Upper | Lower | Upper | Lower | Upper | |||||
| 15 to 24 years | 42 | 39 | 46 | 50 | 46 | 53 | 37 | 33 | 42 | 37 | 34 | 40 |
| 25 to 54 years | 52 | 49 | 56 | 56 | 53 | 59 | 48 | 45 | 52 | 43 | 40 | 46 |
| 55 years or older | 54 | 49 | 60 | 57 | 52 | 62 | 46 | 38 | 54 | 47 | 44 | 50 |
| Sources: Statistics Canada, Aboriginal Peoples Survey, 2001, 2006, 2012 and 2017. | ||||||||||||
The prevalence was consistently higher in Nunatsiavut and Nunavik compared with Nunavut and the Inuvialuit region (Chart 12). While there was a downward trend in Nunatsiavut and Nunavut after 2006, the prevalence was somewhat inconsistent in Nunavik. In the Inuvialuit region, the prevalence increased in 2006 but was lower in 2012 and 2017 as compared to 2006, but not 2001, levels.

Data table for Chart 12
| Inuit Nunangat region | 2001 | 2006 | 2012 | 2017 | ||||||||
|---|---|---|---|---|---|---|---|---|---|---|---|---|
| Percent | 95% confidence interval | Percent | 95% confidence interval | Percent | 95% confidence interval | Percent | 95% confidence interval | |||||
| Lower | Upper | Lower | Upper | Lower | Upper | Lower | Upper | |||||
| Nunatsiavut | 60 | 54 | 66 | 79 | 75 | 83 | 70 | 67 | 74 | 63 | 60 | 66 |
| Nunavik | 67 | 64 | 69 | 72 | 68 | 75 | 61 | 58 | 65 | 70 | 67 | 73 |
| Nunavut | 52 | 50 | 54 | 58 | 56 | 60 | 45 | 42 | 49 | 37 | 34 | 40 |
| Inuvialuit region | 33 | 29 | 38 | 56 | 51 | 60 | 48 | 44 | 52 | 44 | 41 | 47 |
| Outside Inuit Nunangat | 31 | 25 | 39 | 34 | 28 | 40 | 31 | 24 | 38 | 30 | 26 | 35 |
| Sources: Statistics Canada, Aboriginal Peoples Survey, 2001, 2006, 2012 and 2017. | ||||||||||||
Similar to the trends for hunting, fishing or trapping, Inuit living in rural areas outside Inuit Nunangat were consistently more likely to gather wild plants or berries than those in urban areas. No significant upward or downward trend was apparent (data not shown).
Trends in potentially influencing factors
Larger socio-economic and demographic changes in the Inuit population may have influenced the trends in participation in harvesting activities. In terms of age structure, while the Inuit population is still young, the proportion of older adults has been increasing somewhat and the proportion of youth and young adults and working-age adults (25 to 44 years) somewhat decreased in 2012 and 2017 (Chart 13). The median age of the Inuit population 15 years and older has changed little since 2006.

Data table for Chart 13
| Socioeconomic and demographic characteristics | 2001 | 2006 | 2012 | 2017 | ||||||||
|---|---|---|---|---|---|---|---|---|---|---|---|---|
| Percent | 95% confidence interval | Percent | 95% confidence interval | Percent | 95% confidence interval | Percent | 95% confidence interval | |||||
| Lower | Upper | Lower | Upper | Lower | Upper | Lower | Upper | |||||
| Age | ||||||||||||
| 15 to 24 years | 30 | 28 | 32 | 32 | 30 | 34 | 30 | 28 | 33 | 27 | 26 | 28 |
| 25 to 34 years | 25 | 23 | 27 | 22 | 20 | 23 | 19 | 18 | 21 | 22 | 21 | 24 |
| 35 to 44 years | 21 | 19 | 23 | 20 | 18 | 22 | 19 | 17 | 21 | 17 | 15 | 19 |
| 45 to 54 years | 12 | 11 | 14 | 13 | 12 | 15 | 14 | 12 | 16 | 16 | 15 | 18 |
| 55 to 64 years | 7 | 6 | 8 | 8 | 7 | 9 | 10 | 8 | 13 | 10 | 9 | 10 |
| 65 years or older |
5 | 4 | 6 | 5 | 5 | 6 | 7 | 6 | 9 | 7 | 7 | 8 |
| Median age of 15+ population (years) | 32 | 31 | 33 | 33 | 32 | 34 | 34 | 33 | 35 | 34 | 33 | 35 |
| Education | ||||||||||||
| Less than high school | 57 | 55 | 60 | 54 | 51 | 56 | 48 | 45 | 51 | 39 | 37 | 41 |
| High school | 8 | 7 | 10 | 11 | 9 | 12 | 12 | 11 | 14 | 16 | 14 | 17 |
| Post-secondary education below bachelor's level | 33 | 30 | 35 | 31 | 29 | 33 | 36 | 33 | 39 | 41 | 38 | 43 |
| University or higher |
2 | 1 | 3 | 4 | 3 | 6 | 3 | 2 | 5 | 5 | 4 | 6 |
| Labour force status | ||||||||||||
| Employment rate | 53 | 50 | 55 | 53 | 51 | 55 | 52 | 49 | 54 | 54 | 52 | 56 |
| Unemployment rate | 20 | 18 | 22 | 15 | 14 | 17 | 18 | 14 | 22 | 15 | 13 | 17 |
| Not in the labour force | 34 | 32 | 36 | 38 | 36 | 40 | 37 | 35 | 40 | 37 | 35 | 38 |
| Geography | ||||||||||||
| Urban | 13 | 11 | 16 | 23 | 21 | 26 | 22 | 19 | 24 | 24 | 22 | 25 |
| Rural | 7 | 6 | 9 | 7 | 6 | 8 | 7 | 6 | 9 | 7 | 6 | 8 |
| Inuit Nunangat | 79 | 76 | 82 | 70 | 68 | 72 | 71 | 69 | 73 | 70 | 69 | 71 |
| Sources: Statistics Canada, Aboriginal Peoples Survey, 2001, 2006, 2012 and 2017. | ||||||||||||
The education profile of the Inuit population has been steadily improving (Chart 13). The proportion of those without a high school education has decreased over the years, and gains have been made in high school and post-secondary education below the bachelor’s level. The proportion of those with a university degree, while low, increased after 2001 but has since remained unchanged. The proportions of employed, unemployed and not in the labour force has seen little variation over the cycles. However, it is important to note that these rates are a snapshot in time and reflect the economic conditions at the time of the survey. Year-by-year analysis has previously show that there are significant fluctuations in rates over time among First Nations people living off reserve and Métis.Note 34 The proportion of people living outside Inuit Nunangat, particularly in urban areas, increased after 2001 and remained unchanged.
The increasing proportion of those with a high school and post-secondary education, and increasing trend towards urbanization (i.e. living in urban areas outside Inuit Nunangat) may have influenced the overall downward trend in harvesting. For example, the time demands of school attendance suggests decreased availability of time for harvesting activities.Note 3 Significantly, the increase in the proportion of those living outside Inuit Nunangat is expected to limit access to such activities for some Inuit. While this examination suggests potential factors that may have influenced the trends, it is important to note that the statistical associations between these factors and the trends in participation were not explored in this report.
Almost all Inuit harvesters primarily participate in these activities for own use
Harvesting activities such as hunting, fishing and gathering are immensely important to the economy, diet, culture and identity of Inuit in Inuit Nunangat.Note 53Note 54 The 2017 APS asked Inuit the reasons for engaging in these activities. This section explores these reasons by select socio-economic factors.
Almost all Inuit who participated in hunting, fishing or trapping did so for own use or own family’s use (91%) in 2017. About two-thirds (66%) participated for what is categorized as pleasure or leisure. In interpreting the latter finding, it is important to distinguish this from sport hunting, which is often undertaken for pleasure and leisure. For many Inuit these activities provide a sense of identity, connection with the land, and an opportunity to spend time with community members, family or friends.Note 36 One half or more engaged in these activities to share with others in the community (59%) or for cultural reasons (54%). One in ten participated for money or to supplement their income. The reasons for gathering wild plants or berries were similar.
Why Inuit hunt, fish, trap or gather varies by socioeconomic and demographic factors
Reported reasons for harvesting are expected to vary by socioeconomic and demographic factors, and could identify potential barriers and facilitators to engaging in these activities. Also, specifically, such an examination can help identify characteristics of those who are more likely to share their harvest with others in the community. This may have implications for nutrition and food security.
Prevalence of hunting, fishing or trapping for own use among those who participated was not significantly different by age group, sex, labour force status or household type (Table 9). However, outside Inuit Nunangat, Inuit living in rural areas (95%) were more likely to engage in this activity for own use or own family’s use than those in urban areas (84%). Participation tied to communal sharing was more likely among males (61%) than females (56%) for all Inuit. Inuit inside Inuit Nunangat (63%) were more likely to participate for reasons of communal sharing than those outside (45% in urban areas and 33% in rural areas). The pattern was similar for cultural reasons (Table 9). Inuit males (14%) were significantly more likely to hunt, fish or trap for money or to supplement income than females (6%). Those in Inuit Nunangat (12%) were significantly more likely to do this than those outside Inuit Nunangat, particularly those in urban areas (2%Note E : use with caution).
| Reasons for hunting, fishing or trapping in the previous 12 months | Reasons for gathering wild plants or berries in the previous 12 months | |||||||||||
|---|---|---|---|---|---|---|---|---|---|---|---|---|
| For pleasure or leisure | Own use/family’s use | To share with others in the community | For cultural reasons | For money or to supplement income | For some other reason | For pleasure or leisure | Own use/family’s use | To share with others in the community | For cultural reasons | For money or to supplement income | For some other reason | |
| percent | ||||||||||||
| Sex | ||||||||||||
| Males | 62Note * | 92 | 61Note * | 54 | 14Note * | 4Note E: Use with caution | 63Note * | 95 | 49 | 49 | 5Note E: Use with caution | 5Note E: Use with caution |
| Females (reference category) | 70 | 90 | 56 | 54 | 6 | 3Note E: Use with caution | 73 | 93 | 49 | 49 | 4 | 3Note E: Use with caution |
| Age group | ||||||||||||
| 15 to 24 years | 69 | 89 | 59 | 55 | 9 | 3Note E: Use with caution | 72 | 89Note * | 47 | 48 | 4Note E: Use with caution | Note F: too unreliable to be published |
| 25 to 54 years (reference category) | 65 | 92 | 59 | 53 | 11 | 4Note E: Use with caution | 69 | 95 | 49 | 49 | 5 | 5Note E: Use with caution |
| 55 years or older | 64 | 92 | 59 | 54 | 10 | 4Note E: Use with caution | 65 | 96 | 53 | 48 | 5Note E: Use with caution | 3Note E: Use with caution |
| Labour force status | ||||||||||||
| Employed (reference category) | 68 | 91 | 59 | 55 | 8 | 3 | 70 | 94 | 51 | 51 | 3Note E: Use with caution | 5Note E: Use with caution |
| Unemployed | 68 | 93 | 60 | 54 | 13Note E: Use with caution | Note F: too unreliable to be published | 70 | 96 | 50 | 48 | 4Note E: Use with caution | Note F: too unreliable to be published |
| Out of the labour force | 62Note * | 92 | 58 | 52 | 13Note * | 3Note E: Use with caution | 67 | 92 | 46 | 46 | 7Note * | Note F: too unreliable to be published |
| Place of residence | ||||||||||||
| Urban | 79 | 84Note * | 45 | 45 | 2Note E: Use with caution | 5Note E: Use with caution | 79 | 95 | 54 | 44 | Note F: too unreliable to be published | 12Note E: Use with caution |
| Rural (reference category) | 74 | 95 | 33 | 34 | Note F: too unreliable to be published | Note F: too unreliable to be published | 77 | 97 | 45 | 34 | Note F: too unreliable to be published | Note F: too unreliable to be published |
| Inuit Nunangat | 63 | 92 | 63Note * | 57Note * | 12 | 2Note E: Use with caution | 67 | 93 | 49 | 51Note * | 5 | 2Note E: Use with caution |
|
E use with caution F too unreliable to be published
Source: Statistics Canada, Aboriginal Peoples Survey, 2017. |
||||||||||||
For gathering wild berries or plants, some differences by socioeconomic and demographic factors were significant (Table 9). Working-age adults (95%) and older adults (96%) were more likely to gather for own use or own family’s use than youth and young adults (89%). As with hunting, Inuit in Inuit Nunangat (51%) were more likely than those outside, for example, those in rural areas (34%), to gather for cultural reasons. Out-of-the-labour-force Inuit (7%) were more than twice as likely as employed Inuit (3%Note E : use with caution) to gather for monetary reasons.
Among Inuit harvesters, six in ten hunt, fish or trap at least weekly during season
Knowledge of the frequency of participation, and satisfaction with time spent, in addition to their socioeconomic and demographic profiles, can better inform policies and programs to support harvesting among Inuit.
Frequency of participation
In 2017, Inuit who had participated in harvesting activities in the previous 12 months were asked how often they participated during harvesting season. About six in ten (62%) Inuit in Inuit Nunangat who had hunted, fished or trapped had done so at least once a week (“higher frequency”). About one in four (24%) had done so at least once a month but less frequently than once a week. About one in seven (14%) had done so less than once a month. Overall prevalence by frequency of participation was similar for gathering with 70% having gathered at least once a week.
The prevalence of higher frequency hunting, fishing or trapping was greater among males (66%) than females (57%) (Table 10). No differences by age group or labour force status were seen. For gathering wild plants or berries, such variations were not observed.
| Hunted, fished or trapped at least once a week during season | Gathered wild plants or berries at least once a week during season | |
|---|---|---|
| percent | ||
| Sex | ||
| Males | 66Note * | 70 |
| Females (reference category) | 57 | 71 |
| Age group | ||
| 15 to 24 years | 59 | 68 |
| 25 to 54 years (reference category) | 63 | 71 |
| 55 years or older | 67 | 72 |
| Labour force status | ||
| Employed (reference category) | 60 | 71 |
| Unemployed | 64 | 68 |
| Out of the labour force | 65 | 69 |
| Place of residence | ||
| Rural (reference category) | 53 | 54 |
| Urban | 39Note * | 46 |
| Inuit Nunangat | 67Note * | 76Note * |
Source: Statistics Canada, Aboriginal Peoples Survey, 2017. |
||
Six in ten Inuit who harvest want to spend more time on it
In 2012, Inuit who had engaged in harvesting activities for their own use or their family’s use, money or to supplement their income, or to share with community members, whether their own or others, were asked about their satisfaction with their participation frequency.
Among Inuit who had hunted, fished or trapped, 56% wanted to spend more time doing these activities (than they had in past 12 months) while 41% reported that they were spending the right amount of time engaged in the activity. No sex or age differences were observed. For gathering wild plants or berries, a significantly higher proportion perceived they were spending the right amount of time (60%) than those who wanted to spend more time (33%). Females (40%) were more likely than males (24%) to want to spend more time gathering.
Inuit who reported that they would like to spend more time on harvesting activities were asked what prevented them from engaging in these activities more often. For hunting, fishing or trapping, the leading reason, reported by about six in ten (58%) was not having enough time. Following this, not having enough money for supplies was cited by just over one in three (32%). Other reasons including location, fewer animals to harvest, no one to do it with, having a physical disability and quotas were reported by about one in ten or less. For gathering wild plants or berries, the predominant barrier was time (66%). Money- and location-related barriers were cited by about one in seven. Others reasons were less prevalent.
Leading barriers to participation include time, money and location
In the 2012 APS, Inuit who hadn’t participated in harvesting activities in the prior year were asked what had prevented them from doing these activities. Examining these reasons would enable a better understanding of experienced barriers to participation.
In 2012, about six in ten (57%) Inuit who did not hunt, fish or trap wanted to do these activities. Inuit males (65%) were more likely than females (53%) to express an interest. The proportion of those interested was higher among youth and young adults (61%) and core working-age adults (60%) than older adults (43%). Employed (62%) and unemployed (68%) Inuit were more likely than those out of the labour force (49%) to want to participate. Couple-headed families with children (64%) were more likely than those without children (44%) to want to do these activities. The proportions were not significantly different between those in male (46%Note E : use with caution) and female (60%) lone-parent households.
The leading reasons for non-participation in hunting, fishing or trapping despite an interest (Chart 14) were not having enough time (33%) or money for equipment or supplies (29%). About one in five (19%) cited location as a factor preventing them from hunting, fishing or trapping. About one in ten (8%) reported that having a disability had prevented them from engaging in these activities.

Data table for Chart 14
| Reasons for non-participation | Percent | 95% confidence interval | |
|---|---|---|---|
| Lower | Upper | ||
| Not enough time | 33 | 28 | 40 |
| Not enough money for equipment or supplies | 29 | 24 | 35 |
| Location | 19 | 13 | 27 |
| No one to hunt, fish or trap with | 10 | 7 | 13 |
| Physical disability | 8 | 6 | 13 |
| Quota restrictions | Note F: too unreliable to be published | Note F: too unreliable to be published | Note F: too unreliable to be published |
| Fewer animals | Note F: too unreliable to be published | Note F: too unreliable to be published | Note F: too unreliable to be published |
| Other | 16 | 11 | 22 |
|
F too unreliable to be published Note: Percentages are computed using the number of people who were interested but did not participate in the described activity in the previous year as the denominator. Source: Statistics Canada, Aboriginal Peoples Survey, 2012. |
|||
About one quarter (26%) of Inuit who had not gathered wild plants or berries wanted to gather. Women (36%) were more than twice as likely to report this as men (16%). No significant differences by age group were seen. While there was little variation between those in couple-headed households with or without children, those in female lone-parent households (39%) were about twice as likely as those in male lone-parent households (18%) to want to gather.
The leading reason for not participating in gathering despite being interested was not having enough time to do it, with about four in ten (42%) reporting this reason. About one in four (24%) cited location as a barrier. About one in ten cited either not having enough money for supplies or equipment, fewer plants or berries to gather, or poor health as barriers.
Among youth and young adults, and core working-age adults, the leading reasons for not hunting, fishing or trapping were not having enough time (32%Note E : use with caution and 36%, respectively), not having enough money for equipment and supplies (24%Note E : use with caution and 32%, respectively), and location constraints (18%Note E : use with caution for working-age adults) (Table 11). Among older Inuit, in addition to time (25%Note E : use with caution) and monetary constraints (30%Note E : use with caution), ill-health and disability (29%Note E : use with caution) prevented them from participating. For gathering wild plants or berries, the leading reasons among youth and young adults and core working-age adults were not having enough time (36%Note E : use with caution and 50%, respectively), location (34%Note E : use with caution and 21%Note E : use with caution, respectively) and having fewer plants or berries to harvest (12%Note E : use with caution and 11%Note E : use with caution, respectively). In contrast with hunting, fishing or trapping, among older Inuit, the leading reason reported of not participating was poor health or disability (41%Note E : use with caution).
| Reasons for not having hunted, fished or trapped | Reasons for not having gathered wild plants or berries | ||||||||||||||
|---|---|---|---|---|---|---|---|---|---|---|---|---|---|---|---|
| Not enough time | Not enough money for supplies or equipment | No one to do it with | Physical disability | Location | Fewer animals | Quota restrictions | Other | Not enough time | Location | Fewer plants/berries to harvest | Physical disability, health or medical reasons |
Not enough money for supplies or equipment | No one to teach needed skills | Other | |
| percent | |||||||||||||||
| Sex | |||||||||||||||
| Males | 34 | 31 | 13Note E: Use with caution | 14Note E: Use with caution | 13Note E: Use with caution | Note F: too unreliable to be published | Note F: too unreliable to be published | 14Note E: Use with caution | 45 | 12Note E: Use with cautionNote * | 11Note E: Use with caution | Note F: too unreliable to be published | 11Note E: Use with caution | Note F: too unreliable to be published | 18Note E: Use with cautionNote * |
| Females (reference category) | 33 | 28 | 8Note E: Use with caution | 6Note E: Use with caution | 22Note E: Use with caution | Note F: too unreliable to be published | Note F: too unreliable to be published | 16Note E: Use with caution | 40 | 29Note E: Use with caution | 12Note E: Use with caution | 10Note E: Use with caution | 10Note E: Use with caution | 9Note E: Use with caution | 9Note E: Use with caution |
| Age group | |||||||||||||||
| 15 to 24 years | 32Note E: Use with caution | 24Note E: Use with caution | 15Note E: Use with cautionNote * | Note F: too unreliable to be published | Note F: too unreliable to be published | Note F: too unreliable to be published | Note F: too unreliable to be published | Note F: too unreliable to be published | 36Note E: Use with caution | 34Note E: Use with caution | 12Note E: Use with caution | Note F: too unreliable to be published | Note F: too unreliable to be published | Note F: too unreliable to be published | Note F: too unreliable to be published |
| 25 to 54 years (reference category) | 36 | 32 | 6Note E: Use with caution | Note F: too unreliable to be published | 18Note E: Use with caution | Note F: too unreliable to be published | Note F: too unreliable to be published | 15Note E: Use with caution | 50 | 21Note E: Use with caution | 11Note E: Use with caution | Note F: too unreliable to be published | 13Note E: Use with caution | 8Note E: Use with caution | 7Note E: Use with caution |
| 55 years or older | 25Note E: Use with caution | 30Note E: Use with caution | Note F: too unreliable to be published | 29Note E: Use with caution | Note F: too unreliable to be published | Note F: too unreliable to be published | Note F: too unreliable to be published | Note F: too unreliable to be published | Note F: too unreliable to be published | Note F: too unreliable to be published | Note F: too unreliable to be published | 41Note E: Use with caution | Note F: too unreliable to be published | Note F: too unreliable to be published | Note F: too unreliable to be published |
| Labour force status | |||||||||||||||
| Employed (reference category) | 47 | 21 | 11Note E: Use with caution | Note F: too unreliable to be published | 20Note E: Use with caution | Note F: too unreliable to be published | Note F: too unreliable to be published | 16Note E: Use with caution | 56 | 30Note E: Use with caution | 12Note E: Use with caution | Note F: too unreliable to be published | Note F: too unreliable to be published | 6Note E: Use with caution | Note F: too unreliable to be published |
| Unemployed | 21Note E: Use with cautionNote * | 58Note * | Note F: too unreliable to be published | Note F: too unreliable to be published | 20Note E: Use with caution | Note F: too unreliable to be published | Note F: too unreliable to be published | Note F: too unreliable to be published | 28Note E: Use with cautionNote * | 28Note E: Use with caution | 23Note E: Use with caution | Note F: too unreliable to be published | Note F: too unreliable to be published | Note F: too unreliable to be published | Note F: too unreliable to be published |
| Out of the labour force | 20Note E: Use with cautionNote * | 31Note * | 9Note E: Use with caution | 17Note E: Use with caution | 17Note E: Use with caution | Note F: too unreliable to be published | Note F: too unreliable to be published | Note F: too unreliable to be published | 31Note E: Use with cautionNote * | 17Note E: Use with caution | 7Note E: Use with caution | 22Note E: Use with caution | 13Note E: Use with caution | Note F: too unreliable to be published | 17Note E: Use with caution |
| Place of residence | |||||||||||||||
| Urban | 25Note E: Use with caution | 15Note E: Use with caution | Note F: too unreliable to be published | Note F: too unreliable to be published | 31Note E: Use with caution | Note F: too unreliable to be published | Note F: too unreliable to be published | Note F: too unreliable to be published | 34Note E: Use with caution | 44Note E: Use with caution | Note F: too unreliable to be published | Note F: too unreliable to be published | Note F: too unreliable to be published | Note F: too unreliable to be published | Note F: too unreliable to be published |
| Rural (reference category) | Note F: too unreliable to be published | Note F: too unreliable to be published | Note F: too unreliable to be published | Note F: too unreliable to be published | Note F: too unreliable to be published | Note F: too unreliable to be published | Note F: too unreliable to be published | Note F: too unreliable to be published | Note F: too unreliable to be published | Note F: too unreliable to be published | Note F: too unreliable to be published | Note F: too unreliable to be published | Note F: too unreliable to be published | Note F: too unreliable to be published | Note F: too unreliable to be published |
| Inuit Nunangat | 38 | 41 | 11 | 8Note E: Use with caution | 12 | 1Note E: Use with caution | Note F: too unreliable to be published | 10 | 46 | 15 | 14Note E: Use with caution | 8Note E: Use with caution | 12Note E: Use with caution | 7Note E: Use with caution | 13Note E: Use with caution |
|
E use with caution F too unreliable to be published
Source: Statistics Canada, Aboriginal Peoples Survey, 2012. |
|||||||||||||||
Employment in the wage economy has previously been shown to intersect with harvesting activities among Inuit.Note 3Note 53 As expected, employed Inuit (47%) were more than twice as likely to cite time constraints as the reason for non-participation as unemployed (21%Note E : use with caution) and out-of-the-labour-force Inuit (20%Note E : use with caution) (Table 11). Unemployed Inuit (58%) and, to a lesser extent, those out of the labour force (31%) were more likely than employed (21%) individuals to cite monetary reasons for non-participation. For gathering wild plants or berries, the pattern by labour force status was similar to that of hunting, fishing or trapping.
Factors associated with participation in harvesting activities among Inuit in Inuit Nunangat: labour force status and household composition matter
Examining socioeconomic and demographic characteristics of those who did and did not partake in harvesting offers insight into factors that are correlated with these activities. However, in order to better understand the interplay of factors, multivariate analysis was employed using the 2017 APS data. This enables an examination of the association of each factor while simultaneously accounting for other factors that could also be associated (e.g., does age remain a factor for participation when accounting for health and household income). Factors included in this analysis were remoteness, Inuit Nunangat region, sex, age group, health, household income, labour force status, household type and sense of belonging to Inuit culture and activities. These factors were chosen based on previous studies relating to harvesting activities among First Nations people, Métis and Inuit as well as bivariate analysis (data not shown). The role of other factors such as climate change, quotas, changes to policies relating to harvesting is not examined here due to data limitations. Since labour force status and level of education variables were considered in the analysis, it was restricted to those 25 years or older.
Among Inuit 25 years or older in Inuit Nunangat, remoteness of residence was not significantly associated with participation in hunting, fishing or trapping (Table 12). The remoteness index used here is based on proximity to and the size of the population (or service) agglomerations.Note 37 Also, Inuit Nunangat region was not significantly associated with participation suggesting that after accounting for other potential explanatory factors, the likelihood of hunting, fishing or trapping was not significantly different by Inuit Nunangat region.
Inuit men were more likely to hunt, fish or trap than women after accounting for other factors. Age and health were not significantly associated (marginally significant). Unemployed and out-of-the-labour-force Inuit were less likely to hunt, fish or trap than employed Inuit. Household income was not significantly associated with the likelihood of participation. In initial multivariate models, this factor was significantly associated, with participation increasing with increasing household income (appendix Table A.3). However, the inclusion of labour force status resulted in non-association with household income (appendix Table A.3).
| Predicted marginal (or odds ratioTable 12 Note 1) | 95% confidence interval | Risk ratioTable 12 Note 3 | ||
|---|---|---|---|---|
| Lower | Upper | |||
| Remoteness indexTable 12 Note 1 | 1.01 | 1.00 | 1.02 | Note ...: not applicable |
| percent | ratio | |||
| Inuit Nunangat regions | ||||
| Nunatsiavut | 69 | 65 | 73 | 1.06 |
| Nunavik | 68 | 63 | 72 | 1.03 |
| Inuvialuit region | 63 | 59 | 67 | 0.96 |
| Nunavut (reference category) | 66 | 61 | 69 | 1.00 |
| Sex | ||||
| Male | 75 | 71 | 78 | 1.27Note * |
| Female (reference category) | 59 | 55 | 63 | 1.00 |
| Adjusted after-tax household income quintilesTable 12 Note 2 | ||||
| Quintile 1 (poorest) | 68 | 61 | 74 | 1.02 |
| Quintile 2 | 61 | 55 | 67 | 0.92 |
| Quintile 3 | 65 | 59 | 71 | 0.98 |
| Quintile 4 | 71 | 65 | 76 | 1.07 |
| Quintile 5 (richest) (reference category) | 66 | 60 | 72 | 1.00 |
| Labour force status | ||||
| Employed (reference category) | 72 | 68 | 75 | 1.00 |
| Unemployed | 60 | 50 | 69 | 0.84Note * |
| Out of the labour force | 58 | 53 | 63 | 0.81Note * |
| Age group | ||||
| Working age adults (25-54 years) (reference category) | 67 | 64 | 70 | 1.00 |
| Older adults (55 years or older) | 63 | 59 | 67 | 0.94 |
| Health | ||||
| Excellent, very good or good | 68 | 64 | 71 | 1.10 |
| Fair or poor (reference category) | 61 | 55 | 67 | 1.00 |
| Household type | ||||
| Couple-headed family (reference category) | 69 | 66 | 72 | 1.00 |
| Male lone-parent family | 68 | 57 | 77 | 0.98 |
| Female lone-parent family | 52 | 44 | 60 | 0.75Note * |
| Spent time finding out more about Inuit history, traditions and culture |
||||
| Strongly agree | 72 | 67 | 76 | 1.1 |
| Agree | 64 | 59 | 68 | 0.98 |
| Neither agree nor disagree | 60 | 50 | 69 | 0.92 |
| Disagree | 60 | 52 | 68 | 0.93 |
| Strongly disagree (reference category) | 65 | 46 | 80 | 1.00 |
| Active in Inuit organizations, social events or cultural activities |
||||
| Strongly agree | 70 | 64 | 75 | 1.49Note * |
| Agree | 68 | 63 | 72 | 1.44Note * |
| Neither agree nor disagree | 64 | 54 | 73 | 1.37 |
| Disagree | 60 | 52 | 66 | 1.27 |
| Strongly disagree (reference category) | 47 | 30 | 64 | 1.00 |
... not applicable
|
||||
There is significant prior research on the relationship between household type and participation in the wage economy and harvesting activities among Inuit. Such research has suggested that there are Inuit households that are intensely engaged in harvesting and own relatively expensive equipment required for hunting in Inuit Nunangat. In contrast, female-headed households are less engaged in harvesting activities.Note 53 In the current analysis, the role of household type on likelihood of hunting, fishing or trapping was examined (Table 12). In line with previous evidence, those in female lone-parent families were less likely to hunt, fish or trap than couple-headed families (reference category). This was not the case for male lone-parent families.
Sense of belonging to Inuit culture and identity was assessed using several questions in the 2017 APS, two of which were used here based on preliminary analysis. Having spent time trying to find out more about Inuit history, traditions and culture was not associated with participation in hunting, fishing or trapping (Table 12). However, being active in Inuit organizations, social events or cultural activities was significantly associated. Participation in hunting, fishing or trapping appeared to increase with being active in Inuit organizations, social events or cultural activities (Table 12).
Inuit women were more likely to participate in wild plants or berry gathering than men after accounting for other factors (data not shown). Age, health, household income and household type were not associated with gathering. While remoteness was not associated with gathering, Inuit Nunangat region was associated with this activity. Compared to Inuit in Nunavut, those in the other three regions were more likely to gather wild plants or berries. Inuit who were not in the labour force were less likely than those employed to engage in this activity. Finally, being active in Inuit organizations, social events or cultural activities was positively associated with gathering.
Discussion
Data from four cycles of the APS spanning just under 20 years suggest a declining trend in participation in harvesting activities, in particular hunting, fishing or trapping, after 2006 among Inuit, specifically core working-age adults. A similar decline among Inuit in Ulukhaktok, Northwest Territories has been described elsewhere.Note 4 Among the reasons suggested for this decline include climatic changes resulting in decreasing sea ice thickness, increasing costs of living and harvesting, time constraints, generational changes, decreased transmission of environmental knowledge and hunting skills.Note 4 Environmental changes result in a smaller window of opportunity, increasing costs of precautionary measures and hunting in general, fewer animals, migration of animals, requirement of knowledge of geographic areas further away from the community, and an increase in predatory animalsNote 4 all of which are expected to have significant impact on harvesting activities. Associations with a lack of interest, poor health and school attendanceNote 3 and household type have also been previously suggested.Note 52
While many of the factors identified in previous studies could not be explored in the current study, the socioeconomic and demographic profile of Inuit across cycles of the APS and self-reported barriers offer some clues for the trends reported here. The increased participation in education and movement into urban areas outside Inuit Nunangat could be expected to lead to decreased access and time to devote to harvesting activities. However, it should be noted that higher levels of education completion may facilitate and hinder participation in harvesting activities at the same time. Higher levels of education are associated with being employed, which provides the financial means to harvest, but limits the time available for this activity. In line with this, among core working-age adults a decreasing trend was seen, and may be related to time constraints due to employment.
The multivariate analysis findings suggest that in addition to the expected association with sex, other factors including labour force status and household type were associated with participation. Those who were unemployed or not in the labour force were less likely to participate than those who were employed. The latter could be because a significant proportion (25%Note 51) of those not in the labour force are older adults who may have physical or financial limitations preventing them from engaging in these activities. Those in female lone-parent families were less likely to hunt, fish or trap than couple-headed families. The lack of access to harvesting activities among female-led households has been documented previously,Note 52 and is suggested to have significant implications for nutrition and food security among these households.Note 27 Hunting flexibility along with food sharing is one strategy that may temper the impact of the detrimental effects of climate change on food insecurityNote 55 among Inuit living in remote areas. Of particular significance was the association between being active in Inuit organizations, social events or cultural activities. The likelihood of participation increased with increasing degree of affirmation with participation in the above activities. It suggests another potential facilitator of harvesting activities among Inuit. However, it is unclear if respondents considered hunting, fishing or trapping to be “cultural activities” when responding to the questions.
Self-reported barriers complement and add to the picture of factors associated with harvesting activities among Inuit. The leading reasons for non-participation among those who were interested, included not having enough time or money, and location. Time constraints are typically associated with employment or school attendance which was reinforced here. That is, those who were employed were more than twice as likely to cite time constraints as those who were unemployed or out of the labour force. Monetary constraints may likely be related to employment as well. This is supported by the finding that unemployed and out-of-the-labour-force Inuit are more likely to cite money as a barrier than employed Inuit.
Taken together, these findings highlight the tension between participation in harvesting and the wage economy stemming from the rising cost of hunting and employment commitments.Note 4 Inuit who were employed were more likely to participate in hunting, fishing or trapping activities. However, they were also more likely to report not having enough time for these activities. Previously, it has been suggested that those employed in the wage economy have more financial ability to engage in harvesting activities, however, they are more vulnerable to risks relating to changing environmental conditions because they have less frequent time on the land and environment and a smaller knowledge and skills network on which to rely. In contrast, full-time hunters are better prepared for the variable environmental conditions but are vulnerable to economic and political changes influencing their participation.Note 56
How climate change is related to location-based barriers for the Inuit cannot be determined from these data. However, previous studies have suggested that Inuit increasingly have to go further into the land to find game today.Note 4 As a result, location and climate change, along with increased time and financial requirements are interconnected. A smaller proportion of Inuit (10%) who did not hunt, fish or trap also reported that the lack of a harvesting network or partner was a barrier.
For gathering wild plants or berries, a lower level of participation was seen in 2012 and 2017 compared to 2006. Decreasing levels of gathering in the two recent cycles could also be the result of engagement in the wage economy, school attendance or influences of climate change and variability.Note 57 Factors associated with gathering in the current analysis were sex, being out of the labour force, being active in Inuit organizations, social events or cultural activities, and Inuit Nunangat region. Inuit in Nunatsiavut and Nunavik were nearly twice as likely to gather as those in Nunavut (reference category) which could be related to the availability of vegetation and the short time window open for gathering in the region. Berry picking is limited to a short window in the spring and summer.Note 58 A small proportion of Inuit also cited fewer plants and berries available to gather which could be related to poorer quality of berries closer to communities, which are exposed to sewage lagoons, dumps and motorized vehicles and sometimes even mining activities.Note 57
Harvesting activities not only have an enormous historical and cultural significance, but they are also important to diet and nutrition. Challenges to harvesting are numerous as a result of climate, demographic and socioeconomic changes. It is reported that Inuit are suggested to be impacted the most because their mixed economies are strongly connected to affected lands and seas.Note 52 However, Inuit have shown a great capacity to adapt to these changing conditions.Note 4 Hunters are taking more precautionary measures, traveling in groups, and using technology more widely. They are also adapting to the changes in animal species available. Some households are enabling a few hunters to hunt full-time or get involved in organizing community hunts.Note 4 Others are responding by commercializing harvested meat by selling it to finance their hunting.Note 4 These examples are but a few ways the wage economy intersects with harvesting activities among Inuit. However, challenges to these adaptations continue to exist including financial and time constraints and lack of adequate funding for programs such as the Community Harvesters Assistance Program (CHAP).Note 4 To adequately support hunters in their efforts, there is a need for additional funding for and enhancement of existing initiatives.Note 26 Findings here and elsewhere could be used to inform the development of policies and programs to better support harvesting among Inuit, while adding to the existing body of literature on Inuit participation in these activities.
Limitations to the study
Time trend analysis
The data from the four cycles are cross-sectional in nature and represent snapshots in time. It may be ideal to track the same households over time to see if the level of harvesting activities has increased.Note 52 Even without considering differences in (i) response mobility, or the change in how Indigenous people identified themselves in different cycles, (ii) sampling frame, (ii) changes to questions and their placement, (iv) processing of the datasets, the cohorts are not identical. Often differences over time can be attributed to cohort effect or generational effects, which in this case could be conceptualized as variation in the generational factors that contribute to variation in participation. These variations would be expected to emerge even if there was no response mobility, no changes to sampling frame, etc.
How respondents answered the Aboriginal identity question may have changed from one Census to the next (those who reported Aboriginal identity or ancestry made up the sampling frames of the post-censal APS surveys). For example, one percent (representing approximately 220,000 individuals) who had identified as non-Aboriginal in the 2001 Census, identified as a First Nations person or Métis in 2006.Note 59 How they reported participation in harvesting activities was not investigated in this analysis. As a result, it is unknown if this “response mobility” may have biased trend estimates in some way. However, response mobility is not expected to be high among Inuit and is not expected to contribute to the bias.Note 60
How harvesting questions were asked varied by APS cycle. In 2001 and 2006, the APS queried respondents on hunting, fishing and trapping separately. However, in 2012 and 2016, a catch-all question asked respondents if they had hunted, fished or trapped. To make data comparable across APS cycles, the three questions on hunting, fishing or trapping were combined in the 2001 and 2006 datasets. A positive response to one of the three questions meant a positive response to hunting, fishing or trapping overall. It is possible that this may suggest a decline when it could be a survey effect.
In 2012, Aboriginal ancestry-only individuals were excluded from the APS sample in contrast to previous cycles. In addition, missing values to identity questions were imputed based on National Household Survey responses. While this is not expected to affect most of the identity groups because of the small number of non-responses to the identity questions, no comparison with the ancestry-only group from previous cycles can be made. However, to make datasets comparable, ancestry-only population was excluded from the 2001 and 2006 datasets.
Self-reporting biases in response to questions on traditional activities may differ from cycle to cycle with changes in legislation, policies, attitudes, etc.
The on-reserve First Nations population was not part of the APS sample in last three cycles, and was excluded from the 2001 dataset to make datasets comparable; hence prevalence estimates cannot be generalized to the entire First Nations population.
Other analysis
The APS data are not designed specifically to examine harvesting activities, hence there are some limitations to the analysis. For example, previous studies have examined the role of lack of knowledge or skills and the responsibilities of parenting in harvesting activities. Such data were not collected in the APS and hence these barriers were not examined. The data are based on self-reporting and may not reflect actual participation. Furthermore, respondents were asked about harvesting activities that occurred in the previous 12 months, and may be susceptible to recall bias.
Most of the data on barriers to participation or higher frequency of harvesting are from the 2012 APS. This data was not collected in 2017. Estimates of these may not reflect current barriers to participation.
In the multivariate analysis, the reference periods for socioeconomic and demographic factors are different from the reference period for participation in harvesting, which is the previous 12 months from when the survey was administered. For labour force status, the reference period was the week before survey date. Household income was obtained from administrative data linked to the 2016 Census of Population. Household type is based on responses to questions in the 2016 Census of Population. Finally, place of residence, which is used to identify level of remoteness and province, territory or Inuit Nunangat region, is based on residence at the time of the 2016 Census.
Multivariate analysis using logistic regressions identify associations between independent variables – in this case socioeconomic and demographic factors – and participation in harvesting activities. However, no causal relationships or directionality of relationship can be inferred from this analysis. In reviewing the associations, the limitation of shared method variance should be taken into account. Some of the factors in the analysis are based on self-reported data collected at a single point of time. Finally, the factors are inter-related, and the complex interplay between these factors in real life is not accounted for in the analysis.Note 61
Methods
Datasets
The 2001, 2006, 2012 and 2017 APS datasets were used for analysis on changes over time. For other analysis, the 2012 and 2017 APS datasets were used depending on the concepts used. For example, while participation in the past 12 months, frequency of participation and reasons for participation were available in the 2017 APS, perception of adequacy of time spent, non-participation among those interested, and reasons for non-participation were available in the 2012 APS.
For this analysis, the 1991 APS was excluded because there were no specific questions on harvesting in that cycle.
2001 APS
The target population comprised of adults and children living in private dwellings in the 10 provinces and three territories who are North American Indian, Métis or Inuit, and/or are a Treaty Indian or a Registered Indian as defined by the Indian Act of Canada and/or are members of an Indian Band or First Nation and/or who have Aboriginal ancestry. All residents of collective dwellings are excluded from the survey. It included an adult (15 years or older) and children’s (0 to 14 years) questionnaire that was conducted both on and off reserve.
The sampling frame for the 2001 APS was composed of all individuals who gave a positive answer to questions on Aboriginal identity, membership in an Indian Band/First Nation question, Treaty or Registered Indian status, or Aboriginal ancestry in the long-form of the 2001 Census. The data collection was conducted in two phases, with phase I focussing on the identity population and phase II on the ancestry-only population. Two sample designs were used, one for Aboriginal people living “on-community (n=41,609)” and another one for Aboriginal people living “off-community (n=18,890).” On-community residents included those living in 123 First Nations communities (reserves), 53 Inuit communities in Arctic regions, 38 communities with a minimum Aboriginal population of 250 with a concentration of 40% or more Aboriginal people (28 of these (including 8 Métis settlements in Alberta) have high concentrations of Métis people), and 5 additional communities with a large number of Aboriginal people (Prince Albert, North Battleford, Wood Buffalo, Yellowknife and Whitehorse). The response rates were 87.9% for the on-community part of phase I, 84.1% for the off-community part of phase I, and 68.6% for phase II.Note 62
2006 APS
The sampling frame of the 2006 APS was made up of respondents who provided a positive answer to questions on ethnic origin, identity, Indian band/First Nation membership or the Treaty or Registered Indian status in the long-form Census. Unlike the 1991 and 2001 APS, the 2006 APS excluded those living in Indian Settlements or on reserve. The adult APS had a sample size of 29,523 and a response rate of 78.9%.Note 63Note 64
2012 APS
The focus of the 2012 APS was education, employment and health. It also collected information on language, income, housing and mobility. The sample was derived from the 2011 National Household Survey (NHS) respondents who reported an Aboriginal identity or ancestry. Similar to the 2006 APS, the 2012 cycle excluded those who lived on reserve. The APS had a sample size of 28,409 and a response rate of 76%. For the first time, ancestry-only population was not the target population and were not covered.Note 64Note 65
2017 APS
The focus of the 2017 APS was transferable skills, practical training, use of information technology, Aboriginal language attainment, and participation in the Canadian economy. The survey also collected information on labour force, basic needs, mobility, housing, health and disability. The sample was selected from the 2016 Census of Population long-form respondents who reported an Aboriginal identity or ancestry, who made up the APS frame. The target population comprises adults and children living in private dwellings in the 10 provinces and three territories who are North American Indian, Métis or Inuit, and/or are a Treaty Indian or a Registered Indian as defined by the Indian Act of Canada and/or are members of an Indian Band or First Nation and/or who have Aboriginal ancestry. The response rate was 76%. The sample size of the APS was 24,220.Note 64Note 66
Analysis of time trends
In order to compare estimates over four cycles of the APS, some respondents and geographic areas were excluded. In the 2012 and 2017 APS, people living on Indian reserves and settlements and in certain First Nations communities in Yukon (22) and the Northwest Territories (24) were excluded. To make the 2001 and 2006 datasets comparable to the subsequent ones, respondents from the above communities were excluded from the datasets. Also, in 2012 and 2017, those who only reported Aboriginal ancestry and not identity were not included. These respondents were also excluded from the 2001 and 2006 datasets. Significant inter-cycle differences were identified using hypothesis testing. A decreasing or increasing trend was reported if significantly different estimates were seen in consecutive cycles, for example from 2006 to 2012, and 2012 to 2017.
Prevalence estimations
Prevalence estimates were computed as percentages of individuals who reported a characteristic such as having hunted, fished or trapped over the number of individuals who responded to the question using SAS-callable SUDAAN. Missing values (refusal, don’t know and not stated) were excluded from the denominator in these estimations. Variances and 95% confidence intervals were calculated using 1000 bootstrap weights. Estimates with a coefficient of variation (CV) greater than 33.3% were suppressed to ensure reliability. Estimates with a CV between 16.5% and 33.3% are presented with “E” to indicate that they should be used with caution.
Weighted estimates were generated separately by Indigenous identity (First Nations people living off reserve, Métis and Inuit). Those who reported multiple identities were included in all applicable groups. For example, respondents who reported both First Nations and Métis identities were included in both groups. As a result, the sum of these will not add up to the total. Estimates were also computed for Registered and non-Registered Indians. For each Indigenous group, estimates were calculated by sex, age group, province or territory, rural or urban, household type, labour force status and household income quintiles.
Significant differences were identified using hypothesis testing.
Multivariate analysis
Logistic regressions were used to identify potential associations between socioeconomic and demographic factors (independent variables or IVs) and participation in harvesting activities. IVs were chosen based on previous studies relating to harvesting activities among First Nations people, Métis and Inuit and bivariate analysis (data not shown). They were entered in blocks after forcing some into the model (sex, remoteness and, for Inuit analysis, Inuit Nunangat regions), that is they were retained in the model regardless of significance of association. Block 1 included the forced IVs and labour force status and household income after tax, adjusted for household size. This was because numerous previous studies have alluded to the role of participation in the wage economy and resource intensive nature of harvesting.Note 3Note 4 In block 2, age group and self-reported health were entered. These are based on reports of poor health being a barrier to engaging in harvesting activities.Note 3 Finally, in some models, household type was included based on findings that lone parent families, particularly female lone-parent families, are less likely to participate in harvesting.Note 52Note 53 Blocks added in a model were retained in subsequent models; the final model adjusted for IVs in all three blocks. This analysis was restricted to those 25 years or older since level of education and labour force status were considered as one of the IVs. Independent analysis was carried out for each Aboriginal group.
Variables
Self-reported Status Indian identity
All APS respondents were asked if they were a Status Indian, that is, a Registered or Treaty Indian as defined by the Indian Act of Canada. A variable was created that assigned a Status Indian identity to all respondents even if they did not identify as a First Nations person. For example, those who self-identified as Métis and Status Indian were categorized as Status Indians.
Population centres
Rural areas are geographic areas with a population of less than 1000 people. Those with greater populations are classified as small (1000 to 29,999), medium (30,000 to 99,999) and large (100,000 or more) population centres. For this analysis, all population centres were assigned urban status.
Age groups
Questions on harvesting activities were asked of all APS respondents 15 years or older. For this analysis, three age groups were created: 15 to 24 years (youth and young adults), 25 to 54 years (core working-age adults) and 55 years or older (older adults).
Labour force status
All respondents were assigned to one of three categories of employed, unemployed or out of the labour force based on their responses to several questions on labour market activities using a floating reference week. This was because the survey was conducted over a seven-month period (January 16, 2017 to August 15, 2017). The reference week was the most recently completed seven-day period beginning on a Sunday and ending on the following Saturday.
Household income quintiles
Separate household income quintiles were generated for First Nations people living off reserve, Métis and Inuit using after-tax household income adjusted for household size. Income was obtained from administrative data linked to the 2016 Census of Population. The after-tax income of a household is the sum of the after-tax incomes of all members of that household.
Good health
Respondents to the APS were asked to self-rate their health as excellent, very good, good, fair or poor. For this analysis, excellent, very good and good health were coded together to represent good health, and fair and poor health were coded together to represent poor health.
Household type
The 2016 Census-based economic family-level variable, which had 20 categories for different economic family types, was recoded to derive a household type variable with these categories: couple-headed with or without children, male lone-parent family, and female lone-parent family.
Remoteness index
A remoteness index was developed by Alasia et al.Note 37 in 2017 to classify all Census subdivisions (CSDs) in Canada by remoteness. This was based on the principle of a gravity model accounting for proximity to and the size of the population agglomerations. The index is in continuous form ranging from 0 to 1. On this scale, Toronto has a value of 0 and Grise Fiord has value of 1. For use in the multivariate analysis here, this was converted into a 0 to 100 scale to enable ease of interpretation. This index was originally computed for 2011 CSDs, and was updated for the 2016 CSDs. No values were assigned to 37 CSDs without a population.
Inuit Nunangat regions
Estimates for the four Inuit Nunangat regions are identified: Nunatsiavut, Nunavik, Nunavut and the Inuvialuit region. It should be noted that the boundaries of the Inuvialuit region are based on Census subdivisions, and may not match the boundaries of Inuvialuit Settlement Region (ISR).
Appendix
| Block 1 | Block 2 | Block 3 | Block 4 | |||||||||
|---|---|---|---|---|---|---|---|---|---|---|---|---|
| Beta coefficient | Standard error | p-value | Beta coefficient | Standard error | p-value | Beta coefficient | Standard error | p-value | Beta coefficient | Standard error | p-value | |
| Intercept | -1.12 | 0.11 | 0.000 | -1.26 | 0.16 | 0.000 | -1.18 | 0.17 | 0.000 | -1.90 | -1.28 | 0.000 |
| Remoteness indexTable A.1 Note 1 | 0.03 | 0.00 | 0.000 | 0.03 | 0.00 | 0.000 | 0.03 | 0.00 | 0.000 | 0.03 | 0.03 | 0.000 |
| Sex | ||||||||||||
| Male | 0.69 | 0.08 | 0.000 | 0.70 | 0.08 | 0.000 | 0.69 | 0.09 | 0.000 | 0.79 | 0.97 | 0.000 |
| Female (reference category) | 0.00 | 0.00 | Note ...: not applicable | 0.00 | Note ...: not applicable | Note ...: not applicable | 0.00 | 0.00 | Note ...: not applicable | 0.00 | 0.00 | Note ...: not applicable |
| Adjusted after-tax household income quintilesTable A.1 Note 2 | ||||||||||||
| Quintile 1 (poorest) | -0.72 | 0.15 | 0.000 | -0.69 | 0.15 | 0.000 | -0.67 | 0.20 | 0.001 | -0.74 | -0.34 | 0.000 |
| Quintile 2 | -0.65 | 0.13 | 0.000 | -0.63 | 0.13 | 0.000 | -0.55 | 0.15 | 0.000 | -0.57 | -0.28 | 0.000 |
| Quintile 3 | -0.36 | 0.12 | 0.003 | -0.34 | 0.12 | 0.004 | -0.36 | 0.13 | 0.004 | -0.34 | -0.08 | 0.009 |
| Quintile 4 | -0.15 | 0.11 | 0.189 | -0.14 | 0.11 | 0.219 | -0.12 | 0.12 | 0.321 | -0.13 | 0.11 | 0.285 |
| Quintile 5 (richest) (reference category) | 0.00 | 0.00 | Note ...: not applicable | 0.00 | 0.00 | Note ...: not applicable | 0.00 | 0.00 | Note ...: not applicable | 0.00 | 0.00 | Note ...: not applicable |
| Labour force status | ||||||||||||
| Employed (reference category) | 0.00 | 0.00 | Note ...: not applicable | 0.00 | 0.00 | Note ...: not applicable | 0.00 | 0.00 | Note ...: not applicable | 0.00 | 0.00 | Note ...: not applicable |
| Unemployed | -0.18 | 0.16 | 0.236 | -0.20 | 0.16 | 0.193 | -0.04 | 0.19 | 0.844 | -0.05 | 0.32 | 0.779 |
| Out of the labour force | -0.52 | 0.09 | 0.000 | -0.40 | 0.10 | 0.000 | -0.22 | 0.12 | 0.057 | -0.17 | 0.06 | 0.148 |
| Age group | ||||||||||||
| Working age adults (25-54 years) (reference category) | Note ...: not applicable | Note ...: not applicable | Note ...: not applicable | 0.00 | 0.00 | Note ...: not applicable | 0.00 | 0.00 | Note ...: not applicable | 0.00 | 0.00 | Note ...: not applicable |
| Older adults (55 years or older) | Note ...: not applicable | Note ...: not applicable | Note ...: not applicable | -0.23 | 0.09 | 0.012 | -0.34 | 0.10 | 0.001 | -0.36 | -0.16 | 0.001 |
| Health | ||||||||||||
| Excellent, very good or good | Note ...: not applicable | Note ...: not applicable | Note ...: not applicable | 0.18 | 0.11 | 0.085 | 0.17 | 0.12 | 0.153 | 0.15 | 0.39 | 0.218 |
| Fair or poor (reference category) | Note ...: not applicable | Note ...: not applicable | Note ...: not applicable | 0.00 | 0.00 | Note ...: not applicable | 0.00 | 0.00 | Note ...: not applicable | 0.00 | 0.00 | Note ...: not applicable |
| Household type | ||||||||||||
| Couple-headed family (reference category) | Note ...: not applicable | Note ...: not applicable | Note ...: not applicable | Note ...: not applicable | Note ...: not applicable | Note ...: not applicable | 0.00 | 0.00 | Note ...: not applicable | 0.00 | 0.00 | Note ...: not applicable |
| Male lone-parent family | Note ...: not applicable | Note ...: not applicable | Note ...: not applicable | Note ...: not applicable | Note ...: not applicable | Note ...: not applicable | -0.19 | 0.23 | 0.411 | -0.29 | 0.17 | 0.218 |
| Female lone-parent family | Note ...: not applicable | Note ...: not applicable | Note ...: not applicable | Note ...: not applicable | Note ...: not applicable | Note ...: not applicable | -0.47 | 0.15 | 0.002 | -0.47 | -0.17 | 0.002 |
| Spent time finding out more about First Nations history, traditions and culture |
||||||||||||
| Strongly agree | Note ...: not applicable | Note ...: not applicable | Note ...: not applicable | Note ...: not applicable | Note ...: not applicable | Note ...: not applicable | Note ...: not applicable | Note ...: not applicable | Note ...: not applicable | 0.59 | 1.19 | 0.052 |
| Agree | Note ...: not applicable | Note ...: not applicable | Note ...: not applicable | Note ...: not applicable | Note ...: not applicable | Note ...: not applicable | Note ...: not applicable | Note ...: not applicable | Note ...: not applicable | 0.51 | 1.09 | 0.081 |
| Neither agree nor disagree | Note ...: not applicable | Note ...: not applicable | Note ...: not applicable | Note ...: not applicable | Note ...: not applicable | Note ...: not applicable | Note ...: not applicable | Note ...: not applicable | Note ...: not applicable | 0.55 | 1.28 | 0.134 |
| Disagree | Note ...: not applicable | Note ...: not applicable | Note ...: not applicable | Note ...: not applicable | Note ...: not applicable | Note ...: not applicable | Note ...: not applicable | Note ...: not applicable | Note ...: not applicable | 0.23 | 0.84 | 0.469 |
| Strongly disagree (reference category) | Note ...: not applicable | Note ...: not applicable | Note ...: not applicable | Note ...: not applicable | Note ...: not applicable | Note ...: not applicable | Note ...: not applicable | Note ...: not applicable | Note ...: not applicable | 0.00 | 0.00 | Note ...: not applicable |
| Active in First Nations organizations, social events or cultural activities |
||||||||||||
| Strongly agree | Note ...: not applicable | Note ...: not applicable | Note ...: not applicable | Note ...: not applicable | Note ...: not applicable | Note ...: not applicable | Note ...: not applicable | Note ...: not applicable | Note ...: not applicable | 0.72 | 1.16 | 0.002 |
| Agree | Note ...: not applicable | Note ...: not applicable | Note ...: not applicable | Note ...: not applicable | Note ...: not applicable | Note ...: not applicable | Note ...: not applicable | Note ...: not applicable | Note ...: not applicable | 0.55 | 0.93 | 0.005 |
| Neither agree nor disagree | Note ...: not applicable | Note ...: not applicable | Note ...: not applicable | Note ...: not applicable | Note ...: not applicable | Note ...: not applicable | Note ...: not applicable | Note ...: not applicable | Note ...: not applicable | 0.26 | 0.73 | 0.279 |
| Disagree | Note ...: not applicable | Note ...: not applicable | Note ...: not applicable | Note ...: not applicable | Note ...: not applicable | Note ...: not applicable | Note ...: not applicable | Note ...: not applicable | Note ...: not applicable | 0.01 | 0.38 | 0.978 |
| Strongly disagree (reference category) | Note ...: not applicable | Note ...: not applicable | Note ...: not applicable | Note ...: not applicable | Note ...: not applicable | Note ...: not applicable | Note ...: not applicable | Note ...: not applicable | Note ...: not applicable | 0.00 | 0.00 | Note ...: not applicable |
... not applicable
Source: Statistics Canada, Aboriginal Peoples Survey, 2017. |
||||||||||||
| Block 1 | Block 2 | Block 3 | |||||||
|---|---|---|---|---|---|---|---|---|---|
| Beta coefficient | Standard error | p-value | Beta coefficient | Standard error | p-value | Beta coefficient | Standard error | p-value | |
| Intercept | -1.58 | 0.11 | 0.000 | -1.79 | 0.15 | 0.000 | -2.05 | 0.25 | 0.000 |
| Remoteness indexTable A.2 Note 1 | 0.04 | 0.00 | 0.000 | 0.04 | 0.00 | 0.000 | 0.03 | 0.00 | 0.000 |
| Sex | |||||||||
| Male | 1.02 | 0.08 | 0.000 | 1.04 | 0.08 | 0.000 | 1.09 | 0.08 | 0.000 |
| Female (reference category) | 0.00 | 0.00 | Note ...: not applicable | 0.00 | 0.00 | Note ...: not applicable | 0.00 | 0.00 | Note ...: not applicable |
| Adjusted after-tax household income quintilesTable A.2 Note 2 | |||||||||
| Quintile 1 (poorest) | -0.55 | 0.13 | 0.000 | -0.48 | 0.13 | 0.000 | -0.46 | 0.13 | 0.001 |
| Quintile 2 | -0.35 | 0.12 | 0.004 | -0.31 | 0.12 | 0.012 | -0.30 | 0.12 | 0.015 |
| Quintile 3 | -0.19 | 0.12 | 0.109 | -0.17 | 0.12 | 0.149 | -0.16 | 0.12 | 0.191 |
| Quintile 4 | 0.05 | 0.11 | 0.619 | 0.06 | 0.11 | 0.557 | 0.09 | 0.11 | 0.438 |
| Quintile 5 (richest) (reference category) | 0.00 | 0.00 | Note ...: not applicable | 0.00 | 0.00 | Note ...: not applicable | 0.00 | 0.00 | Note ...: not applicable |
| Labour force status | |||||||||
| Employed (reference category) | 0.00 | 0.00 | Note ...: not applicable | 0.00 | 0.00 | Note ...: not applicable | 0.00 | 0.00 | Note ...: not applicable |
| Unemployed | -0.23 | 0.16 | 0.156 | -0.21 | 0.17 | 0.203 | -0.32 | 0.17 | 0.066 |
| Out of the labour force | -0.48 | 0.08 | 0.000 | -0.28 | 0.09 | 0.002 | -0.25 | 0.10 | 0.009 |
| Age group | |||||||||
| Working age adults (25-54 years) (reference category) | Note ...: not applicable | Note ...: not applicable | Note ...: not applicable | 0.00 | 0.00 | Note ...: not applicable | 0.00 | 0.00 | Note ...: not applicable |
| Older adults (55 years or older) | Note ...: not applicable | Note ...: not applicable | Note ...: not applicable | -0.29 | 0.08 | 0.000 | -0.37 | 0.08 | 0.000 |
| Health | |||||||||
| Excellent, very good or good | Note ...: not applicable | Note ...: not applicable | Note ...: not applicable | 0.26 | 0.10 | 0.010 | 0.29 | 0.10 | 0.006 |
| Fair or poor (reference category) | Note ...: not applicable | Note ...: not applicable | Note ...: not applicable | 0.00 | 0.00 | Note ...: not applicable | 0.00 | 0.00 | Note ...: not applicable |
| Spent time finding out more about Métis history, traditions and culture |
|||||||||
| Strongly agree | Note ...: not applicable | Note ...: not applicable | Note ...: not applicable | Note ...: not applicable | Note ...: not applicable | Note ...: not applicable | -0.11 | 0.25 | 0.668 |
| Agree | Note ...: not applicable | Note ...: not applicable | Note ...: not applicable | Note ...: not applicable | Note ...: not applicable | Note ...: not applicable | -0.13 | 0.23 | 0.583 |
| Neither agree nor disagree | Note ...: not applicable | Note ...: not applicable | Note ...: not applicable | Note ...: not applicable | Note ...: not applicable | Note ...: not applicable | -0.50 | 0.31 | 0.112 |
| Disagree | Note ...: not applicable | Note ...: not applicable | Note ...: not applicable | Note ...: not applicable | Note ...: not applicable | Note ...: not applicable | -0.57 | 0.25 | 0.023 |
| Strongly disagree (reference category) | Note ...: not applicable | Note ...: not applicable | Note ...: not applicable | Note ...: not applicable | Note ...: not applicable | Note ...: not applicable | 0.00 | 0.00 | Note ...: not applicable |
| Active in Métis organizations, social events or cultural activities |
|||||||||
| Strongly agree | Note ...: not applicable | Note ...: not applicable | Note ...: not applicable | Note ...: not applicable | Note ...: not applicable | Note ...: not applicable | 0.82 | 0.22 | 0.000 |
| Agree | Note ...: not applicable | Note ...: not applicable | Note ...: not applicable | Note ...: not applicable | Note ...: not applicable | Note ...: not applicable | 0.76 | 0.16 | 0.000 |
| Neither agree nor disagree | Note ...: not applicable | Note ...: not applicable | Note ...: not applicable | Note ...: not applicable | Note ...: not applicable | Note ...: not applicable | 0.58 | 0.20 | 0.003 |
| Disagree | Note ...: not applicable | Note ...: not applicable | Note ...: not applicable | Note ...: not applicable | Note ...: not applicable | Note ...: not applicable | 0.45 | 0.15 | 0.003 |
| Strongly disagree (reference category) | Note ...: not applicable | Note ...: not applicable | Note ...: not applicable | Note ...: not applicable | Note ...: not applicable | Note ...: not applicable | 0.00 | 0.00 | Note ...: not applicable |
... not applicable
Source: Statistics Canada, Aboriginal Peoples Survey, 2017. |
|||||||||
| Block 1 | Block 2 | Block 3 | Block 4 | Block 5 | |||||||||||
|---|---|---|---|---|---|---|---|---|---|---|---|---|---|---|---|
| Beta coefficient | Standard error | p-value | Beta coefficient | Standard error | p-value | Beta coefficient | Standard error | p-value | Beta coefficient | Standard error | p-value | Beta coefficient | Standard error | p-value | |
| Intercept | 0.31 | 0.29 | 0.289 | 0.37 | 0.30 | 0.218 | -0.03 | 0.33 | 0.931 | -0.08 | 0.35 | 0.823 | -0.90 | 0.56 | 0.109 |
| Remoteness indexTable A.3 Note 1 | 0.00 | 0.00 | 0.298 | 0.01 | 0.00 | 0.150 | 0.01 | 0.00 | 0.104 | 0.01 | 0.00 | 0.065 | 0.01 | 0.00 | 0.109 |
| Inuit Nunangat region | |||||||||||||||
| Nunatsiavut | 0.13 | 0.12 | 0.279 | 0.13 | 0.12 | 0.314 | 0.12 | 0.12 | 0.343 | 0.08 | 0.13 | 0.550 | 0.19 | 0.15 | 0.220 |
| Nunavik | -0.06 | 0.12 | 0.628 | -0.12 | 0.13 | 0.355 | -0.15 | 0.13 | 0.220 | -0.02 | 0.14 | 0.877 | 0.12 | 0.16 | 0.462 |
| Nunavut | -0.26 | 0.11 | 0.016 | -0.26 | 0.11 | 0.018 | -0.26 | 0.11 | 0.018 | -0.22 | 0.12 | 0.068 | -0.12 | 0.13 | 0.371 |
| Inuvialuit region | 0.00 | 0.00 | Note ...: not applicable | 0.00 | 0.00 | Note ...: not applicable | 0.00 | 0.00 | Note ...: not applicable | 0.00 | 0.00 | Note ...: not applicable | 0.00 | 0.00 | Note ...: not applicable |
| Sex | |||||||||||||||
| Male | 0.67 | 0.11 | 0.000 | 0.68 | 0.11 | 0.000 | 0.66 | 0.11 | 0.000 | 0.69 | 0.13 | 0.00 | 0.81 | 0.14 | 0.000 |
| Female (reference category) | 0.00 | 0.00 | Note ...: not applicable | 0.00 | 0.00 | Note ...: not applicable | 0.00 | 0.00 | Note ...: not applicable | 0.00 | 0.00 | Note ...: not applicable | 0.00 | 0.00 | Note ...: not applicable |
| Adjusted after-tax household income quintilesTable A.3 Note 2 | |||||||||||||||
| Quintile 1 (poorest) | -0.72 | 0.18 | 0.000 | -0.45 | 0.19 | 0.017 | -0.39 | 0.19 | 0.041 | 0.13 | 0.22 | 0.547 | 0.07 | 0.23 | 0.754 |
| Quintile 2 | -0.48 | 0.18 | 0.007 | -0.28 | 0.18 | 0.122 | -0.27 | 0.18 | 0.142 | -0.19 | 0.20 | 0.334 | -0.25 | 0.21 | 0.231 |
| Quintile 3 | -0.37 | 0.19 | 0.048 | -0.27 | 0.19 | 0.141 | -0.27 | 0.18 | 0.140 | -0.12 | 0.19 | 0.520 | -0.07 | 0.21 | 0.752 |
| Quintile 4 | 0.08 | 0.20 | 0.701 | 0.16 | 0.20 | 0.432 | 0.19 | 0.20 | 0.346 | 0.24 | 0.20 | 0.241 | 0.23 | 0.22 | 0.295 |
| Quintile 5 (richest) (reference category) | 0.00 | 0.00 | Note ...: not applicable | 0.00 | 0.00 | Note ...: not applicable | 0.00 | 0.00 | Note ...: not applicable | 0.00 | 0.00 | Note ...: not applicable | 0.00 | 0.00 | Note ...: not applicable |
| Labour force status | |||||||||||||||
| Employed (reference category) | Note ...: not applicable | Note ...: not applicable | Note ...: not applicable | 0.00 | 0.00 | Note ...: not applicable | 0.00 | 0.00 | Note ...: not applicable | 0.00 | 0.00 | Note ...: not applicable | 0.00 | 0.00 | Note ...: not applicable |
| Unemployed | Note ...: not applicable | Note ...: not applicable | Note ...: not applicable | -0.35 | 0.20 | 0.087 | -0.39 | 0.21 | 0.067 | -0.51 | 0.23 | 0.026 | -0.58 | 0.24 | 0.016 |
| Out of the labour force | Note ...: not applicable | Note ...: not applicable | Note ...: not applicable | -0.66 | 0.13 | 0.000 | -0.61 | 0.13 | 0.000 | -0.70 | 0.14 | 0.000 | -0.66 | 0.15 | 0.000 |
| Age group | |||||||||||||||
| Working age adults (25-54 years) (reference category) | Note ...: not applicable | Note ...: not applicable | Note ...: not applicable | Note ...: not applicable | Note ...: not applicable | Note ...: not applicable | 0.00 | 0.00 | Note ...: not applicable | 0.00 | 0.00 | Note ...: not applicable | 0.00 | 0.00 | Note ...: not applicable |
| Older adults (55 years or older) | Note ...: not applicable | Note ...: not applicable | Note ...: not applicable | Note ...: not applicable | Note ...: not applicable | Note ...: not applicable | -0.15 | 0.11 | 0.169 | -0.06 | 0.12 | 0.576 | -0.21 | 0.13 | 0.097 |
| Health | |||||||||||||||
| Excellent, very good or good | Note ...: not applicable | Note ...: not applicable | Note ...: not applicable | Note ...: not applicable | Note ...: not applicable | Note ...: not applicable | 0.46 | 0.14 | 0.001 | 0.44 | 0.15 | 0.003 | 0.31 | 0.16 | 0.053 |
| Fair or poor (reference category) | Note ...: not applicable | Note ...: not applicable | Note ...: not applicable | Note ...: not applicable | Note ...: not applicable | Note ...: not applicable | 0.00 | 0.00 | Note ...: not applicable | 0.00 | 0.00 | Note ...: not applicable | 0.00 | 0.00 | Note ...: not applicable |
| Household type | |||||||||||||||
| Couple-headed family (reference category) | Note ...: not applicable | Note ...: not applicable | Note ...: not applicable | Note ...: not applicable | Note ...: not applicable | Note ...: not applicable | Note ...: not applicable | Note ...: not applicable | Note ...: not applicable | 0.00 | 0.00 | Note ...: not applicable | 0.00 | 0.00 | Note ...: not applicable |
| Male lone-parent family | Note ...: not applicable | Note ...: not applicable | Note ...: not applicable | Note ...: not applicable | Note ...: not applicable | Note ...: not applicable | Note ...: not applicable | Note ...: not applicable | Note ...: not applicable | -0.31 | 0.26 | 0.232 | -0.06 | 0.27 | 0.828 |
| Female lone-parent family | Note ...: not applicable | Note ...: not applicable | Note ...: not applicable | Note ...: not applicable | Note ...: not applicable | Note ...: not applicable | Note ...: not applicable | Note ...: not applicable | Note ...: not applicable | -0.75 | 0.19 | 0.000 | -0.79 | 0.20 | 0.000 |
| Spent time finding out more about Inuit history, traditions and culture |
|||||||||||||||
| Strongly agree | Note ...: not applicable | Note ...: not applicable | Note ...: not applicable | Note ...: not applicable | Note ...: not applicable | Note ...: not applicable | Note ...: not applicable | Note ...: not applicable | Note ...: not applicable | Note ...: not applicable | Note ...: not applicable | Note ...: not applicable | 0.35 | 0.46 | 0.450 |
| Agree | Note ...: not applicable | Note ...: not applicable | Note ...: not applicable | Note ...: not applicable | Note ...: not applicable | Note ...: not applicable | Note ...: not applicable | Note ...: not applicable | Note ...: not applicable | Note ...: not applicable | Note ...: not applicable | Note ...: not applicable | -0.07 | 0.46 | 0.879 |
| Neither agree nor disagree | Note ...: not applicable | Note ...: not applicable | Note ...: not applicable | Note ...: not applicable | Note ...: not applicable | Note ...: not applicable | Note ...: not applicable | Note ...: not applicable | Note ...: not applicable | Note ...: not applicable | Note ...: not applicable | Note ...: not applicable | -0.25 | 0.49 | 0.609 |
| Disagree | Note ...: not applicable | Note ...: not applicable | Note ...: not applicable | Note ...: not applicable | Note ...: not applicable | Note ...: not applicable | Note ...: not applicable | Note ...: not applicable | Note ...: not applicable | Note ...: not applicable | Note ...: not applicable | Note ...: not applicable | -0.22 | 0.48 | 0.644 |
| Strongly disagree (reference category) | Note ...: not applicable | Note ...: not applicable | Note ...: not applicable | Note ...: not applicable | Note ...: not applicable | Note ...: not applicable | Note ...: not applicable | Note ...: not applicable | Note ...: not applicable | Note ...: not applicable | Note ...: not applicable | Note ...: not applicable | 0.00 | 0.00 | Note ...: not applicable |
| Active in Inuit organizations, social events or cultural activities |
|||||||||||||||
| Strongly agree | Note ...: not applicable | Note ...: not applicable | Note ...: not applicable | Note ...: not applicable | Note ...: not applicable | Note ...: not applicable | Note ...: not applicable | Note ...: not applicable | Note ...: not applicable | Note ...: not applicable | Note ...: not applicable | Note ...: not applicable | 1.08 | 0.43 | 0.012 |
| Agree | Note ...: not applicable | Note ...: not applicable | Note ...: not applicable | Note ...: not applicable | Note ...: not applicable | Note ...: not applicable | Note ...: not applicable | Note ...: not applicable | Note ...: not applicable | Note ...: not applicable | Note ...: not applicable | Note ...: not applicable | 0.96 | 0.42 | 0.023 |
| Neither agree nor disagree | Note ...: not applicable | Note ...: not applicable | Note ...: not applicable | Note ...: not applicable | Note ...: not applicable | Note ...: not applicable | Note ...: not applicable | Note ...: not applicable | Note ...: not applicable | Note ...: not applicable | Note ...: not applicable | Note ...: not applicable | 0.81 | 0.47 | 0.084 |
| Disagree | Note ...: not applicable | Note ...: not applicable | Note ...: not applicable | Note ...: not applicable | Note ...: not applicable | Note ...: not applicable | Note ...: not applicable | Note ...: not applicable | Note ...: not applicable | Note ...: not applicable | Note ...: not applicable | Note ...: not applicable | 0.58 | 0.44 | 0.186 |
| Strongly disagree (reference category) | Note ...: not applicable | Note ...: not applicable | Note ...: not applicable | Note ...: not applicable | Note ...: not applicable | Note ...: not applicable | Note ...: not applicable | Note ...: not applicable | Note ...: not applicable | Note ...: not applicable | Note ...: not applicable | Note ...: not applicable | 0.00 | 0.00 | Note ...: not applicable |
... not applicable
Source: Statistics Canada, Aboriginal Peoples Survey, 2017. |
|||||||||||||||
- Date modified: