
Environmental Thematic Maps and Graphics:
Average annual water yield per area, by ecoprovince, 1971 to 2014

Archived Content
Information identified as archived is provided for reference, research or recordkeeping purposes. It is not subject to the Government of Canada Web Standards and has not been altered or updated since it was archived. Please "contact us" to request a format other than those available.
Text begins
Description for Map
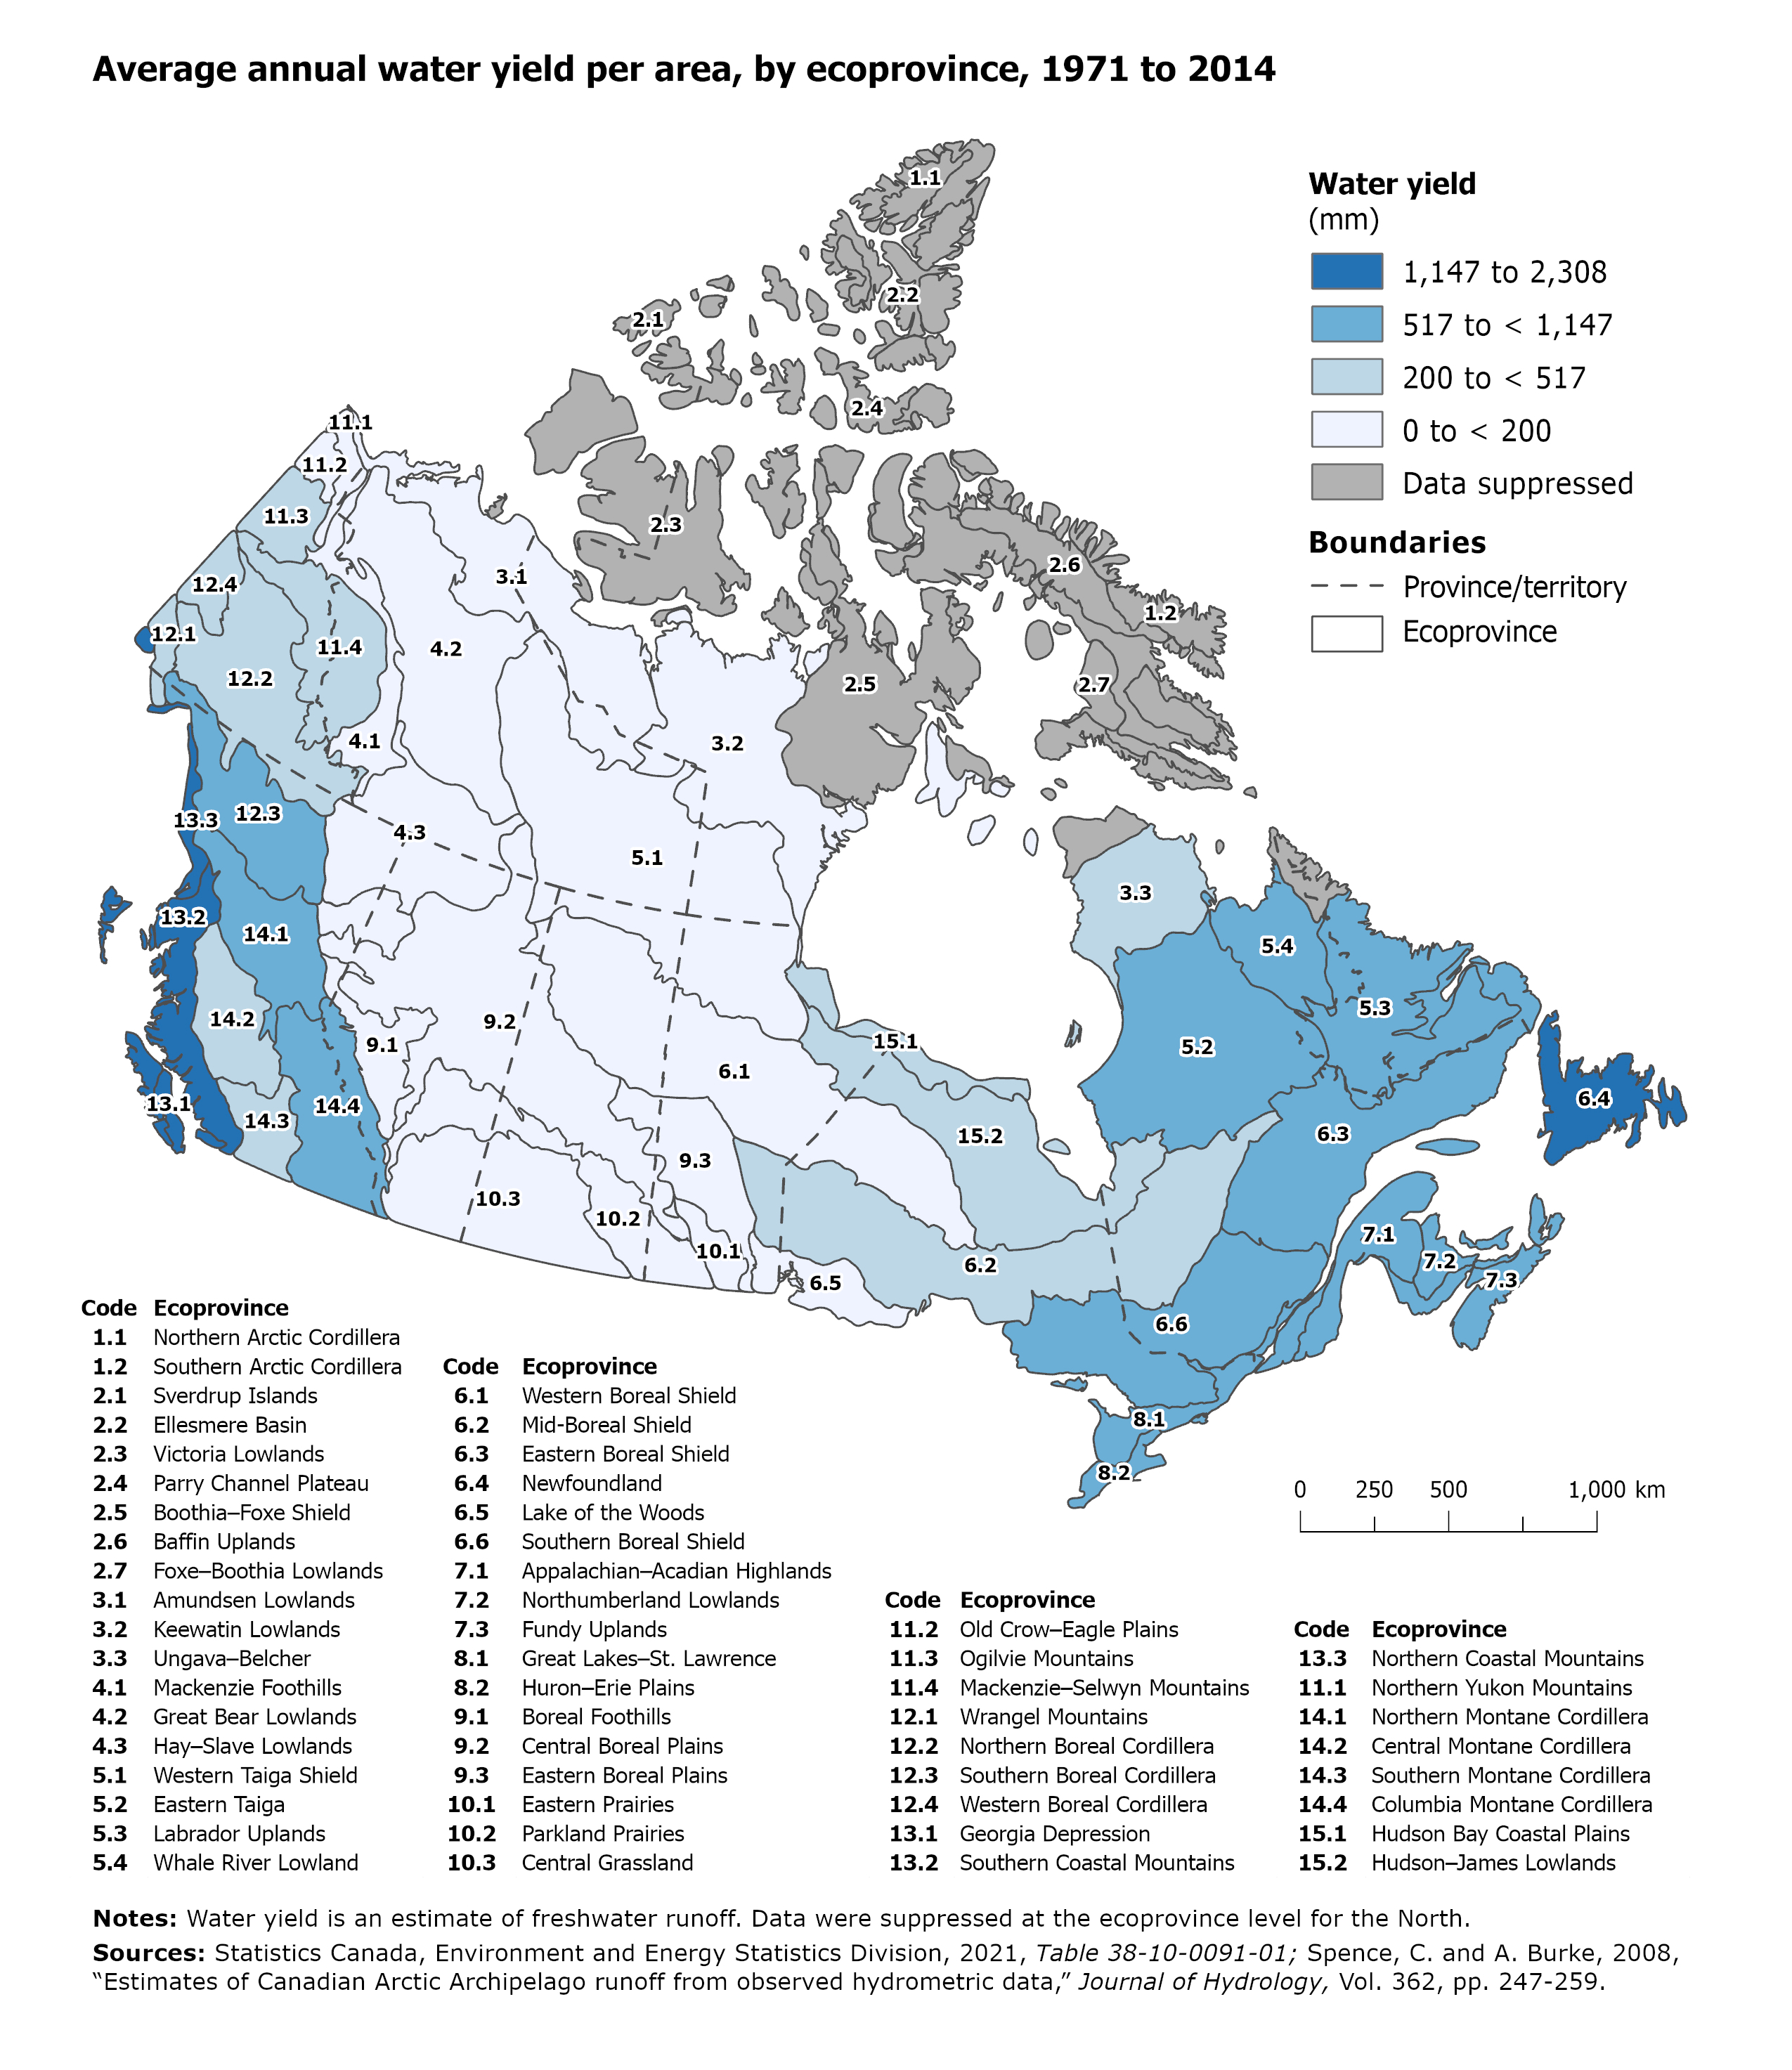
The title of this map is “Average annual water yield per area, by ecoprovince, 1971 to 2014.” This map provides a visual representation of the average annual water yield in Canada.
On the page, there is one large map of Canada, a legend to the upper right and a scale bar below. The map delineates ecoprovinces with a thin black boundary line and ecoprovinces are labeled with a code. Fine black dashed lines show provincial and territorial boundaries. Below the map, ecoprovince codes and their corresponding names are listed for reference.
The map shows average annual water yield symbolized by different shades of blue. The lowest water yield is shown as light blue, while the highest water yield is shown as deep blue.
The unit of measurement is millimetres (mm). The legend contains five categories: 1,147 to 2,308 (dark blue), 517 to less than 1,147 (blue), 200 to less than 517 (light blue), 0 to less than 200 (pale light blue), and data suppressed (grey).
The map shows that the average annual water yield is higher on the coasts, and lower in the interior of the country. Data has been suppressed in most of the far north.
Notes: Water yield is an estimate of freshwater runoff. Data were suppressed at the ecoprovince level for the North.
Sources:
Statistics Canada, Environment and Energy Statistics Division, 2021, Table 38-10-0091-01, https://www150.statcan.gc.ca/t1/tbl1/en/tv.action?pid=3810009101 (accessed December 17, 2020);
Spence, C. and A. Burke, 2008, “Estimates of Canadian Arctic Archipelago runoff from observed hydrometric data,” Journal of Hydrology, Vol. 362, pp. 247-259.
| Colour | Average water yield (mm) |
|---|---|
| Dark blue | 1,147 to 2,308 |
| Blue | 517 to less than 1,147 |
| Light blue | 200 to less than 517 |
| Pale light blue | 0 to less than 200 |
| Grey | Data suppressed |
| Shape | Boundary |
| Dashed line | Province/territory |
| Black outline | Ecoprovince |
| Ecoprovince | Code | mm |
|---|---|---|
| Northern Arctic Cordillera | 1.1 | Note ..: not available for a specific reference period |
| Southern Arctic Cordillera | 1.2 | Note ..: not available for a specific reference period |
| Sverdrup Islands | 2.1 | Note ..: not available for a specific reference period |
| Ellesmere Basin | 2.2 | Note ..: not available for a specific reference period |
| Victoria Lowlands | 2.3 | Note ..: not available for a specific reference period |
| Parry Channel Plateau | 2.4 | Note ..: not available for a specific reference period |
| Boothia–Foxe Shield | 2.5 | Note ..: not available for a specific reference period |
| Baffin Uplands | 2.6 | Note ..: not available for a specific reference period |
| Foxe–Boothia Lowlands | 2.7 | Note ..: not available for a specific reference period |
| Amundsen Lowlands | 3.1 | 117 |
| Keewatin Lowlands | 3.2 | 171 |
| Ungava–Belcher | 3.3 | 417 |
| Mackenzie Foothills | 4.1 | 184 |
| Great Bear Lowlands | 4.2 | 120 |
| Hay–Slave Lowlands | 4.3 | 111 |
| Western Taiga Shield | 5.1 | 143 |
| Eastern Taiga | 5.2 | 585 |
| Labrador Uplands | 5.3 | 754 |
| Whale River Lowland | 5.4 | 580 |
| Western Boreal Shield | 6.1 | 196 |
| Mid-Boreal Shield | 6.2 | 393 |
| Eastern Boreal Shield | 6.3 | 793 |
| Newfoundland | 6.4 | 1,147 |
| Lake of the Woods | 6.5 | 188 |
| Southern Boreal Shield | 6.6 | 517 |
| Appalachian–Acadian Highlands | 7.1 | 698 |
| Northumberland Lowlands | 7.2 | 735 |
| Fundy Uplands | 7.3 | 986 |
| Great Lakes–St. Lawrence Lowlands | 8.1 | 713 |
| Huron–Erie Plains | 8.2 | 595 |
| Boreal Foothills | 9.1 | 137 |
| Central Boreal Plains | 9.2 | 83 |
| Eastern Boreal Plains | 9.3 | 127 |
| Eastern Prairies | 10.1 | 68 |
| Parkland Prairies | 10.2 | 42 |
| Central Grassland | 10.3 | 20 |
| Northern Yukon Mountains | 11.1 | 153 |
| Old Crow–Eagle Plains | 11.2 | 165 |
| Ogilvie Mountains | 11.3 | 200 |
| Mackenzie–Selwyn Mountains | 11.4 | 266 |
| Wrangel Mountains | 12.1 | 412 |
| Northern Boreal Cordillera | 12.2 | 289 |
| Southern Boreal Cordillera | 12.3 | 580 |
| Western Boreal Cordillera | 12.4 | 244 |
| Georgia Depression | 13.1 | 1,696 |
| Southern Coastal Mountains | 13.2 | 2,308 |
| Northern Coastal Mountains | 13.3 | 1,652 |
| Northern Montane Cordillera | 14.1 | 590 |
| Central Montane Cordillera | 14.2 | 274 |
| Southern Montane Cordillera | 14.3 | 342 |
| Columbia Montane Cordillera | 14.4 | 757 |
| Hudson Bay Coastal Plains | 15.1 | 272 |
| Hudson–James Lowlands | 15.2 | 337 |
- Date modified: