To buy or to rent: The housing market continues to be reshaped by several factors as Canadians search for an affordable place to call home
Archived Content
Information identified as archived is provided for reference, research or recordkeeping purposes. It is not subject to the Government of Canada Web Standards and has not been altered or updated since it was archived. Please "contact us" to request a format other than those available.
Released: 2022-09-21
A place to call home
Everyone needs a place to call home, but home isn't just a roof over your head. One's home can also be a source of security, dignity and identity. Not everyone has a home, and some do not have a home that meets their needs. Should I buy or rent? Where should I live? Can I afford my home? These are questions on the minds of many Canadians.
In Canada, people do not just need a home, they have a right to one. The passing of the National Housing Strategy Act in 2019 recognized housing as a human right. The Act establishes the right to a standard of housing that is free from systemic and prejudicial barriers. It also focuses on providing affordable housing for those groups who are in greatest need and outlines commitments made by the government to achieve equitable housing outcomes.
The onset of the COVID-19 pandemic led to upheavals in the housing market and housing needs of many Canadians. But Canada's housing stock has been built over time through long-term construction trends, shifting housing preferences, population growth and an aging society, housing policy, and investment. The resulting difference in housing supply and demand, coupled with modified expectations for the future, has led to large changes in home prices. The housing market has continued to change since Census Day on May 11, 2021, with house prices continuing to rise through February 2022 before tumbling over the spring and summer in the face of interest rate hikes designed to curb inflation. Trying to figure out the right time to buy is a difficult decision that can leave Canadians wondering how long they want to hold out on entering the real estate market—or whether they even want to. For many Canadians, both in and outside the housing market, housing options will continue to unfold over time.
The 2021 Canadian Housing Survey reported that the growth of renter households outpaced the growth of owner households, pushing down the homeownership rate in Canada. The 2020 Canadian Housing Statistics Program also highlighted that the share of owner-occupied dwellings had edged down from 2019 to 2020, while non-resident ownership remained low. Today's release, from the 2021 Census, builds on these findings. It highlights the housing tenure trends of the past decade and the change in housing affordability since the onset of the pandemic. It explores downtown areas, where growth in population and housing investment is large, with two out of five households downtown (39.9%) living in condominiums in 2021 and half (50.1%) of these downtown condominiums being rented. It concludes by examining the differences in housing needs across generations.
Highlights
The homeownership rate falls
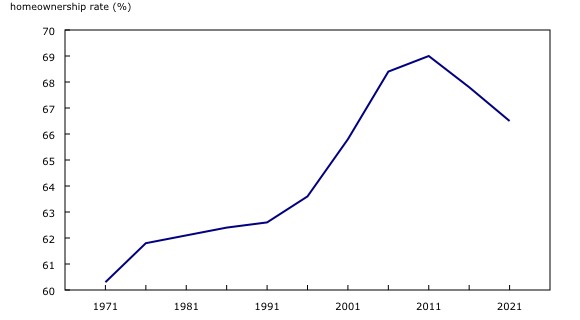
The proportion of Canadian households who own their home—or the homeownership rate (66.5% in 2021)—is on the decline in Canada after peaking in 2011 (69.0%). The growth in renter households (+21.5%) is more than double the growth in owner households (+8.4%).
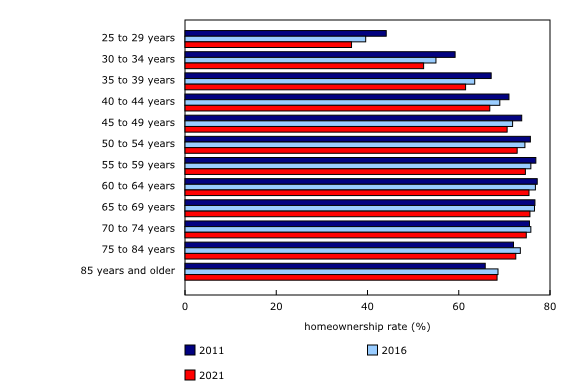
Adults under the age of 75 were less likely to own their home in 2021 than adults in that age range a decade earlier—especially young millennials aged 25 to 29 years (36.5% in 2021 vs. 44.1% in 2011).
A large share of newer builds are rentals
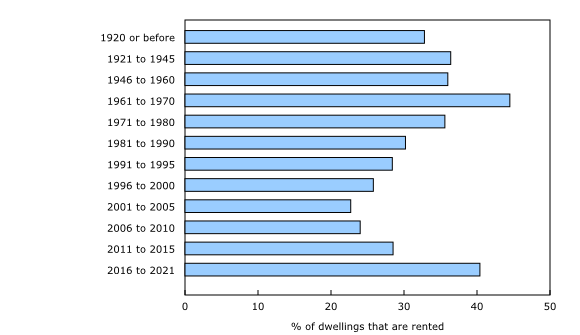
Recently built dwellings are increasingly likely to be occupied by renters—40.4% of the housing built in the five years ending in 2021 was tenant-occupied, the highest tenant rate next to that of dwellings built in the 1960s post-war apartment boom, at 44.5%.
Over one-third of recently built dwellings, those constructed from 2011 to 2021, were occupied and primarily maintained by millennial (36.6%) renters or owners in 2021, the largest share of any generation. Millennials also represented the largest share of condominium occupants (30.2%) compared with the other generations.
The share of condominiums continues to rise
The rising trend of condominium construction continues—the share of occupied dwellings that are condominiums edged up from 13.3% in 2016 to 15.0% in 2021. Most condominiums (90.0%) are located in Canada's large cities, known as census metropolitan areas (CMAs).
In Canada's CMAs, condominiums made up 39.9% of the occupied stock in the primary downtowns in 2021, and half of these downtown condos were being rented out by investors.
Home values continue to surge through 2021
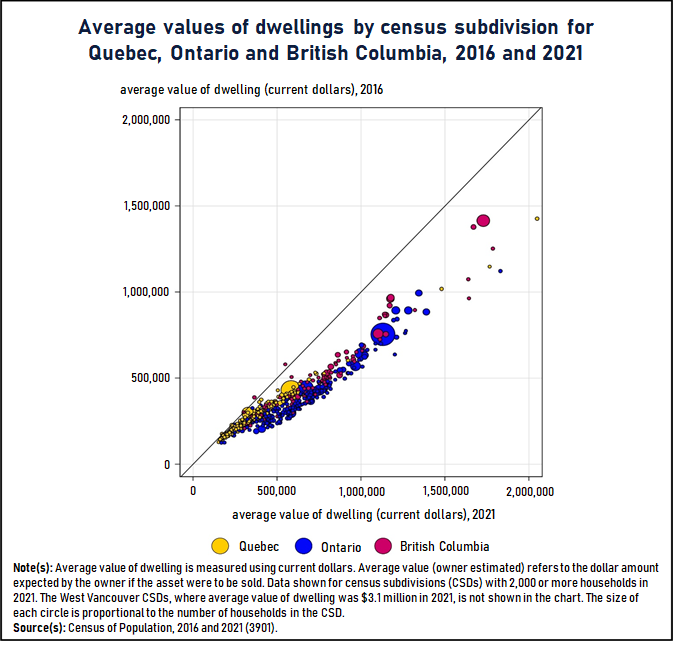
Expected home values rose in large and small municipalities (census subdivisions [CSDs]) in Ontario and British Columbia from 2016 to 2021. Among CSDs, 77.8% in Ontario and 46.1% in British Columbia saw the average expected value of homes rise by over 50%.
Differences in the impact of temporary COVID-19 benefits on household incomes—for renters and for homeowners—were a key contributor to the different degrees of improvement in housing affordability seen for each group, from 2016 to 2021.
Canadians find their housing more affordable in 2021 because of higher incomes
The rate of unaffordable housing, or the proportion of households that spent 30% or more of their income on shelter costs, fell from 24.1% in 2016 to 20.9% in 2021. The rate of unaffordable housing in Canada for renters fell from 40.0% in 2016 to 33.2% in 2021, with most of the decline occurring among renters earning below the median household income of all renters (68.4% in 2016, compared with 56.0% in 2021).
Unaffordable housing rates are highest in downtowns. In 33 of 42 downtowns of large urban centres, the percentage of renters spending more than 30% of their income on shelter costs in 2021 was above the national average.
Almost 1.5 million Canadian households lived in "core housing need" in 2021, defined as living in an unsuitable, inadequate or unaffordable dwelling and not able to afford alternative housing in their community. The core housing need rate fell from 12.7% in 2016 to 10.1% in 2021, driven largely by the improvements in household incomes and housing affordability.
There were 603,040 children (8.8%) living in core housing need in 2021, down from 13.3% in 2016. Millennials who lived with a roommate were less than half as likely to live in core housing need (7.4%) as those who lived alone (15.3%).
Homeownership is on the decline in Canada after hitting its peak in 2011
In 2021, 10.0 million households in Canada owned their home, which is more than at any point in the country's history. However, while the number continues to grow, Canadians overall were less likely to own their home in 2021 (66.5%) than they were a decade earlier, when a record high (69.0%) were homeowners.
This follows a period of growth where the homeownership rate grew from 63.6% in 1996 to 68.4% by 2006.
These recent changes in homeownership have happened while the shares of people living alone or with roommates have been rising as reported in the census families and households release. People who live alone or with roommates are less likely to own their home than other households such as couples with or without children.
Canada's homeownership rate (66.5%) in 2021 ranked 23rd highest among countries of the Organisation for Economic Co-operation and Development (OECD). Canada was below the OECD average of 71.5%, a combination of the rates of households that owned their home outright and those that owned their home with a mortgage, according to the Housing Market Indicators reported by participating countries. In comparison, the United States (65.5%) was fairly close to Canada, but Mexico (69.6%) had the highest homeownership rate in North America. Across the Atlantic, the homeownership rate in the United Kingdom (67.3%) was similar to that in Canada, while the rate in France (61.7%) was lower.
Across the provinces and territories, the homeownership rate declines the most in Prince Edward Island, while the Northwest Territories sees the only increase
Whether you are a homeowner or renter hinges on many factors, including your age, income, where you live in Canada, whether you live with others or alone, and what part of town you call home.
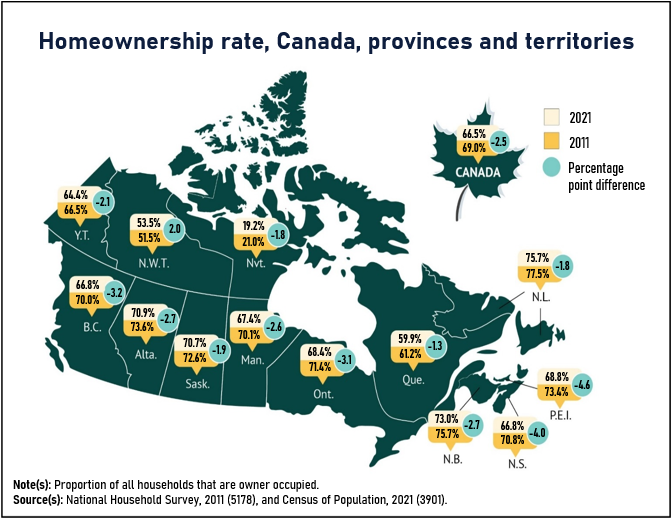
Residents of Atlantic Canada have historically been the most likely to be homeowners, and this remained true in 2021. However, from 2011 to 2021, Nova Scotia (down from 70.8% to 66.8%) and Prince Edward Island (down from 73.4% to 68.8%) saw the largest declines in homeownership rates.
British Columbia had the third-largest decline (from 70.0% to 66.8%) in homeownership rates over this period, while Ontario had the fourth-largest decline (from 71.4% to 68.4%). Quebec had the smallest drop (from 61.2% to 59.9%). Quebec has historically had lower homeownership rates than elsewhere in Canada, and this remained the case in 2021.
Homeownership rates in the territories have also typically been lower than the national average. Among the territories, Yukon (64.4%) was closest to the national average in 2021, but its homeownership rate had fallen by 2.1 percentage points since 2011. The homeownership rate in the Northwest Territories (53.5%) was unchanged from 2016, but up by 2.0 percentage points from 2011. In Nunavut, fewer than one in five households (19.2%) were owner-occupied in 2021, the lowest rate nationally.
The number of renter households grows at over twice the pace of owner households
When the homeownership rate goes down, the rental rate goes up. The decline in homeownership rates from 2011 to 2021 was attributable to the number of renter households (+21.5%) growing at over twice the pace of owner households (+8.4%). By comparison, the number of owner households increased by almost one-quarter (+23.7%) from 1996 to 2006, while the number of renter households decreased by 0.7%. In 2021, there were 5.0 million renter households, or a rental rate of 33.1%.
Recent discussions of shortages in housing supply have focused on the importance of building more rental housing. In fact, the housing market has been responding to this need, and there are now more rental units than ever before. The number of units in the purpose-built rental market, reported by the Canada Mortgage and Housing Corporation, grew by almost one-fifth from 2010 to 2020, rising from about 1.8 million units to almost 2.2 million units. In comparison, about 14,000 net units were added from 1990 to 2010.
The growth in the rental rate reflects the increased construction of multi-unit buildings, such as apartments and condominiums. Before 2011, apartments accounted for less than 40% of building permits. Since the start of 2011, multi-unit building permits have accounted for 68.1% of units created, and 73.2% in 2021 alone. These construction and real estate trends address the greater demand for these types of dwellings, fuelled by population growth through immigration, an aging population and a gravitation towards the downtown lifestyle—particularly among younger Canadians.
Across all large urban centres, the number of renter households grows faster than owner households
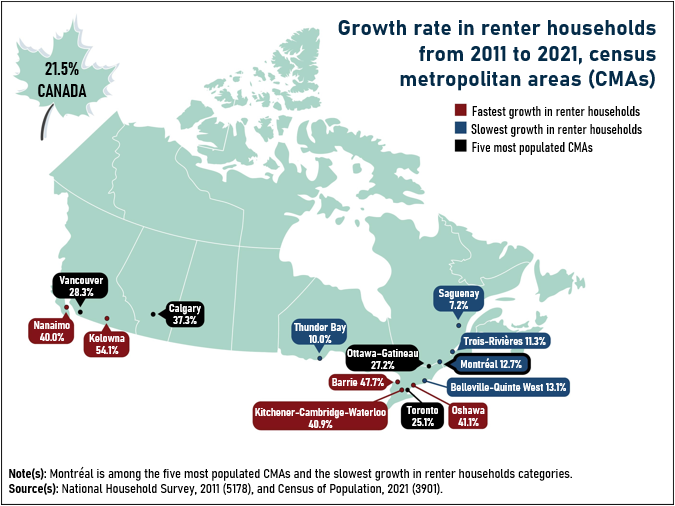
The growth in renter households outpaced the growth in homeowner households from 2011 to 2021 in each of Canada's 41 large urban centres (CMAs). In 30 CMAs, the growth of renter households was more than double the growth of owner households over this period.
Renter households rose at the fastest pace nationally from 2011 to 2021 in five mid-sized CMAs in British Columbia and Ontario. In British Columbia, renter households grew fastest in Kelowna (+54.1%) and Nanaimo (+40.0%), while in Ontario, Barrie (+47.7%), Oshawa (+41.1%) and Kitchener–Cambridge–Waterloo (+40.9%) saw the largest increases in renter households.
Adults under the age of 75 are less likely to own their home in 2021 than a decade earlier—especially young adults
From 2011 to 2021, homeownership rates declined among adults under the age of 75. Homeownership rates among those aged 25 to 29 years fell from 44.1% in 2011 to 36.5% in 2021, while for those aged 30 to 34 years, homeownership rates fell from 59.2% in 2011 to 52.3% in 2021. In older age groups, the drops in homeownership were less pronounced; among those aged 70 to 74 years, for example, the homeownership rate fell from 75.5% to 74.8%.
At the same time, homeownership rates among Canadians 85 years and older were up slightly from a decade earlier, mainly driven by Canadians with high ownership rates aging into this cohort. As services that promote Aging in Place become more widespread, the rate may further increase in the coming decades.
While the declining homeownership rate is felt by most age groups, the implications vary across different generations, since each one is at a different life stage, with different housing needs. Baby boomers, born from 1946 to 1965, and millennials, born from 1981 to 1996, have strong influences on housing markets in Canada, and both groups have different needs and preferences when it comes to housing. Baby boomers, or those aged 56 to 75 years in 2021, accounted for the largest share of homeowners (41.3%) in Canada in 2021. However, this may start to change as older baby boomers consider downsizing. At the same time, millennials, aged 25 to 40 years in 2021, represented the largest share of renters (32.6%); many of them may plan to form families and buy homes in the future.
If you build it, they will come: Recently built homes are increasingly likely to be occupied by renters and millennials
The decline in homeownership is a reflection of the trends in new construction connected to the densification of large urban centres. Apartments in high-rise buildings with five or more storeys made up the fastest growing building type from 2016 to 2021, rising over twice as fast as the overall stock of private dwellings (+14.7% vs. +6.4%) and accounting for 34.4% of dwellings in Canada.
With the recent growth in apartments, dwellings built since 2016 are more likely to be occupied by renters compared with the older housing stock. Just over two in five dwellings built from 2016 to 2021 (40.4%) were occupied by renters in 2021, a higher proportion than any other era of housing stock, except for dwellings built in the 1960s post-war apartment boom.
Over one-third (36.6%) of the dwellings built from 2011 to 2021 were occupied and primarily maintained by a millennial in 2021, higher than the approximately one in five dwellings (20.4%) built before 2011. Households primarily maintained by a Generation Xer (28.0%), those born between 1966 and 1980, accounted for the second-largest share of those living in housing stock built from 2011 to 2021, followed by those households primarily maintained by a baby boomer (24.3%).
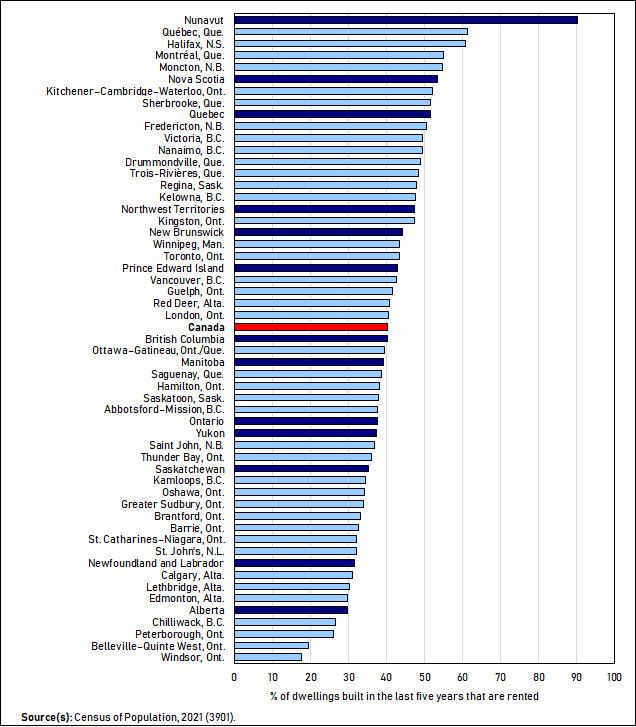
In the cities of Québec and Halifax, over 60% of new dwellings built since 2016 are rented
The recent uptick in renters is also occurring in large urban centres, especially in new housing stock built since 2016. In 2021, the share of renters in housing built from 2016 to 2021 was largest in Québec (61.3%) and Halifax (60.7%).
Over half (55.1%) of the dwellings built in Montréal from 2016 to 2021 were rented in 2021, the highest share among Canada's three largest cities, followed by Toronto (43.4%) and Vancouver (42.6%). These CMAs are characterized by strong population growth in their downtown areas and also by urban spread, with rapid growth in their distant suburbs.
Less than one-third of the dwellings built in Calgary (31.2%) and Edmonton (29.9%) from 2016 to 2021 were rented in 2021, the lowest share among Canadian cities with a population of 1 million or more. Edmonton and Calgary also had the largest share of single-detached dwellings among Canada's large CMAs and the highest homeownership rates.
The rising trend of condominium construction continues, especially in Canada's largest cities, with millennials making up the largest share of occupants
While newly built dwellings are increasingly renter-occupied, new condominiums contributed to the rental housing stock and the owner-occupied stock. Condominiums are a gateway to homeownership and housing investment for many Canadians. According to the Canadian Housing Statistics Program, over one-third (37.8%) of first-time home buyers in British Columbia and just under one in six in Ontario (16.5%) bought a condominium in 2020.
Across Canada, census results show there were just under 1.9 million condominium units in 2016, accounting for 13.3% of the occupied housing stock. By 2021, this number had risen to more than 2.2 million units, or 15.0% of Canada's occupied housing stock. Just over one-third (34.1%) of homes built from 2016 to 2021 were condominiums in 2021.
Approximately 4.3 million Canadians lived in a condominium in 2021, with millennials (29.2%) and baby boomers (23.0%) accounting for over half of all condo dwellers. Around 1 in 7 Canadians living in a condo was younger than 18 years (14.1%), while 1 in 10 was older than 75 years (8.9%).
All told, 9 in 10 condo dwellings in Canada (90.0%, or 2,022,935 units) in 2021 were located in one of the 41 CMAs. Over one-third (39.7%) of all dwellings built in a CMA from 2016 to 2021 were condos. Over half of the new dwellings built from 2016 to 2021 in Toronto (55.8%), Vancouver (54.3%) and Montréal (51.7%), Canada's three largest CMAs, were condos.
British Columbia and Alberta have the largest share of condo dwellers nationally
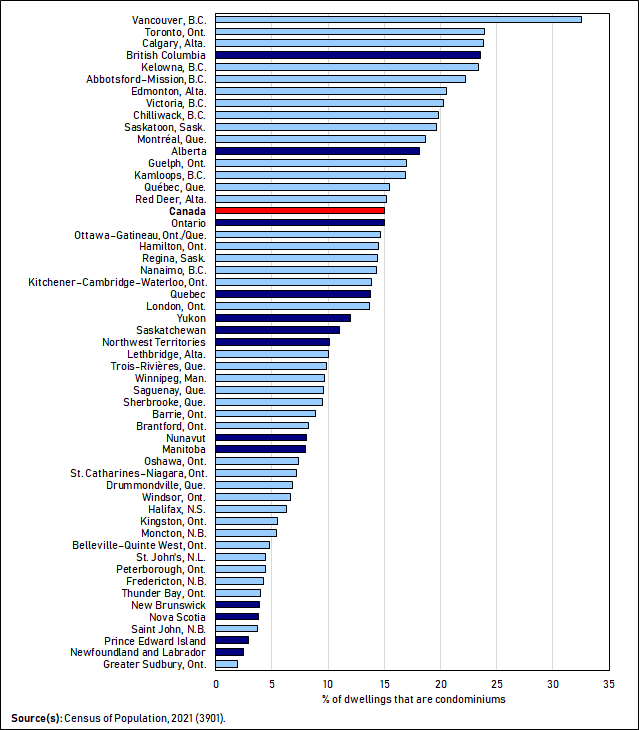
British Columbia had the largest share of condo dwellers among the provinces in 2021, with 23.6% of households calling a condo home. Almost one-third (32.5%) of households in Vancouver lived in a condo, the highest share among all CMAs, followed by Kelowna (23.4%), Abbotsford–Mission (22.2%), Victoria (20.3%), Chilliwack (19.8%), Kamloops (16.9%) and Nanaimo (14.3%).
Almost one in five households in Alberta (18.1%) were living in a condo in 2021, with condo living most prevalent in Calgary (23.8%) and Edmonton (20.5%).
In Ontario, one in six households (15.0%) were living in a condo in 2021, with Toronto (23.9%) having the largest proportion in the province, followed by Guelph (17.0%). The proportion of households living in condos was smaller than the Ontario rate in Ottawa–Gatineau (14.7%), Hamilton (14.5%), Kitchener–Cambridge–Waterloo (13.9%) and London (13.7%).
Approximately one in seven households in the province of Quebec (13.8%) lived in a condo in 2021, with most found in Montréal (18.7%) and Québec (15.5%).
Downtown housing is growing fast in large urban centres, with many condominiums rented out by Canadian investors
More Canadians are choosing to live in the downtowns of large urban centres to partake in the social, economic and postsecondary education opportunities that exist there. Many Canadian cities have also implemented urban densification plans to bring more people into the urban core. As these plans unfold, the dwelling stock has grown into the sky, with high-rise apartments and condominiums, spurring the strong population growth in these regions.
In the census, the primary downtown is defined as the central core of a CMA and generally refers to the area around the central business district that also has residential and mixed-use development.
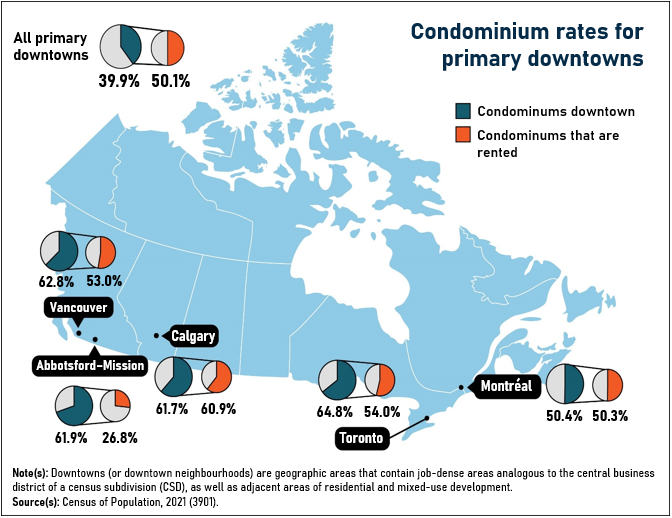
While condominiums accounted for one in six dwellings nationally in 2021, two in five dwellings (39.9%, or 287,665 units) in Canada's primary downtowns were condos.
Over one-third of the condos in Canada (37.4%, or 840,045 units) were rented in 2021, up 4.5 percentage points from 2016. These added to the supply of rental units, particularly in cities and in downtowns.
Rental condos accounted for half (50.1%) of all condos located in the downtowns of CMAs across Canada in 2021. Over half of the dwellings in the downtowns of Toronto, Montréal and Vancouver were condos, and more than half of these condominiums were rented.
Expected home prices rise in large and small municipalities in Ontario, British Columbia and Quebec, and they remain relatively stable in the Prairies
While the rental housing stock grew, the owner-occupied stock was also changing. Home prices rose rapidly in 2020 and 2021 against a backdrop of record-low interest rates at the onset of the pandemic, making it easier for home buyers and those refinancing their homes to take on larger mortgages at that time.
According to the 2021 Census of Population, median household after-tax income grew by 9.8% from the 2016 Census, or 18.0% when not accounting for the effects of inflation. At the same time, the average value of an owner-occupied home, not adjusted for inflation, rose by 39.6% from 2016 to 2021. When the price of buying a home grows faster than household incomes, it becomes more difficult for people to afford buying a home.
The 2021 Census asked homeowners what price they would expect to get if they were to sell their home. This concept differs from other sources that report on housing prices, such as property assessment data, which focus on the assessment value for the purpose of taxation, or sales data, which exclusively look at dwellings that are bought and sold over a given period of time.
The average expected values of homes grew the most from 2016 to 2021 in Ontario (+59.4%), British Columbia (+36.3%) and Quebec (+29.8%). In terms of municipalities, classified in the census as census subdivisions (CSDs), 77.8% of CSDs in Ontario and 46.1% of those in British Columbia saw their average expected value of homes rise by over 50% from 2016 to 2021.
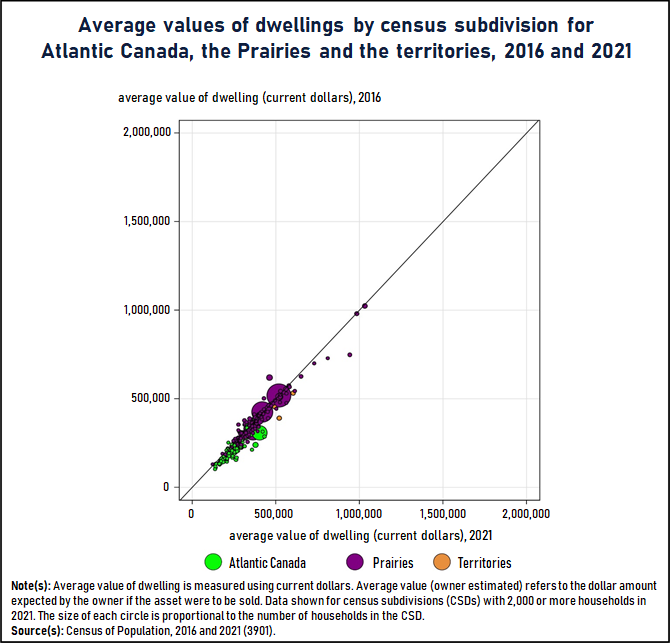
Average expected home values in the territories (+22.6%) and Atlantic Canada (+21.1%) grew at a slower pace than in Ontario, British Columbia and Quebec. Homeowners in the Prairies (+2.2%) reported the slowest price growth nationally, roughly comparable with the level that was reported in 2016.
The resource-based economies of the Prairie provinces may have factored into how owners perceived the value of their home. The 2014 oil downturn and subsequent job losses in the oil patch influenced mobility patterns and the demand for housing.
The business of housing: Canadians are putting their homes to work
Mark Twain famously said, "Buy land, they're not making it anymore." Real estate and homes are no longer just a place to live—instead, Canadians are in the business of real estate for a variety of reasons, from saving for retirement to adapting to the new home-office life.
The rising home prices seen in parts of the country can lead to wealth gains for homeowners. According to the Survey of Financial Security, the net worth in 2019 constant dollars of homeowners of all ages rose from $323,700 in 1999 to $685,400 in 2019. In comparison, the net worth of renters of all ages rose from $14,600 to $24,000 over this period.
Condominiums that are tenant-occupied are most often owned by individuals (as opposed to corporations or other entities), likely as an investment property. According to the Canadian Housing Statistics Program, over three-quarters (77.1%) of the condos in British Columbia and over two-thirds (69.1%) of those in Ontario that were not being lived in by the homeowner were owned by individual Canadian investors. Condominiums are typically less expensive than houses and offer owners an opportunity to invest in the real estate market with an asset that generates both rental income and wealth.
In the face of the COVID-19 pandemic, many Canadians also turned to their homes as safe places to work. In May 2020, roughly 43% of Canadian female employees worked from home, while 31% of male employees did so. By May 2021, when the census was conducted, approximately 3 in 10 Canadian employees were working from home. Impacts of this shift on commuting patterns will be studied in future census releases.
Monthly shelter costs rise faster for renters than for owners from 2016 to 2021
The price of housing is often discussed solely in terms of the cost of buying a home. However, the monthly shelter costs that households pay for their homes give a sense of the day-to-day costs of living in one's home.
The monthly shelter cost reported by the census for renters includes rent and utilities, such as payments for electricity, fuel, water and other municipal services. The 2021 Census showed that, not adjusted for inflation, the median monthly shelter cost paid by renters grew by 17.6%, from $910 in 2016 to $1,070 in 2021. This growth outpaced the all-items Consumer Price Index over the same period, which was 9.5%.
The shelter cost paid by renters grew at a slower pace for those with the lowest shelter costs. For the 10% of rental units with the lowest monthly costs, the average amount paid for these units grew by 4.3%, from $258 per month in 2016 to $269 per month in 2021.
Shelter costs for homeowners have changed by a smaller margin than for renters since 2016. For homeowners, the monthly shelter cost reported in the census includes the mortgage, property taxes and condominium fees, where applicable, and utilities payments. The median monthly shelter cost payments for owners grew by 9.7%, from $1,130 in 2016 to $1,240 in 2021, not adjusted for inflation.
Similar to renters, the monthly shelter cost paid by the owners with the lowest shelter costs grew the slowest. For the 10% of owner households who paid the lowest monthly costs, the average amount paid grew by 4.0%, from $303 in 2016 to $315 in 2021.
While shelter costs have grown since the last census, household incomes have grown faster, especially for renters
To better understand the shelter costs of renters and owners, looking at household incomes helps determine whether incomes are keeping up with the rising cost of housing. COVID-19 benefits paid to Canadians cushioned the losses in employment income, especially among those with lower incomes.
The 2021 Census showed that, not adjusted for inflation, the median household income of renters grew by 31.7%, from $41,600 in 2015 to $54,800 in 2020. At the same time, owners saw their median household income grow by 14.6%, from $89,000 in 2015 to $102,000 in 2020.
Renters earning below the median saw even larger growth in their household incomes. For the 10% of renters with the lowest household incomes, their average household income grew by over two-thirds (+67.4%), from $7,110 in 2015 to $11,900 in 2020.
The same was true for owner households who earned below the median. The 10% of owners who had the lowest household incomes saw their household incomes grow by 23.1%, from $19,600 in 2015 to $24,120 in 2020.
The rate of unaffordable housing declines, especially among lower-income renters, largely because of temporary income supports
When household incomes grow faster than shelter costs, this creates conditions for improved housing affordability. Differences in the impact of temporary COVID-19 benefits on household incomes—for renters and for homeowners—were a key contributor to the different degrees of improvement in housing affordability seen for each group, from 2016 to 2021.
Housing affordability is assessed by deriving a household's shelter-cost-to-income ratio. This measures the impact of housing costs on a household's budget. Households that spend 30% or more of their income on shelter costs are considered to be in unaffordable housing.
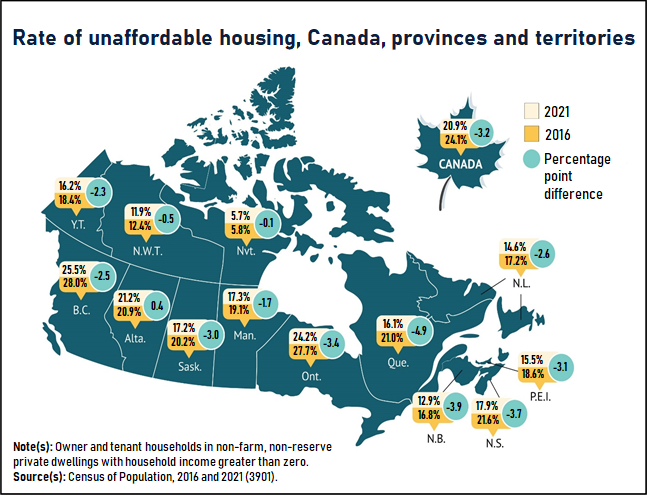
The rate of unaffordable housing, or the proportion of households that spent 30% or more of their income on shelter costs, fell from 24.1% in 2016 to 20.9% in 2021. As has been the case historically, renters were at higher risk of living in unaffordable housing than owners, but they experienced larger improvements in housing affordability.
Census data show that the rate of unaffordable housing in Canada for renters fell from 40.0% in 2016 to 33.2% in 2021, with most of the decline occurring among lower-income renters. For renters earning below the median household income of all renters, the rate of unaffordable housing fell more from 68.4% to 56.0%.
The COVID-19-related government transfers lifted many households above the housing affordability thresholds, helping pay for shelter costs like rent, mortgages and utilities. At the same time, there are other housing-related expenses that are not included in this measure of housing affordability, expenses that are a concern for many renters. According to the 2021 Canadian Housing Survey, slightly more than one-quarter (26.1%) of renters in affordable housing said they found it difficult or very difficult for their household to meet its financial needs in terms of transportation, housing, food, clothing and other necessary expenses in 2021. With the last temporary COVID-19 benefits being phased out in early 2022, combined with the highest rate of inflation in 40 years—particularly for life's essentials—there could be further pressure on households that are already struggling to make ends meet.
Despite the larger gains for renters in 2021, they were still over twice as likely to be in unaffordable housing as homeowners. For homeowners in Canada overall, the rate of unaffordable housing fell from 16.6% in 2016 to 14.8% in 2021. This decline was driven almost entirely by homeowners who earned below the median household income of all homeowners, for whom the rate of unaffordable housing fell from 30.0% in 2016 to 26.1% in 2021.
British Columbia and Ontario have the highest rates of unaffordable housing
British Columbia (25.5%) and Ontario (24.2%) had the highest rates of unaffordable housing nationally in 2021. This was largely because of the higher rates of unaffordable housing in the renter-heavy large urban centres of Toronto (30.5%) and Vancouver (29.8%), the two CMAs with the highest rates of unaffordable housing.
In Atlantic Canada, where homeownership rates tended to be higher, the rates of unaffordable housing were lower. Owners in New Brunswick (7.5%), Prince Edward Island (8.8%), Newfoundland and Labrador (8.9%) and Nova Scotia (9.7%) experienced lower unaffordable housing rates, bringing down the overall provincial rates of unaffordable housing.
Homeowners in Alberta are more likely to live in unaffordable housing compared with five years earlier
Just over one in five Albertan households (21.2%) were living in unaffordable housing in 2021, up by 0.3 percentage points from five years earlier, and the third-highest rate nationally. The increase was attributable to owner households, whose unaffordable housing rate rose from 15.1% in 2016 to 16.0% in 2021. Alberta was the only province to see an increase in the rate of unaffordable housing.
The natural resources sector and oil prices have far-reaching impacts on the economy in Alberta, influencing income and housing affordability. However, renters in Alberta, along with renters elsewhere in the country, saw unaffordable housing rates fall—in the case of Alberta, from 36.0% in 2016 to 34.0% in 2021.
Unaffordable housing rates are highest in downtowns across Canada for both owners and renters
Canadians paid a premium for a downtown city lifestyle, where housing costs were higher and rates of unaffordable housing were highest.
In 2021, the average rent for a two-bedroom dwelling in the primary downtowns of Canada's three largest CMAs was higher than the average rent for each respective CMA as a whole. In Montréal, the rent for a two-bedroom dwelling in the primary downtown was over two-thirds (69.9%) higher compared with the CMA overall. In Vancouver (50.1%) and Toronto (32.2%), the cost of a two-bedroom dwelling downtown was also higher than in each respective CMA as a whole.
Downtown households are most likely to be spending more than 30% of their income on shelter costs, for both owners and renters. In 33 of the 42 primary downtowns in Canada's large urban centres, the unaffordable housing rate for renters was higher than the national average in 2021. Approximately half of the renters in the downtowns of Kingston (50.4%), Barrie (50.0%), Halifax (47.7%) and Peterborough (47.2%) lived in unaffordable housing.
Renters in the downtowns of Toronto (45.2%), Vancouver (44.8%) and Montréal (44.2%) had slightly lower unaffordability rates in 2021. At the same time, homeowners in the downtowns of Toronto (36.2%), Vancouver (33.4%) and Montréal (30.9%) had the highest rates of homeowner unaffordable housing nationally.
Almost 1.5 million, or 1 in 10, households were in core housing need in 2021
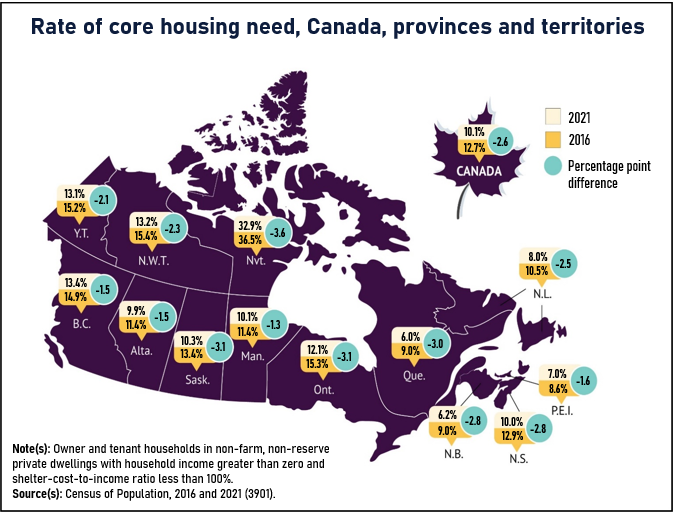
Almost 1.5 million Canadian households lived in core housing need in 2021, defined as living in an unsuitable, inadequate or unaffordable dwelling and not able to afford alternative housing in their community. The core housing need rate fell from 12.7% in 2016 to 10.1% in 2021, driven largely by the improvements in household incomes and housing affordability.
Statistics Canada, in collaboration with the Canada Mortgage and Housing Corporation, produced the core housing need indicator. A household is deemed to be in core housing need when its dwelling is considered unsuitable, inadequate or unaffordable and when the household cannot afford alternative housing in its community. Unsuitable housing has too few bedrooms for the size and composition of a household based on National Occupancy Standard requirements. Housing is inadequate when its residents report that major repairs are required and unaffordable when shelter costs account for more than 30% of a household's total before-tax income.
Proportionately fewer homeowners were in core housing need compared with unaffordable housing, because they generally had higher incomes and could afford the regional market rent of a home that met their needs. The core housing need rate for homeowners (5.3%) was about one-third the unaffordable housing rate (14.8%). In contrast, the core housing need rate for renters (20.0%) was nearly two-thirds the rate of unaffordable housing (33.2%).
This was not the case in Nunavut, where unaffordable housing (5.7%) was less common owing to the nature and prevalence of housing subsidies. However, despite the low unaffordable housing rate, the core housing need rate was almost six times higher (32.9%) because of the high levels of crowding and homes that required major repairs.
Renters were more likely to be in core housing need than owners across CMAs. The gap was largest in Montréal, where renters (14.6%) were over six times more likely to be in core housing need than homeowners (2.4%). Renters were more than twice as likely to live in core housing need as homeowners in Toronto (28.7% vs. 9.6%) and Vancouver (27.2% vs. 10.9%).
Quebec has a rent control policy that governs the amount landlords can increase rents. This is a contributing factor to the CMAs in Quebec having among the lowest rates of core housing need nationally despite a median household income that is lower than that in Ontario, British Columbia and the Prairies.
Housing is a human right in Canada
The 2019 National Housing Strategy Act declared that "the right to adequate housing is a fundamental human right affirmed in international law." The Act affirmed that the right to adequate housing without discrimination is a fundamental human right for everyone in Canada.
Having an affordable, suitable and secure home is essential to living a dignified life and building healthy and sustainable communities. Furthermore, the right to adequate housing is an important precondition for exercising other human rights, including the rights to life, good physical and mental health, education, and political participation. The human rights-based approach to housing adopted in the Act and the National Housing Strategy underlines that housing must provide more than four walls and a roof. It should be equitable and accessible to all without discrimination based on gender, race, Indigenous identity, disability, faith, place of birth, age, family status, sexual orientation, gender identity or other factors.
A commitment to equitable outcomes requires statistics to quantify the differences in outcomes across population groups. A new housing data visualization tool allows users to identify groups of people living in different regions across Canada based on their age, gender, Indigenous identity and other characteristics to see how their housing experiences have changed over time and how they compare with those of other groups. This tool will be updated as more 2021 Census data are released to include those living in poverty, immigrants and racialized groups.
Fewer children live in core housing need
While 1 in 10 households (10.1%) lived in core housing need in 2021, the specific characteristics of the different people living in these dwellings varied.
For children younger than 18 years, who are sometimes overlooked in housing statistics because they do not pay the shelter costs, under 1 in 10 (8.8%, or 603,040 children) lived in core housing need in 2021, down from 13.3% in 2016.
Children living in one-parent households were the most likely to live in core housing need (24.7%).
Millennials who live with roommates are half as likely to be in core housing need
Many housing transitions can happen in early adulthood. Millennials, in particular, whether they are at the life stage of moving out of the parental home or seeking to buy a home, are particularly affected by housing affordability and markets. Just over 1 in 10 millennials (11.8%) were living alone in 2021, up from 10.1% in 2016, while 7.7% lived with a roommate, down from 9.6% in 2016.
Millennials who lived with a roommate were half as likely to live in core housing need as those who lived alone. For example, 7.4% of millennials living with roommates were in core housing need in 2021, down from 9.7% in 2016. This compares with the 15.3% of millennials living alone who were in core housing need in 2021, down from 16.3% in 2016.
At the same time, over half (56.7%) of millennials who did not live with a parent lived in an owner-occupied dwelling in 2021, up from 49.6% in 2016. Owning one's home can be a tremendous source of wealth for younger Canadians. According to the 2019 Survey of Financial Security, homeowners younger than 35 years had a median net worth of $272,100, compared with $14,500 for renters in the same age group.
Couples of all ages are the least likely to be in core housing need
Couples of all ages were the least likely to live in core housing need. As is the case with roommates, couples can pool resources and earnings to share the cost of housing and other expenses.
Canadians in a couple family were least likely to be in core housing need in 2021. For example, 5.4% of children living in a couple family lived in core housing need in 2021, down from 8.6% in 2016. For millennials, the share of couples living in core housing need fell from 7.0% to 4.5%.
Looking ahead
Consumer inflation has steadily increased in 2021 and 2022, and nearly three in four Canadians reported that rising prices were affecting their ability to meet day-to-day expenses, including housing. When asked this spring in a Portrait of Canadian Society survey, approximately half of Canadians reported they have adjusted their spending habits and lifestyles to cope with inflation, including by seeking out sales and promotions (50%) and purchasing cheaper alternatives, brands or items (47%). At the same time, younger Canadians aged 15 to 29 (53%) and 30 to 39 (39%) were most likely to be very concerned about their ability to afford housing.
In March 2022, the Bank of Canada began raising interest rates in response to rising prices in the Canadian economy. Interest rate policy has a direct impact on the cost of homeownership, from the perspective of homeowners who have a variable rate mortgage or will be renewing their mortgage, as well as would-be home buyers. For example, a 2-percentage point increase in the interest rate would raise the monthly payment of a new 25-year mortgage by one-quarter.
Among Canadians, millennials are likely to have recently bought a home or to soon buy a home. According to the 2021 Census, millennial homeowners with a mortgage were paying on average $2,124 a month in May 2021. When the Bank of Canada raised interest rates by 1 percentage point in July 2022, a millennial renewing or getting a mortgage would be paying on average 12% more or $2,378 per month. This amount could rise to $2,648 with a 2-percentage point increase in interest rates and to $2,934 (+38%) with a 3-percentage point increase.
Older homeowners, such as baby boomers, may be affected to a lesser extent by interest rate increases if they have paid off their mortgage or have a smaller outstanding balance. However, there are signals from real estate listing data that housing markets are cooling in 2022, following the Bank of Canada's rate increases. Such a change could affect the retirement plans of older Canadians who have a substantial amount of wealth stored in their homes.
More housing data on the way
More information is available today in the Census in Brief article on the housing conditions of Indigenous people that describes levels of crowding and conditions of dwellings. An additional Housing Statistics in Canada article reports on the housing costs paid by households living on reserve using new data from the 2021 Census.
In early 2023, an article will be released that assesses the shelter costs paid by renters in large cities. These data will be contrasted against the mobility status of households to show differences in rents that are faced by households who have recently moved and those who have lived in their dwellings for a longer period of time.
Immigration and ethnocultural census data will also be integrated into the housing data visualization tool. These data can be used to assess the way different groups of the Canadian population face different housing outcomes and inform a rights-based approach to housing analysis.
Further research using data from the census and other sources will shed additional light on housing in Canada. One possibility would be to look more closely at housing markets in university and college towns. The census enumerates students who plan to return to their parental home at that location rather than in the dwellings they occupy during the school year, and this affects estimates of housing supply and demand in these areas. It is also important to continue to look more closely at homelessness. The 2021 Census counted 12,565 people staying in shelters. This point-in-time count does not capture the true extent of homelessness in Canada, and the individuals and families who are affected have among the most acute and severe housing needs of all.
Percent of households spending 30% or more of income on shelter cost by tenure, 2016 and 2021
Note to readers
We encourage you to download the StatsCAN app to consult the census results.
Definitions, concepts and geography
All the results presented in this release are based on 2021 geographic boundaries.
In this release, the term "large urban centre" refers to a census metropolitan area (CMA). A CMA is an urban centre with 100,000 or more people.
The term "municipality" refers to a census subdivision.
The term "Canadians" refers to residents of Canada, regardless of citizenship status.
Downtowns (or downtown neighbourhoods) are geographic areas that contain job-dense areas analogous to the central business district of a census subdivision (CSD), as well as adjacent areas of residential and mixed-use development. Downtowns are delineated from dissemination blocks and are classified into two groups: primary and secondary downtowns. Each CMA has one primary downtown, located in the historical central municipality CSD of the CMA. Some CMAs can have secondary downtowns located in CSDs without a primary downtown and with a population greater than 100,000 and employment counts greater than 50,000, based on data from the previous Census of Population.
Core housing need refers to whether a private household's housing falls below at least one of the indicator thresholds for housing adequacy, affordability or suitability, and would have to spend 30% or more of its total before-tax income to pay the median rent of alternative local housing that is acceptable (attains all three housing indicator thresholds).
Housing indicator thresholds are defined as follows:
Adequate housing is reported by their residents as not requiring any major repairs.
Affordable housing has shelter costs equal to less than 30% of total before-tax household income.
Suitable housing has enough bedrooms for the size and composition of resident households according to the National Occupancy Standard, conceived by the Canada Mortgage and Housing Corporation and provincial and territorial representatives.
Only private, non-farm, non-reserve and owner- or renter-households with incomes greater than zero and shelter-cost-to-income ratios less than 100% are assessed for 'core housing need.'
Non-family households with at least one maintainer aged 15 to 29 attending school are considered not to be in 'core housing need' regardless of their housing circumstances. Attending school is considered a transitional phase, and low incomes earned by student households are viewed as being a temporary condition.
For a detailed definition of the census housing and geography concepts, please consult the Census Dictionary or see the conceptual videos.
2021 Census of Population products and releases
Today, Statistics Canada is releasing a fifth set of results from the 2021 Census of Population.
Several 2021 Census products are available as of today on the 2021 Census Program web module. This module has been designed to provide easy access to census data, free of charge.
The analytical products include an article in The Daily and an infographic.
The data products include results on housing, for many standardized geographic regions, and are available through the Census Profile, highlight tables and data tables.
The Focus on Geography Series provides data and highlights on key topics in this Daily release at various levels of geography. In addition, the data visualization Housing Indicators, 2021 Census is available.
Reference materials are designed to help users make the most of census data. These include the Guide to the Census of Population, 2021, the Dictionary, Census of Population, 2021, the 2021 Census of Population questionnaires, and the 2021 Census Data Quality Guidelines. The Housing Characteristics Reference Guide, Census of Population, 2021 is also available. The dictionary, reference guides and data quality guidelines are updated based on new information throughout the release cycle.
Geographic products and services related to the 2021 Census Program can be found under Census geography. This includes GeoSearch, an interactive mapping tool, Focus on Geography, and the Census Program Data Viewer, which are data visualization tools.
Videos on census concepts can also be viewed in the Census learning centre.
The following infographic, Core housing need in Canada, is also available.
Over the coming months, Statistics Canada will continue to release results from the 2021 Census of Population and provide an even more comprehensive picture of the Canadian population. Please see the 2021 Census release schedule to find out when data and analysis on the different topics will be released throughout 2022.
Contact information
For more information, or to enquire about the concepts, methods or data quality of this release, contact us (toll-free 1-800-263-1136; 514-283-8300; infostats@statcan.gc.ca) or Media Relations (statcan.mediahotline-ligneinfomedias.statcan@statcan.gc.ca).
- Date modified:


