
Economic and Social Reports
Working from home during the COVID-19 pandemic: How rates in Canada and the United States compare
DOI: https://doi.org/10.25318/36280001202200800001-eng
Skip to text
Text begins
Introduction
As COVID-19 began to spread throughout Canada and the United States in early 2020, many employees were asked to work from home to help control the spread of the virus. As various waves of the pandemic surged and eased, and as COVID-19 restrictions evolved, employees began to return to the workplace. Since COVID-19 restrictions were generally more stringent in Canada than in the United States, at least throughout 2021, the degree to which employees worked from home during the pandemic may have differed between the countries. Whether this happened remains an open question. The goal of this paper is to fill this information gap and analyze the trends in work-from-home rates in the two countries from May 2020 to December 2021
Keywords: Canada and U.S. labour markets, working from home, COVID-19
Authors
Sean Clarke is with Strategic Analysis, Publications and Training Division, Analytical Studies and Modelling Branch, Statistics Canada. Vincent Hardy is with the Centre of Labour Market Indicators, Statistics Canada.
Work-from-home rates decreased faster in the United States than in Canada from May 2020 to December 2021
In May 2020, the percentage of employees working from homeNote was roughly similar in Canada and the United States. In Canada, about 37% of the workforce worked from home, compared with 35% in the United States (Chart 1).

Data table for Chart 1
| Canada | Canada men | Canada women | United States | U.S. men | U.S. women | |
|---|---|---|---|---|---|---|
| % of total employment | ||||||
| 2020 | ||||||
| May | 36.6 | 31.1 | 42.7 | 35.4 | 30.8 | 40.9 |
| June | 29.1 | 25.6 | 33.2 | 31.3 | 27.2 | 36.0 |
| July | 26.7 | 24.0 | 29.9 | 26.4 | 23.9 | 29.3 |
| August | 24.5 | 21.8 | 27.6 | 24.3 | 21.9 | 27.1 |
| September | 23.7 | 21.4 | 26.1 | 22.7 | 19.9 | 25.8 |
| October | 24.3 | 21.4 | 27.4 | 21.2 | 18.8 | 24.0 |
| November | 25.4 | 23.1 | 28.0 | 21.8 | 19.3 | 24.5 |
| December | 26.7 | 24.6 | 29.0 | 23.7 | 21.2 | 26.6 |
| 2021 | ||||||
| January | 31.6 | 29.0 | 34.4 | 23.2 | 20.8 | 26.0 |
| February | 29.6 | 27.5 | 31.8 | 22.7 | 20.5 | 25.1 |
| March | 27.6 | 25.3 | 30.2 | 21.0 | 19.1 | 23.0 |
| April | 29.4 | 26.7 | 32.3 | 18.3 | 16.7 | 20.1 |
| May | 29.4 | 26.0 | 33.2 | 16.6 | 15.2 | 18.2 |
| June | 26.5 | 23.7 | 29.7 | 14.4 | 13.3 | 15.7 |
| July | 24.6 | 22.4 | 27.2 | 13.2 | 12.3 | 14.2 |
| August | 22.8 | 20.6 | 25.3 | 13.4 | 12.4 | 14.6 |
| September | 22.4 | 20.5 | 24.5 | 13.2 | 12.3 | 14.2 |
| October | 22.4 | 20.8 | 24.2 | 11.6 | 10.7 | 12.7 |
| November | 22.1 | 20.6 | 23.6 | 11.3 | 10.5 | 12.1 |
| December | 22.2 | 20.7 | 23.7 | 11.1 | 10.5 | 11.9 |
| Sources: Statistics Canada, Labour Force Survey special tabulation; and U.S. Bureau of Labor Statistics. | ||||||
Throughout the summer of 2020, as employees began to return to their workplaces, the work-from-home rates declined at about the same pace in both countries. Canada had a bigger decrease in June, but the rate of decline converged after that. However, when the second wave of COVID-19 began in the fall of 2020, these rates began to diverge. While more employees worked from home during this wave, the rise was much more pronounced in Canada. During the third wave, in April and May 2021, only Canada experienced an increase in work-from-home rates relative to the summer of 2020. By December 2021, the percentage of employees working from home had fallen to about 22% in Canada and 11% in the United States.
The greater variation in work-from-home rates in Canada during successive waves of the pandemic could be the result of differences in the intensity of COVID-19 restrictions between the two countries. According to the University of Oxford’s COVID-19 Government Response Tracker (2020), restrictions in Canada were slightly more stringent at the onset of the pandemic; however, the decline in stringency was about the same for Canada and the United States throughout the spring and summer of 2020.Note Measures began to become more stringent again in the fall of 2020 at more or less the same rate between the two countries. However, into and throughout 2021, Canada’s stringency level was significantly higher than that in the United States, suggesting that COVID-19 measures in the United States tended to be less restrictive than those in Canada during this period.NoteNote
Women had higher rates of working from home than men in both countries
In both countries, female employees tended to work from home more than male employees, and, in Canada, the rates for both men and women were higher than in the United States. In May 2020, roughly 43% of Canadian female employees worked from home, while 31% of male employees did so. While the percentage of U.S. men working from home (31%) was about the same as in Canada in May, the rate for female employees in the United States (41%) was slightly lower.
From June to September 2020, the proportion of men and women working from home declined at about the same pace in both countries, before diverging in the fall during the second wave. By December 2021, the percentage of female employees working from home in Canada had fallen to about 24%, while the rate for male employees had declined to 21%. The rates in the United States were considerably lower: 12% for women and 11% for men.
Some of the difference between the rates for men and women can be explained by the relative concentration of women in industries where working from home is more practical (Messacar et al., 2020). In sectors that tend to have relatively more male workers, such as construction, durable goods manufacturing and agriculture, working from home is less feasible. Deng et al. (2020) estimated that in 2019, telework capacity—the number of jobs that can plausibly be performed from home—ranged from less than 15% in construction and agriculture and less than 20% in manufacturing to around 84% to 85% in finance and insurance; educational services; and professional, scientific and technical services.
As well, women tended to play a bigger role in homeschooling and childcare during the pandemic. In 2020, the majority (64%) of women in Canada reported that they had mostly performed homeschooling or helping children with homework up to that point in the pandemic, when daycares were closed or had limited capacity, and school classes were moved online (Leclerc, 2020). This would have been less of a factor in 2021 as schools and daycares reopened, and this may help explain further declines in work-from-home rates in Canada.
Core-age employees tended to work from home more
Generally speaking, core working-age employees—those aged 25 to 54—were more likely to work from home during the pandemic than employees in other age groups, in both Canada and the United States. Again, while the rates decreased at about the same pace early on, they diverged in the fall of 2020, and the U.S. rate declined faster thereafter. In Canada, the percentage of core-age employees working from home was about 43% in May 2020, while the rate in the United States was somewhat lower, at around 39%. By December 2021, 26% of core-age employees in Canada worked from home, compared with 13% in the United States.
Younger employees were the least likely to work from home in both countries. In Canada, in May 2020, roughly 16% of younger workers worked from home. In the United States, the rate was slightly higher, at 19%. Again, the rate declined to a greater extent in the United States compared with Canada. By December 2021, the percentage of youth working from home in Canada was just over 8%, while in the United States the rate was just over 3%.
The work-from-home rate among older employees—those aged 55 and older—lay between those reported for core-age workers and youth, but closer to the former. In Canada, nearly 28% of older employees worked from home in May 2020. In the United States, the percentage was higher, at just over 33%. Again, the decline was steeper in the United States. By December 2021, 20% of older Canadians worked from home, about twice the rate observed in the United States.
Full-time employees worked from home more than part-time employees
Full-time employees tended to work from home more than part-time employees, in both Canada and the United States (Chart 2). At the onset of the pandemic, the proportion of full-time employees working from home was about the same in both countries (39% in Canada and 38% in the United States). By December 2021, Canada’s rate had declined to about 25%, while the rate in the United States had fallen to just over 12%. Changes in these rates were also more pronounced in Canada during successive waves of the pandemic than they were in the United States.
Similarly, the proportion of part-time employees working from home declined throughout the pandemic. Canada’s rate fell from roughly 22% in May 2020 to 10% in December 2021. In the United States, the rate fell from 21% to 5%.

Data table for Chart 2
| Canada full time | Canada part time | U.S. full time | U.S. part time | |
|---|---|---|---|---|
| % of total employment by work status | ||||
| 2020 | ||||
| May | 38.6 | 22.2 | 38.0 | 21.0 |
| June | 31.5 | 15.0 | 33.5 | 19.4 |
| July | 29.1 | 13.2 | 28.5 | 15.6 |
| August | 26.8 | 11.5 | 26.5 | 12.6 |
| September | 26.3 | 11.2 | 24.8 | 12.0 |
| October | 26.8 | 12.4 | 23.2 | 12.2 |
| November | 28.1 | 12.8 | 23.8 | 12.2 |
| December | 29.7 | 12.0 | 25.9 | 12.8 |
| 2021 | ||||
| January | 34.6 | 16.1 | 25.5 | 12.0 |
| February | 32.5 | 15.4 | 24.8 | 12.2 |
| March | 30.4 | 14.5 | 22.9 | 11.3 |
| April | 32.1 | 15.7 | 20.0 | 9.7 |
| May | 32.1 | 14.8 | 18.2 | 8.4 |
| June | 29.3 | 12.5 | 16.0 | 6.8 |
| July | 27.3 | 10.4 | 14.6 | 6.1 |
| August | 25.1 | 10.3 | 14.8 | 6.4 |
| September | 24.9 | 10.2 | 14.5 | 6.8 |
| October | 24.6 | 12.2 | 12.9 | 5.6 |
| November | 24.6 | 10.0 | 12.5 | 5.2 |
| December | 24.8 | 9.9 | 12.4 | 5.1 |
| Sources: Statistics Canada, Labour Force Survey special tabulation; and U.S. Bureau of Labor Statistics. | ||||
More educated employees were more likely to work from home
Educational attainment was strongly correlated with differences in work arrangements during the pandemic. In general, the higher an employee’s level of education (high school diploma, some college or university education, and college or university degree or higher), the more likely the employee was to work from home. Notable differences were again apparent between the two countries, with higher work-from-home rates in Canada.
Employees with a high school diploma as their highest level of education tended to work from home less during the pandemic, compared with those with higher levels of education. Early in the pandemic, 17% of Canadians with a high school diploma worked from home. This fell to less than 10% by December 2021. In the United States, the rate declined from slightly more than 13% to 3% over this period.
Those with college or university degrees tended to work from home the most. In Canada and the United States, the rates were about the same, at roughly 60%, early in the pandemic. By December 2021, the rate in Canada had fallen to slightly less than 40%, while in the United States, the rate declined to 22%.
Industry was a significant factor influencing the feasibility of working from home
All of the previous differences in work-from-home rates—related to sex, age, full-time or part-time employment status, and education—have much to do with underlying industry differences, regardless of country. Some industries are more conducive to working from home than others. Along this spectrum, some industries have larger male–female employee ratios, some have skill requirements that involve different levels of education, some have higher levels of youth employment and some have high levels of full-time workers compared with part-time workers.
Generally, industries with the highest rates of work from home tend to be professional services, such as educational services; professional and technical services; financial activities; information, culture and recreation; and public administration. In these sectors, employees can still perform their jobs reasonably well outside the workplace.
The ability to work from home is lower in industries that require more person-to-person contact, such as accommodation and food services, and retail trade. Similarly, capital-intensive sectors such as manufacturing, resource extraction and transportation services - sectors that require working with large machinery for example - also have a limited scope for home-based work, certainly at the production level.
While these basic industry differences are apparent in both Canada and the United States, rates of work from home do differ within industries. While industries such as educational services, professional and technical services, financial activities, and real estate activities all had relatively high rates of work from home, rates within these industries were higher in Canada than in the United States (Table 1). The United States had higher rates than Canada, at least early in the pandemic, in manufacturing, construction and retail trade.
| Industry | May 2020 | December 2021 | ||
|---|---|---|---|---|
| Canada | United States | Canada | United States | |
| % of total employment by industry | ||||
| Industry totalTable 1 Note 1 | 36.7 | 36.5 | 22.3 | 11.6 |
| Construction | 13.3 | 14.7 | 5.1 | 3.1 |
| Manufacturing | 20.3 | 30.3 | 13.5 | 11.4 |
| Wholesale trade | 27.7 | 31.4 | 21.8 | 10.6 |
| Retail trade | 9.5 | 16.7 | 6.2 | 4.8 |
| Transportation and warehousing | 14.4 | 11.8 | 12.7 | 3.4 |
| Utilities | 52.9 | 36.6 | 27.3 | 16.7 |
| Information, culture and recreation | 62.3 | 61.0 | 40.6 | 27.6 |
| Financial activities | 71.2 | 60.1 | 58.3 | 25.7 |
| Professional and technical services | 76.8 | 64.1 | 57.3 | 30.1 |
| Educational services | 80.6 | 76.3 | 17.2 | 9.9 |
| Health care and social assistance | 19.3 | 25.4 | 11.2 | 8.1 |
| Accommodation and food services | 10.0 | 8.0 | 1.0 | 2.2 |
| Other services | 23.7 | 28.2 | 19.3 | 6.2 |
| Public administration | 59.6 | 45.5 | 50.4 | 20.7 |
|
||||
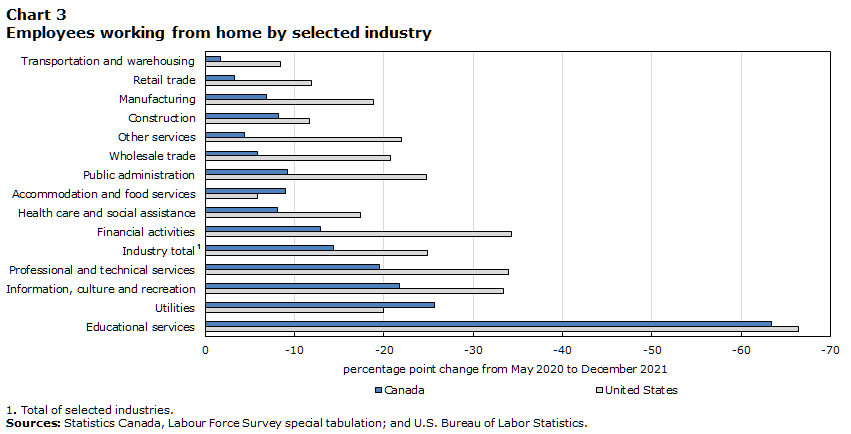
Throughout the course of the pandemic, the percentage of those working from home declined across all industries. The decreases were generally faster in the United States than in Canada, and there was significant variation from industry to industry (Chart 3). The largest declines within both countries were in educational services; information, culture and recreation; and professional and technical services.
In educational services, the declines in rates from May 2020 to December 2021 were relatively similar between both countries (down 63.4 percentage points in Canada and 66.4 percentage points in the United States) as both emphasized getting students back to school quickly. Other industries, such as information, culture and recreation (down 21.8 percentage points in Canada and 33.4 percentage points in the United States) and financial activities (down 12.9 percentage points in Canada and 34.3 percentage points in the United States) had significantly different rates of decline.
In utilities (down 25.7 percentage points in Canada and 20.0 percentage points in the United States) and accommodation and food services (down 9.0 percentage points in Canada and 5.8 percentage points in the United States), the rate of decline was smaller in the United States than in Canada. However, these two were the only exceptions.
Data table for Chart 3
| Industry | Canada | United States |
|---|---|---|
| percentage point change from May 2020 to December 2021 | ||
| Transportation and warehousing | -1.7 | -8.4 |
| Retail trade | -3.3 | -11.9 |
| Manufacturing | -6.8 | -18.9 |
| Construction | -8.2 | -11.6 |
| Other services | -4.4 | -22.0 |
| Wholesale trade | -5.8 | -20.7 |
| Public administration | -9.2 | -24.8 |
| Accommodation and food services | -9.0 | -5.8 |
| Health care and social assistance | -8.1 | -17.3 |
| Financial activities | -12.9 | -34.3 |
| Industry totalData table Note 1 | -14.4 | -24.9 |
| Professional and technical services | -19.5 | -34.0 |
| Information, culture and recreation | -21.8 | -33.4 |
| Utilities | -25.7 | -20.0 |
| Educational services | -63.4 | -66.4 |
|
||
Conclusion
Throughout the pandemic, the percentage of Canadian employees working from home tended to be higher than that of their counterparts in the United States. Even within the countries there were significant differences when comparing employees by sex, age group, full-time or part-time employment status, and education level. Much of these differences were likely driven by the type of industry in which an employee worked.
While the percentage of employees working from home was fairly similar in both countries in May 2020, Canadian employees were twice as likely as their U.S. counterparts to be working from home by December 2021. Canada also experienced more variation than the United States in work-from-home rates throughout the pandemic. The stringency of COVID-19 measures was roughly the same in Canada and the United States throughout 2020. However, measures were more stringent in Canada than in the United States in 2021.
References
Clarke, S., J. Dekker, N. Habli, R. Macdonald and C. McCormack. 2022. Measuring the correlation between COVID-19 restrictions and economic activity. Analytical Studies: Methods and References. Statistics Canada Catalogue no. 11-633-X — No. 040.
Deng, Z., R. Morissette and D. Messacar. 2020. Running the economy remotely: Potential for working from home during and after COVID-19. StatCan COVID-19: Data to Insights for a Better Canada. Statistics Canada Catalogue no. 45280001. Ottawa: Statistics Canada.
Leclerc, K. 2020. Caring for their children: Impacts of COVID-19 on parents. StatCan COVID-19: Data to Insights for a Better Canada. Statistics Canada Catalogue no. 45280001. Ottawa: Statistics Canada.
Messacar, D., R. Morissette and Z. Deng. 2020. Inequality in the feasibility of working from home during and after COVID-19. StatCan COVID-19: Data to Insights for a Better Canada. Statistics Canada Catalogue no. 45280001. Ottawa: Statistics Canada.
University of Oxford. COVID-19 Government Response Tracker (https://www.bsg.ox.ac.uk/research/research-projects/covid-19-government-response-tracker).
- Date modified: