
Demographic Documents
Defining Canada’s Downtown Neighbourhoods: 2016 Boundaries
by François Sergerie, Karl Chastko, Dylan Saunders and Patrick Charbonneau
Definitions
Standard Geographical Classification (SGC):
Census metropolitan area (CMA): Area consisting of one or more neighbouring municipalities situated around a core. A CMA must have a total population of at least 100,000 of which 50,000 or more must live in the core, according to the last census.
Census subdivision (CSD): The general term for municipalities (as determined by provincial/territorial legislation) or areas treated as municipal equivalents for statistical purposes (e.g., Indian reserves, Indian settlements, and unorganized territories). Municipal status is defined by laws in effect in each province and territory in Canada.
Dissemination area (DA): A small, relatively stable geographic unit composed of one or more adjacent dissemination blocks with an average population of 400 to 700 persons based on data from the previous Census of Population Program. It is the smallest standard geographic area for which all census data are disseminated. DAs cover all the territory of Canada.
Classification specific to this article:
Centroid: The geometric centre of a featured geographical unit. In this present article, the DA is the featured geographical unit.
Downtown core: The dissemination areas encompassing the highest job density based on the place of work information from the census.
Downtown neighbourhood: Area composed of the downtown core, and the encompassing one-kilometre adjacent area surrounding the core.
This article presents the boundaries of downtowns, based on the 2016 Standard Geographical Classification. The boundaries will be revised in 2021, when the Dissemination Areas from the 2021 SGC are finalized. This revised version of the geography will be the one used in the 2021 Census analytical products.
End of text boxIntroduction
Canada is a highly urbanized country. In 2020, nearly three quarters (71.8%) of Canadians lived in one of Canada’s Census Metropolitan Areas (CMAs). Additionally, in 2019/2020 the average population growth rate within CMAs was +1.3% which was two times larger than the growth rate observed in the rest of Canada (+0.6%).
Understanding the dynamics of Canada’s urban population has become the focus of many studies ranging from access to health care (Canadian Institute for Health Information, 2006), exposure to environmental pollutants (Marshall, Brauer and Frank, 2009), access to jobs, commuting, and travel behaviour (Savage, 2019), immigration settlement patterns (Zuberi, Ivemark and Ptashnick, 2018) and population growth (Gordon, Hindrichs and Willms, 2018). These studies all attempt to understand Canada’s ever-changing urban populations. The COVID-19 pandemic also created new dynamics between urban and rural regions and inside urban regions, notably in regards to migration trends.
Due to the diversity and complex distribution of Canada’s population within urban regions, there is a growing demand for analysis of urban subpopulations in Canada. One important area of interest is the downtown neighbourhoods of Canada’s major urban centres.
In Canadian cities, downtown neighbourhoods typically consist of areas containing highly concentrated commercial, residential, cultural and historic buildings relative to other parts of the city (Canadian Urban Institute, 2013). These neighbourhoods are often defined by informal boundaries constructed by public perception, rather than formal administrative boundaries (Canadian Urban Institute, 2013). When formal downtown neighbourhood boundaries are present, these boundaries are often derived from city-specific zoning bylaws or represent business improvement areas. These formal definitions of downtown may exclude other important neighbourhoods which are pertinent to understanding the dynamics of these important geographic areas. The subjectivity of defining downtown neighbourhoods presents significant barriers to researching social and economic trends within these areas.
Currently Statistics Canada does not provide a geographic unit representative of downtown neighbourhoods within its Standard Geographical Classification. This is a data gap given the important role these regions play in our increasingly urban nation.
There is a clear demand for the development of a standardized method to develop geographic boundaries representative of Canada’s diverse downtown neighbourhoods allowing for comparison of these areas across Canada. This article aims to identify the principal downtown neighbourhood for each of the 36 CMAsNote in Canada as well as the five of the largest CAs.Note These boundaries would enable in-depth analysis of current and emerging social, and economic trends within downtown neighbourhoods across Canada. Moreover, these boundaries would allow for more effective dissemination of essential statistics by Statistics Canada.
Cities are constantly evolving and changing. In recent years Canadian cities have been adapting to meet challenges presented by urban sprawl, the decentralization of work, remaining competitive in an increasingly globalized economy, and meeting housing demands presented by immigration and interprovincial migration. The effect that these challenges are having on cities is often most evident in downtown neighbourhoods. Many Canadian cities have introduced downtown revitalization plans designed to combat these challenges by attracting new businesses and professionals, while creating more diverse, dense and resilient cities (City of Toronto, 2020; City of Montréal, 2016; City of Regina, 2016). While these strategies have been successful in some cities, others have suffered significantly from declining manufacturing and resource sectors, decentralization of work and aging populations. The outcomes of these negative effects are often expressed through declining downtown neighbourhoods within these cities. Given the relationship between the welfare of downtown neighbourhoods and the prosperity of cities, there is a need for standardized geographic boundaries representative of Canada’s diverse downtown neighbourhoods (Canadian Urban Institute, 2013; Hernandez and Jones, 2005).
Current Methods
Defining downtown neighbourhoods is challenging because these areas largely exist as informal geographic areas. The boundary of a downtown neighbourhood may depend on the perception of an individual relating to cultural, and historical considerations but may also consider physical and administrative boundaries present in the city such as major roads or municipal electoral boundaries (Turcotte, 2008). Due to the complex interplay of these concepts, formally defining downtown neighbourhoods has long been a challenge.
Three main methods are often used to define and study downtown neighbourhoods. These methods include utilizing spatial buffer analysis to delineate downtown neighbourhoods, defining downtown neighbourhoods based on city-specific zoning bylaws and local planning areas, and by using expert knowledge to identify downtown neighbourhoods. Each of these methods presents unique opportunities and challenges which will be discussed in the following sections, using Vancouver as a case study.
Buffer Analysis
The simplest and most widely used method for delineating downtown neighbourhoods is to apply a simple radial buffer to the coordinates of a city’s town hall (Savage, 2019; United States Census Bureau, 2012). Radial buffers produce circular areas based on the radius selected by the analyst. Map 1 provides an example of radial buffer analysis applied to Vancouver, Canada. It displays the location of Vancouver’s city hall with one, two- and three-kilometre buffers applied to it.

Description for Map 1
This map presents the downtown of Vancouver, identified with a buffer analysis around the City Hall. The buffers cover distances of 1 km, 2 km and 3 km and are identified in shades of purple.
This method is very popular due to its standardized methodology and the ease with which it can be calculated. The only data it requires are the location of city hall and a radial buffer distance. This method assumes that city hall is located in the core of a city and that the area surrounding city hall is representative of a downtown neighbourhood. In some cities this assumption is valid, however, in many cities the location of city hall does not correspond to areas containing typical attributes of a downtown neighbourhood.
In addition to the potential for spatial misalignment of city hall and downtown neighbourhoods, radial buffers cannot effectively delineate the irregular shapes of downtown neighbourhoods. Given that downtowns are often confined by physical features such as major roads, water bodies and topographic features, the confining effects of these features are unaccounted for by buffer analysis. These factors represent strict limitations for this methods application to Canadian cities.
Zoning Data and Other Planning Areas
Another popular method used to delineate downtown neighbourhoods for the analysis of urban populations is to define downtown neighbourhoods from city-specific zoning bylaws or other local planning areas available in a given city (Filion, 2008; Feit and Feehan, 2006). Zoning bylaws dictate what types of developments can be built in different areas of a city. City zoning plans sometimes explicitly define the boundary of downtown neighbourhoods allowing for clear definitions of these areas. When explicit boundaries are not defined, these areas can be constructed using zoning information of areas which approximate the boundaries of the perceived downtown neighbourhoods identified with expert judgment. Map 2 presents the downtown comprehensive zoning area defined by the city of Vancouver (City of Vancouver, 2020). Note the large discrepancy between the location of this downtown and the downtown identified using buffer analysis in Map 1.

Description for Map 2
This map presents the downtown of Vancouver, according to zoning bylaws. The downtown is identified in purple.
Source: City of Vancouver Open Data, https://opendata.vancouver.ca/explore/dataset/zoning-districts-and-labels/map/?refine.category=Comprehensive+Development&refine.zone_name=DD&location=14,49.28208,-123.1197
A primary limitation of this approach is that city zoning bylaws are socially constructed through political processes and therefore can change significantly over time based on popular opinion or strategically for economic and political motives.
For example, in 1986 the provincial government of British Columbia rezoned and redeveloped large tracts of land which now comprise part of downtown Vancouver to facilitate Expo 86. Expo 86 attracted significant foreign interest in real-estate developments in Vancouver which ultimately resulted in the sale of the provincially owned Expo grounds to foreign investors, largely driven by political and economic motivations. Expo 86 remains a controversial and pivotal moment in Vancouver’s history.
As a result, zoning data must be interpreted with care to ensure that appropriate areas are identified as downtown neighbourhoods. Additionally, city zoning is generally unique to each city, therefore zoning types cannot be directly compared between cities. Similar challenges apply when other local planning areas are used, see Maps 3 and 4 for additional examples in Vancouver (City of Vancouver, 2020 for Map 3; City of Vancouver, 2020 for Map 4).
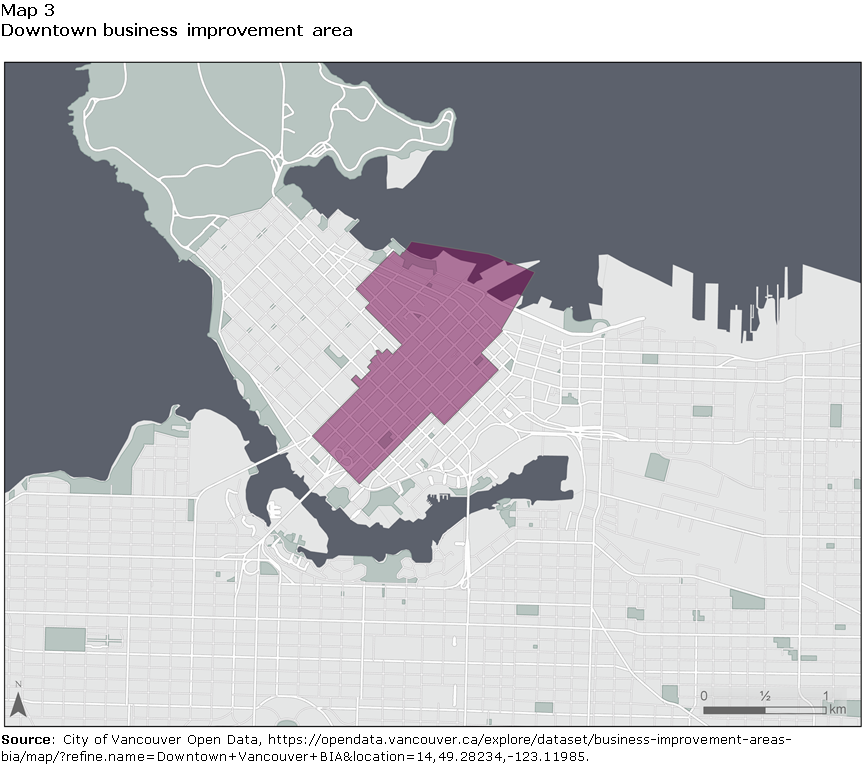
Description for Map 3
This map presents the downtown of Vancouver, defined by business improvement area. The downtown is identified in purple.
Source: City of Vancouver Open Data, https://opendata.vancouver.ca/explore/dataset/business-improvement-areas-bia/map/?refine.name=Downtown+Vancouver+BIA&location=14,49.28234,-123.11985

Description for Map 4
This map presents the downtown of Vancouver, defined by local planning area. The downtown is identified in purple.
Source: City of Vancouver Open Data, https://opendata.vancouver.ca/explore/dataset/local-area-boundary/map/?refine.name=Downtown&location=13,49.28267,-123.11848
Expert Judgment
Expert judgment is another common method used to delineate downtown neighbourhoods (Gordon, Hindrichs and Willms, 2018; Canadian Urban Institute, 2013). This method consists of consulting with local and urban experts, who are familiar with the social, cultural, and economic features of a city, to identify downtown neighbourhoods. Often these experts will draw on their knowledge of an area as well as select objective measures such as population density, job density and accessibility measures to help delineate downtown neighbourhoods. An example of this can be seen in Map 5, this downtown area was developed by local experts as part of a larger study of downtown neighbourhoods across Canada (Canadian Urban Institute, 2013).
This method could be problematic if conducted on a large scale, given that local expertise does not lead to consistency for definitions used throughout the country. Hence, this method could be more suited as a complement of a more data-driven approach.
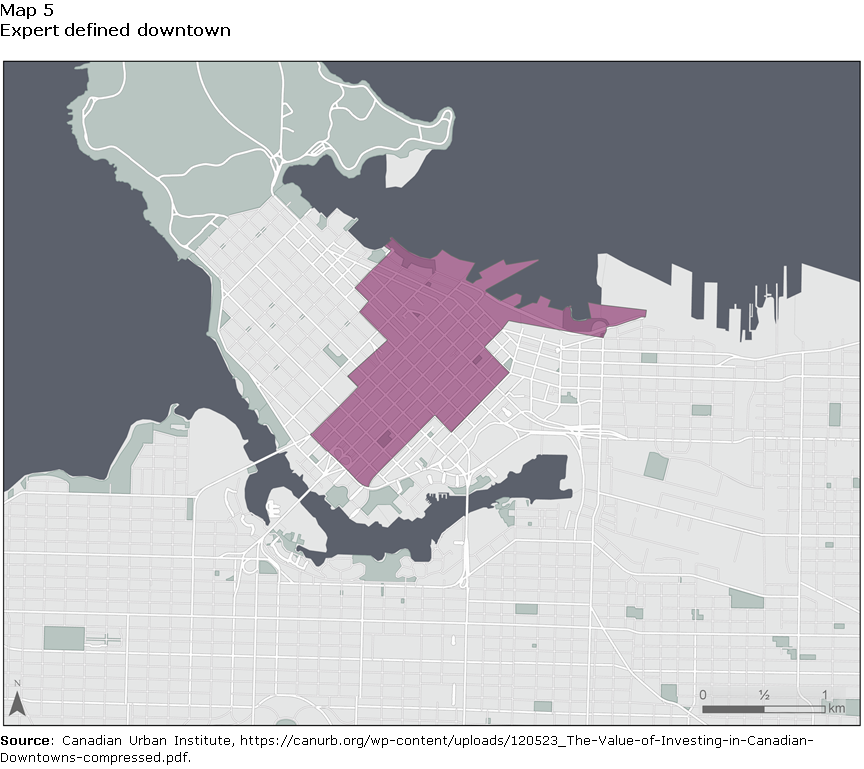
Description for Map 5
This map presents the downtown of Vancouver, defined by expert judgment. The downtown is identified in purple.
Source: Canadian Urban Institute, https://canurb.org/wp-content/uploads/120523_The-Value-of-Investing-in-Canadian-Downtowns-compressed.pdf
Solution
Despite the widespread use of the previously discussed methods, the limitations of these approaches’ present challenges for delineating downtown neighbourhoods across Canada’s 36 CMAs. The number and diversity of CMAs in Canada require a method to delineate downtown neighbourhoods that is robust, repeatable, and transparent.
This study uses a modified version of the methods developed by Levy and Gilchrist (2014) to delineate downtown neighbourhoods in the United States. Levy and Gilchrist utilized job count data aggregated by census tracts, from the State Labour Market database and U.S. Census Bureau and applied spatial statistics to identify downtown neighbourhoods across the United States in a standardized and repeatable method.
Data
Enumeration unit
The 2016 Canadian Census of Population made it possible to develop a methodology, like Levy and Gilchrist’s, to identify downtown neighbourhoods. One distinct modification that was made was to analyze job count data at the dissemination area (DA) level rather than the census tract (CT). Dissemination areas were chosen because they provided jobs counts for a smaller area than CTs which were used by Levy and Gilchrist. Dissemination areas are also well suited for this analysis due to the following characteristics:
- They are the smallest standard geographic area for which detailed census data are disseminated;
- They respect the boundaries of census subdivisions and census tracts;
- They are uniform in terms of population size, which is usually targeted from 400 to 700 persons to avoid data suppression when disseminating the data;
- They usually remain unchanged from one census to another (with some exceptions), making historical comparisons easier;
- They are compact in shape (to the extent possible while respecting the previous criteria).
Census tracts were considered for this analysis but were ultimately excluded from the final analysis. In many CMAs the CTs were too large to accurately delineate downtown neighbourhoods, for this reason CTs were excluded from the analysis.
Job Counts
The primary data source used by Levy and Gilchrist to delineate downtown neighbourhoods was job counts. Areas with a high number of jobs, relative to other areas within a CMA, are often associated with central business districts or urban cores. Despite the effects of the decentralization of work, city cores still contain the highest number of jobs in cities across Canada when viewed from the CMA level.
In the Canadian census, job count information can be obtained from the Place of Work Dissemination Area (PWDA)Note variable. This information is directly provided by census respondents (Question 42 in the 2016 Census). PWDA is divided into four categories: Worked at home (including farms); Worked outside Canada; No fixed workplace address; and Usual workplace address. In the context of this study, job counts were calculated as the sum of census respondents that reported a specific work address or worked from home. This decision was made to capture the effects of changing work cultures characterized by more people working from home or operating home businesses, and to capture people who participate in the gig economy. In the context of the COVID-19 pandemic, locating home workers will be even more relevant for future updates of the geography. By including job counts from individuals with a specific work address or worked from home, this method accounts for more robust forms of work which may vary spatially within a city. People who reported no fixed workplace address were excluded from this study because their job location was not reported.
Methods
Job Count Transformation
Total job counts, derived from the place of work status variable, are represented as the total number of jobs within a DA. Downtown neighbourhoods cannot be directly defined from this data because job counts are area dependant. Larger DAs may have higher job counts than smaller DAs due to difference in the area of the DA. When a variable is area dependant, observations from areas of different sizes cannot be directly compared.
Additionally, the rigid boundaries of DAs present the spatial distribution of jobs as a discrete spatial process rather than a continuous process. This is deceiving because, in reality the spatial distribution of jobs is not homogeneous within DAs or confined by the boundaries of a DA. The spatial distribution of jobs would be better represented as a continuous spatial process when viewed from the CMA level.
To address these issues, the total job counts for each DA were redistributed as a number of points equal to the total number of jobs within each DA, this can be seen in Map 6. When job counts are enumerated within a DA information about the spatial processes which determines the distribution of jobs are lost, therefore when job counts are redistributed as points representing jobs, the points are assigned randomly within the DAs. Although the points may not represent the true location of jobs, they allow for the development of a continuous job density surface which represents the spatial distribution of jobs across a CMA. This was achieved by calculating a kernel density estimate from the points in every CMA.

Description for Map 6
This map presents random points equal to the total job count within each dissemination area in Vancouver. Note that 1 point is equal to 50 jobs for demonstrative purposes.
Kernel Density Estimate
A spatial kernel density estimate is a statistical method used to calculate a density surface, from point observations, of a spatial process. Kernel density estimation was chosen over other spatial estimation techniques because it is easy to implement. Kernel estimation requires three inputs: point observations of a spatial process, a kernel function with a specific bandwidth or search radius and, a grid of cells over which estimates are assigned. Figure 1 displays an example of how a kernel density surface is calculated.

Data table for Figure 1
Schematic diagram of a spatial kernel density estimation. 1: Point observations of a spatial process within a given area. 2: Kernel density estimates are made at every location (X, Y), based on all observation that fall within the band width (h) using the kernel function (K). 3: Estimates of the spatial process are made at all locations across the area, including areas without point observations.
The first step is selecting a kernel function and bandwidth. Common kernel functions are Uniform, Gaussian, and Quadratic. These functions dictate how point observations are weighted when encountered by the kernel window. For this analysis a quadratic kernel function was used, see Equation 1.
Equation 1:
where:
i = 1 to n are
the number of within the bandwidth.
bandwidth is
the search radius selected for the kernel.
disti is the distance between point i and the (X,Y) location
of the kernel window.
The search bandwidth of the kernel determines how large of an area the kernel will use to calculate density estimates. The bandwidth is based on the linear unit associated with the projection of the point data. Larger bandwidths produce smoother more generalized density surfaces while smaller bandwidths create density surfaces which maintain local variability and are less generalized. For this study, bandwidths were calculated for every CMA based on the spatial distribution of points representing job locations with Silverman’s Rule. This was done to ensure an appropriate level of variability was modelled for each CMA.
Lastly, the output cell size must be specified. In this study an output cell size of ten metres was selected to ensure consistency across CMAs and to obtain precise spatial estimates of job density. The final output of the kernel density estimates is a job density surface representing the estimated number of jobs per square kilometre for a given CMA. The job density surface consists of a grid of ten metres by ten-metre cells covering the entire CMA where each grid cell contains a job density estimate. Map 7 displays a subset of the kernel density surface calculated for Vancouver.

Description for Map 7
Job density surface, calculated from the kernel density estimate, overlaid with job points. Job dense areas are presented in bright purple transitioning to light blue for areas with low job densities. Each grey point represents 50 jobs.
Classification
Once the job counts were transformed into an area independent and spatially continuous process, areas with high job density could be identified. High job density areas were identified from the kernel density surface by classifying the density surface into ten groups using an equal interval classification. By classifying the data with an equal interval classification, high job density areas can easily be identified. An equal interval classification was chosen because the job counts display a near log-normal distribution across all CMAs in Canada. Most DAs within a CMA contain relatively low job counts while very few contain high job counts.
To account for the great variability of job counts across Canada’s CMAs, each CMA was classified into one of three groups based on the number of jobs within that CMA. These groups were used to assign the number of classes which represent the downtown core from the job density surfaces.
For CMAs with five hundred thousand or more jobs, the top six classes were used to identify the downtown core. For CMAs with one hundred thousand to five hundred thousand jobs, the top for four classes were used to identify the downtown core. For CMAs with fewer than one hundred thousand jobs, the top two classes were used to identify the downtown core. These classes represent job density cutoffs which can be used to identify the primary downtown core within each CMA. Class selection was based on empirical observations from all CMAs.
Downtown Core Selection
Due to the spatial variability of job density within a CMA, multiple areas may meet the job density cutoffs defined by the equal interval classification. To identify areas which represent the primary downtown core in each CMA a series of additional rules were applied:
- Where a single area which meets the cutoff exists, designate this area as the core;
- Where one large multi-lobed area exists, exclude areas which contain institutional facilities (universities and hospitals) and select the lobe which contains contiguous DAs with the highest total job counts;
- Where two or more areas exist, exclude areas which contain institutional facilities (universities and hospitals) and select the area with the highest total number of jobs (based on the job counts of DAs within each area). Additionally, if the areas are contained in two different CSDs select the area which resides within the CSD with the largest population. Examples include Kitchener-Waterloo-Cambridge (highest job count within the core and larger population by CSD), Saint Catharines-Niagara (fewer jobs within the core but larger population within the CSD) and Belleville (select the area with more jobs).
Once an area representative of the downtown core has been identified, the next step is to identify which DAs comprise this area. To mitigate the effects of the varying shapes and sizes of DAs the geometric centroid of each DA is calculated and intersected with the area representing the downtown core. Only DAs whose geometric centroid is contained within the downtown core are considered constituents of the downtown core. Map 8 displays the area that represent the downtown core derived from the kernel density surface as well as the DAs which comprise the downtown core.
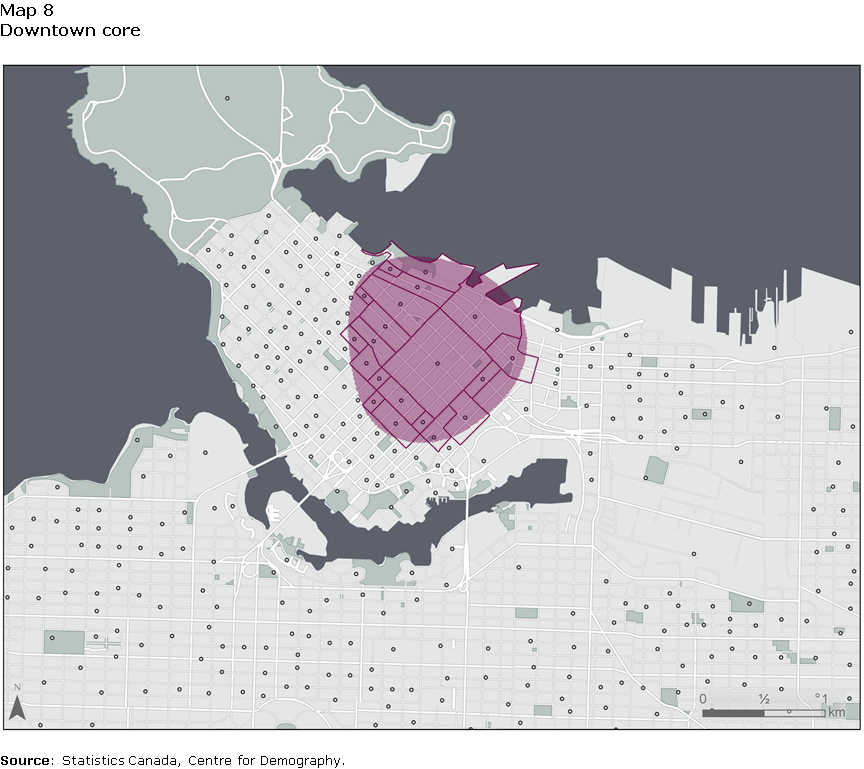
Description for Map 8
The downtown core identified from the kernel density estimate (purple) and the dissemination areas (DAs) which comprise the downtown core (purple outline). DA centroids shown as hollow dark grey dots.
Downtown Core Selection Exceptions
The method described above was able to effectively identify the primary downtown areas in the majority of CMAs. It was modified slightly to accommodate select CMAs which were incompatible with this method.
For CMAs with lower job counts that also have a high proportion of their workforce employed at hospitals, the cutoff for the downtown core was extended to include areas other than the DA which contains the hospital. In these cities, areas which met the kernel density cutoff only included the DA that contains the hospital. This violates rules ii and iii outlined in Downtown Core Selection. This adjustment was applied in Trois-Rivières, Chilliwack, and Nanaimo where the cutoff was extended from the top two classes of the kernel density to the top three (top four in the case of Nanaimo).
A modification of the method was also applied to Quebec City. The core identified from the kernel density surface was quite large and contained two lobes. One lobe primarily coincided with the Old City and the other coincided with the Quebec provincial legislative buildings. A core was selected following rule ii of Downtown Core Selection which aligned with the historic downtown. During the consultations, representatives from Quebec City requested that specific DAs from both the historic downtown and the legislative buildings were assigned as the downtown core and construct that downtown around those DAs.
Lastly, this method was not able to identify an appropriate downtown core in Red Deer and so the downtown core was selected manually. The DA containing the central business district is very large, which means that it has a relatively low job density despite having a high number of jobs. As a result, the kernel density estimate did not identify this area as a potential downtown core. Red Deer like Trois-Rivières, Chilliwack and Nanaimo has a large proportion of its workforce employed at its hospital. The DA containing the hospital dominates the kernel density surface effectively blocking the “traditional” downtown core from being identified. The core presented in the Appendix for Red Deer was manually selected based on the number of jobs in the DA and the presence of features typically associated with downtown such as historical buildings, mixed development, and administrative buildings.
Buffer Analysis
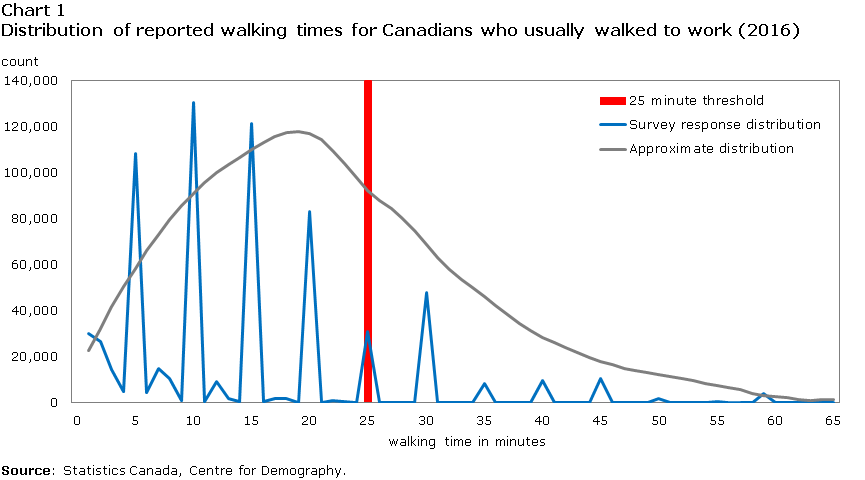
In addition to the downtown core, Levy and Gilchrist (2014) also included census tracts within a one-mile buffer of the core as part of the downtown. This was done to include more residential areas in the downtown rather than restricting the downtown to the commercial oriented core. In this analysis a one-kilometre buffer was applied to the downtown core DAs rather than a one-mile buffer. This decision was made based on an analysis of walking times reported by Canadians in the 2016 Census. The majority of Canadians who reported that they normally walk to work typically walked for 25 minutes, see Chart 1.
Data table for Chart 1
Distribution of reported walking times for Canadians who usually walked to work. Twenty-five minute cutoff shown in red, approximate distribution of walking times shown in grey, survey response data shown in blue.
| Walking time in minutes | Survey response distribution | Approximate distribution |
|---|---|---|
| number | ||
| 1 | 30,115 | 22,796 |
| 2 | 26,872 | 32,495 |
| 3 | 14,465 | 41,734 |
| 4 | 5,121 | 50,459 |
| 5 | 108,600 | 58,634 |
| 6 | 4,564 | 66,238 |
| 7 | 14,929 | 73,300 |
| 8 | 10,432 | 79,892 |
| 9 | 1,092 | 85,843 |
| 10 | 130,692 | 91,157 |
| 11 | 789 | 95,944 |
| 12 | 9,491 | 100,128 |
| 13 | 1,796 | 103,633 |
| 14 | 637 | 106,847 |
| 15 | 121,575 | 110,120 |
| 16 | 565 | 113,166 |
| 17 | 1,938 | 115,693 |
| 18 | 1,782 | 117,413 |
| 19 | 168 | 118,036 |
| 20 | 83,191 | 117,242 |
| 21 | 132 | 114,356 |
| 22 | 1,223 | 109,731 |
| 23 | 550 | 104,076 |
| 24 | 210 | 98,099 |
| 25 | 31,240 | 92,506 |
| 26 | 153 | 88,006 |
| 27 | 215 | 84,697 |
| 28 | 222 | 80,291 |
| 29 | 55 | 74,915 |
| 30 | 48,051 | 69,066 |
| 31 | 23 | 63,240 |
| 32 | 135 | 57,936 |
| 33 | 79 | 53,649 |
| 34 | 36 | 50,089 |
| 35 | 8,530 | 46,258 |
| 36 | 46 | 42,304 |
| 37 | 95 | 38,393 |
| 38 | 117 | 34,691 |
| 39 | 12 | 31,364 |
| 40 | 9,559 | 28,573 |
| 41 | 22 | 26,132 |
| 42 | 41 | 23,883 |
| 43 | 42 | 21,815 |
| 44 | 16 | 19,913 |
| 45 | 10,581 | 18,166 |
| 46 | 21 | 16,561 |
| 47 | 29 | 15,112 |
| 48 | 17 | 13,957 |
| 49 | 5 | 13,033 |
| 50 | 2,089 | 12,240 |
| 51 | 16 | 11,478 |
| 52 | 14 | 10,647 |
| 53 | 8 | 9,647 |
| 54 | 10 | 8,509 |
| 55 | 534 | 7,464 |
| 56 | 17 | 6,513 |
| 57 | 10 | 5,644 |
| 58 | 8 | 4,110 |
| 59 | 4,173 | 3,424 |
| 60 | 10 | 2,804 |
| 61 | 4 | 2,266 |
| 62 | 6 | 1,429 |
| 63 | 168 | 1,129 |
| 64 | 6 | 1,435 |
| 65 | 168 | 1,603 |
| Source: Statistics Canada, Centre for Demography. | ||
A 25 minutes walking travel buffer is roughly equal to a one-kilometre radial buffer and so for simplicity the one-kilometre radial buffer was applied. Dissemination areas whose centroid fell within the one-kilometre buffer of the downtown core are considered constituents of the downtown, see Map 9 for a graphical example.
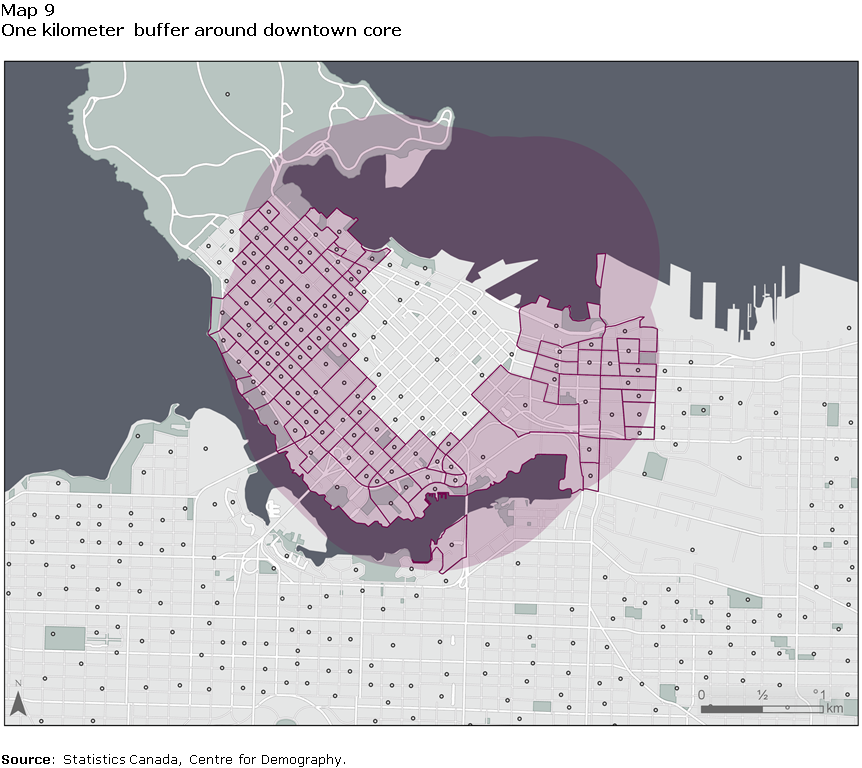
Description for Map 9
One kilometer buffer around downtown core dissemination areas (DAs) (light purple) and DAs whose centroid falls within the buffered area (purple outline). DAs centroids shown as hollow dark grey points.
These two regions, the downtown core and DAs within the one-kilometre buffered areas surrounding the core, represent the downtown, Map 10 displays the full downtown of Vancouver. These steps were applied to every CMA in Canada as well as the five largest CAs to delineate the downtown in each of these regions.

Description for Map 10
Downtown Vancouver dissemination areas (DAs), including core DAs and adjacent buffered DAs, shown in light purple with dark purple outline.
Consultations
Once preliminary downtown boundaries had been delineated, consultations were conducted with representatives from each municipality that contained a downtown. These consultations were conducted with the collaboration of the Statistical Geomatics Centre and the Regional Offices of Statistics Canada.
The municipalities received a map of the downtown and a list of the DAs which comprise the downtown area. Municipalities were given two months to provide written comments requesting changes to the preliminary downtown boundaries. Additionally, meetings were arranged with representatives from the core municipalities for the six largest CMAs to outline the project and receive direct feedback on the preliminary boundaries. All municipalities were invited to engage in meetings if they wished to clarify any aspects of the project and our methodology.
During the consultations, 30 of the 41 municipalities included in this project sent comments back. Additionally, meetings were organized with representatives from nine of these municipalities. Provincial and Territorial Statistical Focal Points were also consulted. The comments and discussions allowed us to develop additional rules to improve the methodology and helped validate our preliminary boundaries. Amendments were made to many of the downtown boundaries based on direct comments received during the consultations.
Additional Rules
Although each municipality only provided comments for their own downtown, the comments received could be broadly grouped into rules which could be applied to every downtown. Two rules were added to our methodology to assess the fit of the preliminary downtown boundaries generated by the original methodology:
- Ensure downtown boundaries respect significant human made barriers such as major roads, railways or walls which act as boundaries of the downtown. Remove DAs which straddle or extend beyond these features. If necessary add DAs to the downtown to approach these barriers i.e.) Highway 417 acts as the southern boundary of the downtown in Ottawa;
- Ensure downtown boundaries respect significant natural barriers such as rivers, waterbodies or cliffs and escarpments. Remove DAs which straddle or extend beyond these features. If necessary add DAs to the downtown to approach these barriers i.e.) The Niagara Escarpment acts as a natural boundary along the southern side of downtown Hamilton.
These rules were applied to every downtown where applicable. The downtown boundaries in municipalities which did not submit comments were altered based on these rules.
Final Adjustments
The downtown boundaries are constructed using DAs from the 2016 Census. Certain DAs are updated each census to account for population growth. To ensure that the downtown boundaries coalesce with the 2021 DAs, adjustments were made to the downtown boundaries to accommodate any changes made to the 2016 DA boundaries.
Additional Cities
During the consultation phase of this project participants expressed interest in expanding the scope of this project to delineate downtowns in CSDs which are not the core CSD of a CMA but still have large population and job counts. Based on these comments, it was decided to expand the project to delineate downtowns in CSDs with a population larger than one hundred thousand and more than fifty thousand jobs. Downtowns were delineated following the same methodology described above with minor adjustmentsNote and a separate round of consultations were conducted. Fourteen additional CSDs were identified as eligible cities as part of this expansion.Note
Results
For the purpose of this paper, maps outlying the downtown of every CMA and the five largest CA have been created (Appendix). The downtown of Vancouver is presented in Map 11 as an example.

Description for Map 11
Downtown Vancouver shown in light purple with dark purple outline.
To form the downtowns, a total of 1,711 DAs were selected. The total number of DAs is higher in the three largest CMAs, Toronto having the most (228) and Lethbridge and Nanaimo the fewest (9) (see Table 1).
The area of the downtowns is closely correlated with the number of DAs with a few outliers. Downtown Vancouver, for example, has one of the highest numbers of DAs (130), but has a relatively small downtown by area (6.2 km2), this is due to the high population density observed in downtown Vancouver.
Finally, the number of people working in the downtown scales well with the size of the CMA, reaching 503,577 in downtown Toronto. The proportion of the workers from the CMA working downtown is relatively consistent among CMAs, with a median of 17% and ranging between 6% in St. Catharines and 37% in Red Deer.
| Downtown name |
Downtown | Proportion of the CMA/CA | |||||
|---|---|---|---|---|---|---|---|
| DA count | Population | Jobs | Area | Population | Jobs | Area | |
| number | km2 | percent | |||||
| St. John's | 21 | 9,431 | 12,310 | 3.0 | 4.6 | 13.1 | 0.4 |
| Halifax | 32 | 20,267 | 48,295 | 4.1 | 5.0 | 24.8 | 0.1 |
| Moncton | 17 | 7,837 | 15,125 | 6.1 | 5.4 | 21.3 | 0.2 |
| Saint John | 17 | 7,552 | 11,670 | 2.4 | 6.0 | 21.8 | 0.1 |
| Fredericton | 22 | 11,007 | 12,690 | 6.5 | 10.8 | 28.0 | 0.1 |
| Saguenay | 14 | 6,349 | 10,745 | 3.3 | 3.9 | 16.0 | 0.1 |
| Québec | 52 | 29,788 | 54,405 | 5.2 | 3.7 | 13.6 | 0.2 |
| Sherbrooke | 25 | 12,427 | 15,495 | 4.7 | 5.9 | 16.7 | 0.3 |
| Trois-Rivières | 18 | 7,858 | 7,940 | 2.0 | 5.0 | 11.9 | 0.2 |
| Montréal | 115 | 88,169 | 299,245 | 13.2 | 2.2 | 15.8 | 0.3 |
| Gatineau | 21 | 9,877 | 33,930 | 3.9 | 3.0 | 27.8 | 0.1 |
| Ottawa | 106 | 62,725 | 124,865 | 9.7 | 6.3 | 24.0 | 0.3 |
| Kingston | 18 | 8,288 | 19,455 | 2.6 | 5.1 | 25.7 | 0.1 |
| Belleville | 25 | 12,340 | 5,865 | 5.2 | 11.9 | 12.3 | 0.4 |
| Peterborough | 30 | 15,948 | 12,830 | 5.8 | 13.1 | 25.2 | 0.4 |
| Oshawa | 31 | 16,055 | 13,470 | 4.9 | 4.2 | 11.5 | 0.5 |
| Toronto | 228 | 237,698 | 503,575 | 16.6 | 4.0 | 18.1 | 0.3 |
| Hamilton | 89 | 48,510 | 38,055 | 7.7 | 6.5 | 12.7 | 0.6 |
| St. Catharines | 27 | 14,442 | 9,855 | 4.3 | 3.6 | 6.3 | 0.3 |
| Kitchener | 49 | 27,092 | 21,100 | 8.0 | 5.2 | 8.6 | 0.7 |
| Brantford | 22 | 11,134 | 5,890 | 3.7 | 8.3 | 11.2 | 0.3 |
| Guelph | 25 | 13,497 | 9,425 | 4.6 | 8.9 | 11.3 | 0.8 |
| London | 40 | 23,220 | 35,750 | 7.3 | 4.7 | 16.6 | 0.3 |
| Windsor | 24 | 11,633 | 13,145 | 2.5 | 3.5 | 9.8 | 0.2 |
| Barrie | 28 | 13,343 | 9,745 | 5.8 | 6.8 | 13.3 | 0.6 |
| Sudbury | 23 | 12,590 | 10,465 | 6.8 | 7.6 | 14.8 | 0.2 |
| Thunder Bay | 24 | 10,818 | 4,430 | 3.7 | 8.9 | 8.6 | 0.1 |
| Winnipeg | 64 | 42,394 | 70,870 | 7.3 | 5.4 | 19.5 | 0.1 |
| Regina | 34 | 18,520 | 41,090 | 8.2 | 7.8 | 35.2 | 0.2 |
| Saskatoon | 26 | 12,101 | 26,610 | 5.2 | 4.1 | 19.5 | 0.1 |
| Lethbridge | 9 | 4,862 | 9,605 | 3.5 | 4.1 | 18.5 | 0.1 |
| Calgary | 52 | 38,663 | 137,030 | 6.0 | 2.8 | 21.4 | 0.1 |
| Red Deer | 15 | 8,247 | 16,750 | 4.9 | 8.2 | 36.5 | 4.6 |
| Edmonton | 84 | 55,997 | 92,735 | 11.5 | 4.2 | 15.7 | 0.1 |
| Kelowna | 19 | 13,415 | 15,235 | 5.1 | 6.9 | 19.1 | 0.2 |
| Kamloops | 10 | 5,685 | 8,400 | 3.0 | 5.5 | 19.0 | 0.1 |
| Chilliwack | 22 | 11,996 | 5,700 | 3.7 | 11.8 | 17.3 | 0.3 |
| Abbotsford | 33 | 24,272 | 14,135 | 6.6 | 13.4 | 22.6 | 1.1 |
| Vancouver | 130 | 113,516 | 163,695 | 6.2 | 4.6 | 14.7 | 0.2 |
| Victoria | 61 | 40,681 | 48,345 | 8.1 | 11.1 | 29.0 | 1.2 |
| Nanaimo | 9 | 5,204 | 5,900 | 2.7 | 5.0 | 14.2 | 0.2 |
| Source: Statistics Canada, Centre for Demography. | |||||||
Conclusion
There is a growing interest for analysis focusing on smaller urban areas, such as downtowns. The COVID-19 pandemic might have even increased the need to measure and understand potential migrations between downtowns and suburbs, or to adjacent areas of the urban centres. Hence the need to develop definitions that can be applied to a large number of agglomerations, as well as the need to determine the geographic limits of these areas. Hopefully, the methodology and the maps presented in this article are a step in the right direction. These boundaries effectively provide a focused geographic area, suitable of intra-urban analysis which is currently not possible using existing areas provided in the Standard Geographical Classification. It is our intent to revise these geographic areas every five years to take into account the most recent information from censuses, but the 2021 revision will be held constant for historical comparison purposes.
This methodology succeeds on many levels. It can be applied to most urban areas in Canada. Also, Canadian censuses are highly regarded data sources that are widely used in several fields of study. In addition, several other variables from censuses such as age, sex, marital status, or income can be easily added in future analysis. Despite the fact that the downtowns end up with similar land size, the number of workers scales well with population from CMAs. There are a few subjective components inherent to the methodology but given that it resulted in the creation of maps that represent the Canadian downtowns very well, at least from an empirical standpoint, there is confidence in the choice made.
Maybe the most interesting aspect of this method is that it helps redefine and delimit every part of urban agglomerations, according to their actual characteristics and uses, without being constrained by administrative boundaries. This is part of a larger movement in spatial analysis, aiming to create geographic entities that reflect the data. Indeed, “while traditional demography has looked at de jure classifications of places (census tracts, etc.), demographers are increasingly realizing that legal and political boundaries frequently have little to do with actual lived spaces” (Matthews & Parker, 2013). Coupled with the fact that an always growing proportion of Canadians are living in urbanized areas, there is a real need to rethink how cities are interpreted.
Appendix
Note to readers
This article presents the boundaries of downtowns based on the dissemination areas (DAs) of Standard Geographical Classification (SGC) 2016. Correspondence files and shapefiles for all primary and secondary downtowns are available on request by contacting Demography Client Services (statcan.demography-demographie.statcan@canada.ca). The boundaries may be revised when the DAs from the SGC 2021 are finalized.
Map A1. Downtown St. John's (PDF) Description
Map A2. Downtown Halifax (PDF) Description
Map A3. Downtown Moncton (PDF) Description
Map A4. Downtown Saint John (PDF) Description
Map A5. Downtown Fredericton (PDF) Description
Map A6. Downtown Saguenay (PDF) Description
Map A7. Downtown Québec (PDF) Description
Map A8. Downtown Sherbrooke (PDF) Description
Map A9. Downtown Trois-Rivières (PDF) Description
Map A10. Downtown Montréal (PDF) Description
Map A11. Downtown Gatineau (PDF) Description
Map A12. Downtown Ottawa (PDF) Description
Map A13. Downtown Kingston (PDF) Description
Map A14. Downtown Belleville (PDF) Description
Map A15. Downtown Peterborough (PDF) Description
Map A16. Downtown Oshawa (PDF) Description
Map A17. Downtown Toronto (PDF) Description
Map A18. Downtown Hamilton (PDF) Description
Map A19. Downtown St. Catharines (PDF) Description
Map A20. Downtown Kitchener (PDF) Description
Map A21. Downtown Brantford (PDF) Description
Map A22. Downtown Guelph (PDF) Description
Map A23. Downtown London (PDF) Description
Map A24. Downtown Windsor (PDF) Description
Map A25. Downtown Barrie (PDF) Description
Map A26. Downtown Sudbury (PDF) Description
Map A27. Downtown Thunder Bay (PDF) Description
Map A28. Downtown Winnipeg (PDF) Description
Map A29. Downtown Regina (PDF) Description
Map A30. Downtown Saskatoon (PDF) Description
Map A31. Downtown Lethbridge (PDF) Description
Map A32. Downtown Calgary (PDF) Description
Map A33. Downtown Red Deer (PDF) Description
Map A34. Downtown Edmonton (PDF) Description
Map A35. Downtown Kelowna (PDF) Description
Map A36. Downtown Kamloops (PDF) Description
Map A37. Downtown Chilliwack (PDF) Description
Map A38. Downtown Abbotsford (PDF) Description
Map A39. Downtown Vancouver (PDF) Description
Map A40. Downtown Victoria (PDF) Description
Map A41. Downtown Nanaimo (PDF) Description
References
Canadian Institute for Health Information. (2006). Improving the Health of Canadians: An Introduction to Health in Urban Places. CIHI Report.
Canadian Urban Institute. (2013). The Value of Investing in Canadian Downtowns. October.
City of Montréal. (2016). Downtown Strategy Building on Momentum. Consultation Document.
City of Toronto. (2018). Downtown East Action Plan.
City of Regina. (2016). Imagine Downtown. Regina Downtown Business Improvement District Strategic Plan.
City of Vancouver. (2020). Zoning Districts and Labels. Open Data Portal.
Feit, M.D. and D. Feehan. (2006). Making Business Districts Work. Routledge. 466 pages.
Filion, P. (2008). “When Planning Fails: Downtown Malls in Mid-Sized Cities”. Canadian Journal of Urban Research. Volume 1, number 27.
Gordon, D.L., Hindrichs, L. and C. Willms. (2018). Still Suburban? Growth in Canadian Suburbs, 2006-2016. Council for Canadian Urbanism. Working Paper no. 2.
Hernandez, T. and L. Jones. (2005). “Downtown in transition: Emerging business improvement area strategies”. International Journal of Retail & Distribution Management. Volume 33, issue 11.
Levy, P.R. and L.M. Gilchrist. (2014). Downtown Rebirth: Documenting the Live-Work Dynamic in 21st Century U.S. Cities. Philadelphia: International Downtown Association.
Marshall, J.D., Brauer, M. and L.D. Frank. (2009). “Healthy Neighborhoods: Walkability and Air Pollution”. Environmental Health Perspectives. Volume 17, number 11. Pages 1752 to 1759.
Matthews, S.A. and D.M. Parker. (2013). “Progress in Spatial Demography”. Demographic Research. Volume 28, article 10. Pages 271 to 312
Savage, K. (2019). “Results from the 2016 Census: Commuting within Canada's largest cities”. Insights on Canadian Society. Statistics Canada catalogue no. 75-006, article no. 8.
Turcotte, M. (2008). “The city/suburb contrast: How can we measure it?” Canadian Social Trends. Statistics Canada catalogue no. 11-008.
United States Census Bureau. (2012). Patterns of Metropolitan and Micropolitan Population Change: 2000 to 2010. 2010 Census Special Reports. Report no. C2010SR-01.
Zuberi, D., Ivemark, B. and M. Ptashnick. (2018). “Lagging behind in suburbia: Suburban versus urban newcomers' employment settlement service outcomes in Metro Vancouver, Canada”. The Social Science Journal. Volume 55, issue 4. Pages 443 to 454.
- Date modified: