
Evolution of housing in Canada, 1957 to 2014

Archived Content
Information identified as archived is provided for reference, research or recordkeeping purposes. It is not subject to the Government of Canada Web Standards and has not been altered or updated since it was archived. Please "contact us" to request a format other than those available.

For most of their history, Canadian cities have grown outward as waves of immigrants and the baby boom generation sought homes in the ever-expanding suburbs. Today, urban growth is not so much moving outward as it is upward, as multi-family dwelling units, especially apartments and apartment-condominiums, have transformed the skylines of Canadian cities.
The emergence of apartments and apartment-condominiums in Canada's largest urban centres not only reflects a lifestyle choice, but also important demographic, economic and societal changes—increasing immigration, declining household size, changing household characteristics, an aging population, high prices of single-family homes in some areas, land shortages and development policies in Canada's major cities.
Type of dwelling has changed over time
Chart 1: Building permits, single-family and multi-family dwelling units, Canada, 1957 to 2014

Description for Chart 1
| Years | Singles, including mobile homes | Multiples |
|---|---|---|
| 1957 | 60,044 | 38,861 |
| 1958 | 86,787 | 58,724 |
| 1959 | 74,368 | 51,392 |
| 1960 | 49,461 | 42,085 |
| 1961 | 64,458 | 46,646 |
| 1962 | 58,625 | 60,194 |
| 1963 | 67,398 | 76,319 |
| 1964 | 67,666 | 94,240 |
| 1965 | 66,011 | 99,152 |
| 1966 | 61,958 | 70,421 |
| 1967 | 65,441 | 95,781 |
| 1968 | 70,136 | 132,083 |
| 1969 | 65,765 | 126,644 |
| 1970 | 60,119 | 116,085 |
| 1971 | 86,763 | 141,305 |
| 1972 | 96,489 | 142,906 |
| 1973 | 112,428 | 154,123 |
| 1974 | 102,064 | 91,989 |
| 1975 | 118,635 | 116,983 |
| 1976 | 123,900 | 133,902 |
| 1977 | 106,768 | 141,942 |
| 1978 | 105,357 | 107,818 |
| 1979 | 102,227 | 81,600 |
| 1980 | 87,527 | 65,848 |
| 1981 | 83,895 | 104,458 |
| 1982 | 56,283 | 58,030 |
| 1983 | 92,195 | 59,797 |
| 1984 | 79,714 | 54,228 |
| 1985 | 97,563 | 66,829 |
| 1986 | 118,929 | 86,797 |
| 1987 | 132,380 | 107,873 |
| 1988 | 129,361 | 96,895 |
| 1989 | 126,842 | 88,290 |
| 1990 | 95,965 | 72,887 |
| 1991 | 88,377 | 72,241 |
| 1992 | 92,507 | 71,266 |
| 1993 | 85,644 | 67,423 |
| 1994 | 88,810 | 63,176 |
| 1995 | 63,744 | 45,552 |
| 1996 | 78,806 | 49,233 |
| 1997 | 94,520 | 54,760 |
| 1998 | 88,713 | 54,166 |
| 1999 | 94,539 | 58,098 |
| 2000 | 92,476 | 56,226 |
| 2001 | 97,792 | 64,385 |
| 2002 | 126,324 | 82,897 |
| 2003 | 121,543 | 94,556 |
| 2004 | 129,389 | 106,227 |
| 2005 | 120,976 | 112,415 |
| 2006 | 118,336 | 109,180 |
| 2007 | 115,891 | 117,056 |
| 2008 | 93,610 | 104,851 |
| 2009 | 80,422 | 78,523 |
| 2010 | 91,908 | 103,469 |
| 2011 | 82,718 | 108,069 |
| 2012 | 83,825 | 119,918 |
| 2013 | 75,163 | 122,908 |
| 2014 | 73,682 | 122,540 |
The suburban home of the 1950s
In the 1950s, single-family homes dominated the housing landscape. From 1957 to 1959, they accounted for 60% of new construction. The introduction of the Canada Mortgage and Housing Corporation's mortgage loan insurance model in 1954 made single-family homes more attainable, which increased demand for new suburban neighbourhoods.
The apartment boom of the 1960s
A major shift occurred from 1962 to 1973, with the majority of building permits (60%) being issued for multi-family dwellings. The shift reflected the large population growth of the post-war economic boom. Increased demand for housing came from the baby boom generation, born in the late 1940s to the mid-1960s, as well as two groups of new immigrants: European immigrants in the 1950s, and the large inflow of immigrants following the introduction of the Economic Point System in 1967. The affordability of multi-family properties likely made them an attractive alternative to single-family dwellings.
Residential construction aligns in the 1970s
Construction of new multi-family units fell at a faster rate than single-family dwellings from 1974 to 1982, particularly during the recession of the mid-1970s. In 1974, the number of new multi-family units declined 40% to 91,989 units, following a peak of 154,123 units in 1973. From 1974 to 1982, single-family and multi-family dwellings accounted for an equal proportion of new dwellings.
The return of the single-family home in the 1980s
The period of 1983 to 2006 saw slower population growth and higher construction intentions for single-family dwellings. Residential construction decreased during the 1981–1982 recession when mortgage lending rates were at their peak. However, while single-family dwellings experienced a quicker recovery following the recession, multi-family unit construction continued to decline. In 1984, there were fewer multi-family units constructed (54,228) than at any other point in the previous 20-year period. Mortgage lending rates began dropping sharply in late 1982, which meant that more people were able to afford single-family homes.
The recession and slow recovery of the 1990s
Residential building construction decreased again during the 1990–1991 recession, although, in contrast to the 1981–1982 recession, construction intentions for both single- and multi-family dwellings were slow to recover. It took 15 years for both types of dwellings to reach levels comparable to their pre-recession peak of the late 1980s.
Apartment-condominium construction intentions rise in the new millennium
Contrary to popular belief, a condominium is a system of ownership and not a type of building. It refers to an individual dwelling unit that is privately owned, but in a building and/or on land that is collectively owned by all dwelling-unit owners. Therefore, each of the main types of residential building—single-family houses, apartments, doubles and row houses—can be condominiums.
Chart 2: Building permits, condominium construction intentions, Canada, 1992 to 2014
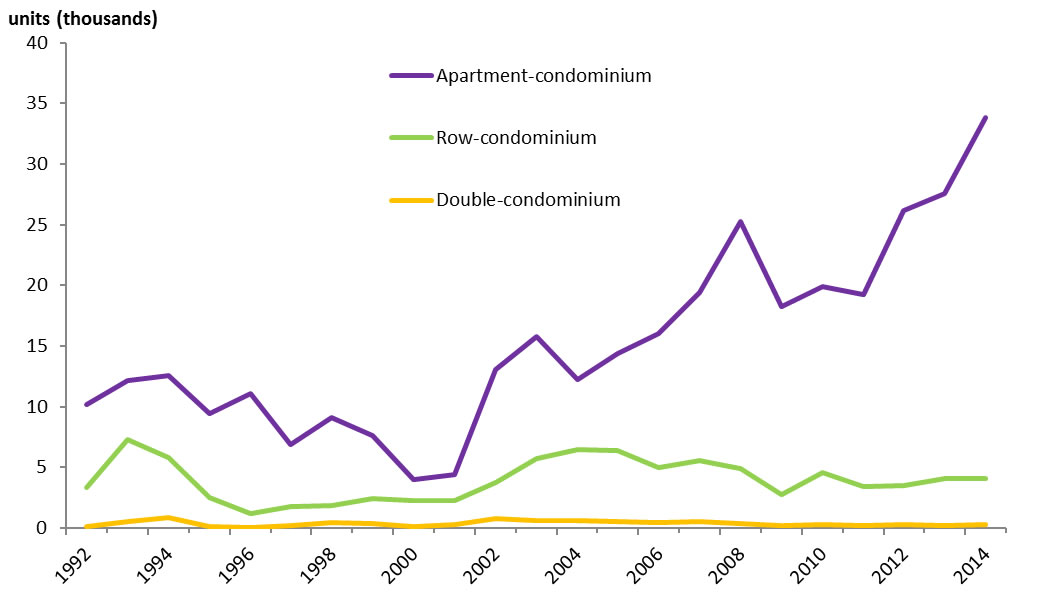
Description for Chart 2
| Years | Apartment-condominium | Double-condominium | Row-condominium |
|---|---|---|---|
| 1992 | 10,142 | 159 | 3,369 |
| 1993 | 12,138 | 556 | 7,302 |
| 1994 | 12,593 | 885 | 5,769 |
| 1995 | 9,430 | 125 | 2,523 |
| 1996 | 11,069 | 62 | 1,181 |
| 1997 | 6,874 | 194 | 1,790 |
| 1998 | 9,063 | 419 | 1,883 |
| 1999 | 7,604 | 327 | 2,465 |
| 2000 | 3,977 | 130 | 2,274 |
| 2001 | 4,391 | 295 | 2,254 |
| 2002 | 1,3074 | 758 | 3,707 |
| 2003 | 15,756 | 625 | 5,755 |
| 2004 | 12,270 | 595 | 6,468 |
| 2005 | 14,377 | 556 | 6,371 |
| 2006 | 16,055 | 425 | 4,998 |
| 2007 | 19,442 | 507 | 5,584 |
| 2008 | 25,254 | 345 | 4,861 |
| 2009 | 18,257 | 229 | 2,742 |
| 2010 | 19,914 | 265 | 4,556 |
| 2011 | 19,260 | 185 | 3,434 |
| 2012 | 26,194 | 265 | 3,521 |
| 2013 | 27,539 | 171 | 4,041 |
| 2014 | 33,801 | 294 | 4,113 |
At the national level, apartment-condominiums have increasingly become the dominant type of condominium construction since the early 2000s. They accounted for 88% of condominium construction intentions in 2014, compared to 62% in 2000.
Apartment-condominiums provide concentrated housing in Canada's census metropolitan areas (CMAs), where there may be limited land available for new residential construction. Also, since immigration is now the major source of population growth in Canada, and most immigrants settle in large CMAs, apartment-condominiums may fulfill the newcomer demand for housing.
The relative affordability of apartment-condominiums compared with row, double and, especially, single-family dwellings makes them accessible for first-time buyers, as well as a downsizing option for older households, since they require less upkeep. Condominium owners, compared with other homeowners, are more likely to be younger or older, have a lower household income, and to be classified as non-family or couple-only households.
More multi-family dwellings since the 2008–2009 recession
Since the 2008–2009 recession, construction rates for multi-family dwellings have recovered at a faster pace than single-family dwellings—increasing in four of the five years following the recession. The number of planned multi-family dwellings (103,469) surpassed single-family dwellings (91,908) in 2010, and peaked in 2013 with the highest number of units (122,908) since 1977. On the other hand, single-family dwelling construction fell to 73,682 units in 2014, its lowest point in almost 20 years.
Apartments account for the largest share of construction intentions for three consecutive years
Since 2012, apartments (including apartment-condominiums) have had the highest construction intentions in Canada, which has not occurred since 1973. Over the past 40 years, apartments and single-family homes have accounted for the vast majority (85% on average) of new construction, whereas rows and doubles accounted for about 15% of new construction.
Chart 3: Building permits, type of dwelling, Canada, 1972 to 2014

Description for Chart 3
| Years | Singles, including mobile homes | Double | Row | Apartments |
|---|---|---|---|---|
| 1972 | 96,489 | 15,919 | 16,623 | 110,364 |
| 1973 | 112,428 | 14,185 | 16,077 | 123,861 |
| 1974 | 102,064 | 11,731 | 13,944 | 66,314 |
| 1975 | 118,635 | 16,725 | 19,460 | 80,798 |
| 1976 | 123,900 | 16,386 | 27,726 | 89,790 |
| 1977 | 106,768 | 19,782 | 24,307 | 97,853 |
| 1978 | 105,357 | 18,469 | 17,263 | 72,086 |
| 1979 | 102,227 | 15,828 | 11,521 | 54,251 |
| 1980 | 87,527 | 10,360 | 9,227 | 46,261 |
| 1981 | 83,895 | 11,698 | 17,575 | 75,185 |
| 1982 | 56,283 | 6,072 | 10,854 | 41,104 |
| 1983 | 92,195 | 6,489 | 9,936 | 43,372 |
| 1984 | 79,714 | 5,455 | 7,816 | 40,957 |
| 1985 | 97,563 | 6,353 | 10,169 | 50,307 |
| 1986 | 118,929 | 8,065 | 9,915 | 68,817 |
| 1987 | 132,380 | 9,319 | 16,090 | 82,464 |
| 1988 | 129,361 | 7,784 | 15,709 | 73,402 |
| 1989 | 126,842 | 7,659 | 14,991 | 65,640 |
| 1990 | 95,965 | 6,938 | 14,790 | 51,159 |
| 1991 | 88,377 | 8,578 | 16,060 | 47,603 |
| 1992 | 92,507 | 9,370 | 17,140 | 44,756 |
| 1993 | 85,644 | 9,572 | 18,434 | 39,417 |
| 1994 | 88,810 | 11,122 | 16,752 | 35,302 |
| 1995 | 63,744 | 6,709 | 12,154 | 26,689 |
| 1996 | 78,806 | 8,874 | 14,073 | 26,286 |
| 1997 | 94,520 | 9,907 | 17,409 | 27,444 |
| 1998 | 88,713 | 9,005 | 14,530 | 30,631 |
| 1999 | 94,539 | 9,867 | 14,959 | 33,272 |
| 2000 | 92,476 | 10,067 | 16,207 | 29,952 |
| 2001 | 97,792 | 10,713 | 14,491 | 39,181 |
| 2002 | 126,324 | 11,411 | 19,568 | 51,918 |
| 2003 | 121,543 | 12,631 | 20,580 | 61,345 |
| 2004 | 129,389 | 11,834 | 22,997 | 71,396 |
| 2005 | 120,976 | 11,526 | 23,197 | 77,692 |
| 2006 | 118,336 | 11,002 | 21,665 | 76,513 |
| 2007 | 115,891 | 11,390 | 23,263 | 82,403 |
| 2008 | 93,610 | 9,612 | 19,903 | 75,336 |
| 2009 | 80,422 | 9,079 | 14,156 | 55,288 |
| 2010 | 91,908 | 10,634 | 20,222 | 72,613 |
| 2011 | 82,718 | 9,952 | 18,263 | 79,854 |
| 2012 | 83,825 | 11,710 | 21,011 | 87,197 |
| 2013 | 75,163 | 9,827 | 20,538 | 92,543 |
| 2014 | 73,682 | 11,325 | 22,586 | 88,629 |
Apartments have the highest construction intentions in the three largest census metropolitan areas
In 2014, there were higher construction intentions for apartments (including apartment-condominiums) than for any other dwelling type in Canada's three largest CMAs. In Toronto, they accounted for 54% of residential construction, compared with 27% for single-family homes. In Montréal, apartment units accounted for 75% of residential construction, compared with 16% for single-family homes. Meanwhile, in Vancouver, it was 67% for apartment units and 16% for single-family homes. These three CMAs accounted for just over half of the total CMA population in 2014. In all three CMAs, new single-family dwellings have been declining since the early 2000s, falling from 27,627 dwellings in 2000 to 14,840 in 2014—a 46% decrease.
The affordability and availability of apartments relative to other building types, particularly single-family dwellings, could explain the recent increase in apartments in these CMAs, particularly in Canada's two most expensive housing markets: Vancouver and Toronto.
Note to readers
Data source
Statistics Canada's monthly Building Permits Survey is a leading indicator of residential construction in Canada. The survey collects administrative data on construction intentions from all municipalities that issue building permits, which currently accounts for approximately 95% of the Canadian population. The data can be used by analysts to understand the number and value of new residential units for both single- and multi-family dwellings, the latter comprised of double or semi-detached, row, and apartment dwellings. Data on condominium construction is also collected, and has been disseminated by type of dwelling (row-condominium, double-condominium, single-condominium, and apartment-condominium) since 1992.
All graphs in this publication use annual data, and, therefore, are comparable without being seasonally adjusted.
Definitions
Building permit: refers to the final authorization to start work on a building project. It is granted by public authorities in response to an application by a principal and based on a specific building plan.
Residential construction: Refers to all buildings intended for private occupancy, whether on a permanent basis or not. Dwellings are divided into the following types: single-family, mobile, cottage, semi-detached or double, row house and apartment.
References
Brown, W. M. and A. Lafrance. 2013. Trends in homeownership by Age and Household Income: Factors associated with the decision to own, 1981 to 2006. Economic Analysis Research Paper Series. Statistics Canada. Catalogue 11F0027M No. 083.
Cross, P. 2010. Slowdowns during periods of economic growth. Canadian Economic Observer. Statistics Canada. Catalogue no. 11-010-X.
LeVasseur, S. and J. Situ. 2013. Condominium dwellings in Canada. National Household Survey in Brief Series. Statistics Canada. Catalogue no. 99-014-X2011003.
Martel, L. 2014. Population growth: Migratory increase overtakes natural increase. Canadian Megatrends. Statistics Canada. Catalogue no. 11-630-X.
Statistics Canada. 2014. Table 051-0056—Estimates of population by census metropolitan area, sex and age group for July 1, based on the Standard Geographical Classification (SGC) 2011, annual (persons).
Contact information
To enquire about the concepts, methods or data quality of this release, contact Taryn Read-Hobman (613-291-8501), Investment, Science and Technology Division.
- Date modified: