Infographic 3
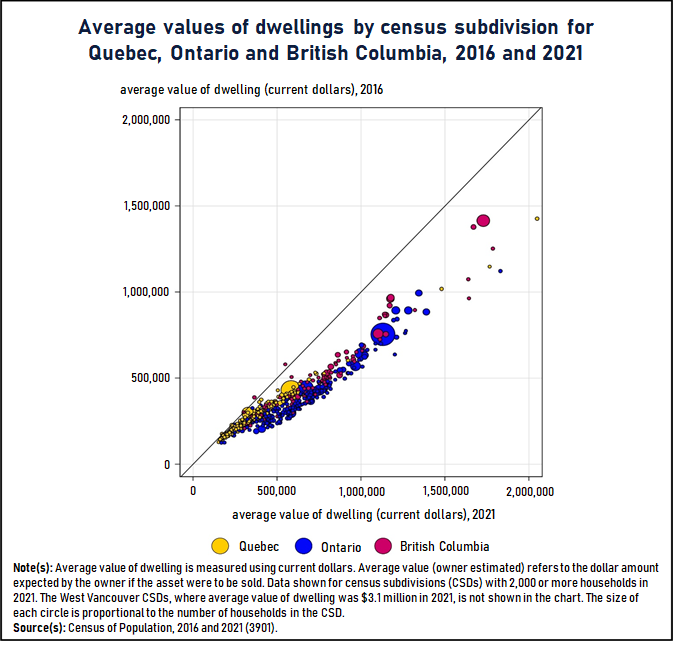
Owner's expected growth in the value of their dwelling is strongest in census subdivisions in Ontario, followed by British Columbia and Quebec

Infographic description
The title of the infographic is "Owner's expected growth in the value of their dwelling is strongest in census subdivisions in Ontario, followed by British Columbia and Quebec"
This is a bubble chart showing a comparison of the average values of dwellings in current dollars from 2016 to 2021 for census subdivisions in Quebec, Ontario and British Columbia with 2,000 or more households in 2021.
The horizontal axis shows the average value of dwelling (current dollars) in 2021, from $0 to $2,000,000 in intervals of $500,000.
The vertical axis shows the average value of dwelling (current dollars) in 2016, from $0 to $2,000,000 in intervals of $500,000.
The chart includes a diagonal 45-degree line that shows where the average value of dwelling in 2016 equals the average value of dwelling in 2021.
Each census subdivision is shown as a circle, the size of which represents the number of households in the census subdivision.
The circles are colour-coded to each province; circles are coloured yellow for census subdivisions in Quebec, blue for census subdivisions in Ontario and red for census subdivisions in British Columbia.
Almost all census subdivisions, from all three provinces in the chart, show an increase in the average value of dwelling from 2016 to 2021. Census subdivisions with a larger average value of dwelling show a larger increase since 2016 than census subdivisions with a smaller average value.
In Quebec, 80% of census subdivisions had an average value of dwelling between $180,000 and $500,000 in 2021. The lowest average value of dwelling in Quebec was approximately $150,000 in 2021, and the highest average value of dwelling was approximately $2,000,000. In 80% of census subdivisions, the average value of dwelling grew between 10% and 40% from 2016 to 2021. The smallest change in the average value of dwelling was a 1.5% decrease, and the largest change in the average value of dwelling was a 53.9% increase.
In Ontario, 80% of census subdivisions had an average value of dwelling between $340,000 and $960,000 in 2021. The lowest average value of dwelling in Ontario was approximately $170,000 in 2021, and the highest average value of dwelling was approximately $1,800,000. In 80% of census subdivisions, the average value of dwelling grew between 30% and 90% from 2016 to 2021. The smallest change in the average value of dwelling was an 8.5% increase, and the largest change in the average value of dwelling was a 115% increase.
In British Columbia, 80% of census subdivisions had an average value of dwelling between $400,000 and $1,100,000 in 2021. The lowest average value of dwelling in British Columbia was approximately $300,000 in 2021, and the highest average value of dwelling was approximately $1,800,000. In 80% of census subdivisions, the average value of dwelling grew between 25% and 70% from 2016 to 2021. The smallest change in the average value of dwelling was a 0.1% increase, and the largest change in the average value of dwelling was a 98.7% increase. Notably, the average values of dwelling in the census subdivisions of Fort St. John and Peace River decreased by 5.8% and 5.3%, respectively.
Note(s): Average value of dwelling is measured using current dollars. Average value (owner estimated) refers to the dollar amount expected by the owner if the asset were to be sold. Data shown for census subdivisions (CSDs) with 2,000 or more households in 2021. The West Vancouver CSDs, where average value of dwelling was $3.1 million in 2021, is not shown in the chart. The size of each circle is proportional to the number of households in the CSD.
Source(s): Census of Population, 2016 and 2021 (3901).
- Date modified: