Canadian Housing Statistics Program, 2020
Archived Content
Information identified as archived is provided for reference, research or recordkeeping purposes. It is not subject to the Government of Canada Web Standards and has not been altered or updated since it was archived. Please "contact us" to request a format other than those available.
Released: 2021-09-17
New data from the Canadian Housing Statistics Program (CHSP) on residential properties in Nova Scotia, New Brunswick, Ontario and British Columbia are now available for 2020. The data show that, prior to the pandemic, the share of properties occupied by their owners edged down in major urban centres in Ontario. The data also illustrate a trend toward more condominium apartments in Ontario and British Columbia, as well as a stable share of properties owned by non-residents in New Brunswick and Ontario.
This publication also marks the introduction of new quality indicators for estimates on the 2020 reference year. For the first time, data users will have a clear indication of the overall quality of housing indicators derived from administrative data.
The share of owner-occupied properties edges down in Ontario
The CHSP indicator on property use identifies whether a property is occupied by at least one of its owners. Properties not occupied by their owners are likely to be either vacant, rented out or used as a second property.
The share of owner-occupied properties in urban areas of Ontario edged down from 80.7% in 2019 to 80.0% in 2020. Across these urban areas, the increase in the number of owner-occupied properties (+17,635) was about half that of non-owner-occupied properties (+34,915).
This declining share of owner-occupied properties occurred in all census metropolitan areas (CMAs) in Ontario. In the Toronto CMA, the number of properties that were not occupied by at least one owner rose by 5.9%, while the number of owner-occupied properties edged up 0.7%.
Condominium apartments were the least likely to be occupied by their owners in every province examined by the study in 2020. This was especially true in Ontario, where 55.9% of condominium apartments were owner-occupied, compared with 87.9% of single-detached houses.
The share of homes owned by non-residents is stable in Ontario and New Brunswick and down in British Columbia and Nova Scotia
The share of residential properties owned by non-residents was unchanged in Ontario (2.2%) and New Brunswick (2.9%) in 2020 compared with 2019, and declined in British Columbia (from 3.2% to 3.1%) and Nova Scotia (from 4.0% to 3.6%).
Among the largest CMAs in these four provinces, the non-resident ownership rate remained highest in Vancouver, at 4.2% in 2020. Among all municipalities (census subdivisions, or CSDs) within Vancouver, Greater Vancouver A—which includes the University Endowment Lands—had the highest non-resident ownership rate from 2018 to 2020, at 14.9% in 2020.
In the Toronto CMA, this rate rose from 2.6% in 2019 to 2.7% in 2020. The CSD of the city of Toronto continued to have the highest non-resident ownership rate at 3.8%.
Housing stock is growing at a slightly faster pace in downtown cores
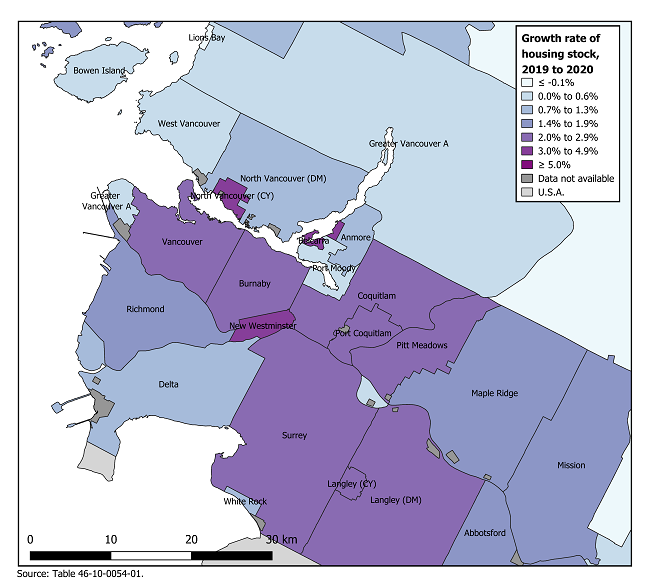
The downtown housing stock in some of Canada's largest metropolitan areas grew at a faster pace from 2019 to 2020 compared with previous reference years. In the Vancouver CMA, the housing stock rose at a faster pace than total population, suggesting that housing supply kept pace with increasing demand over the two-year period. The number of properties in the CMA of Vancouver increased by 2.0%, matching the growth rate in the core CSD of the city of Vancouver, but below that of North Vancouver city (+3.0%) and New Westminster (+3.0%), which reported the fastest growth rates.
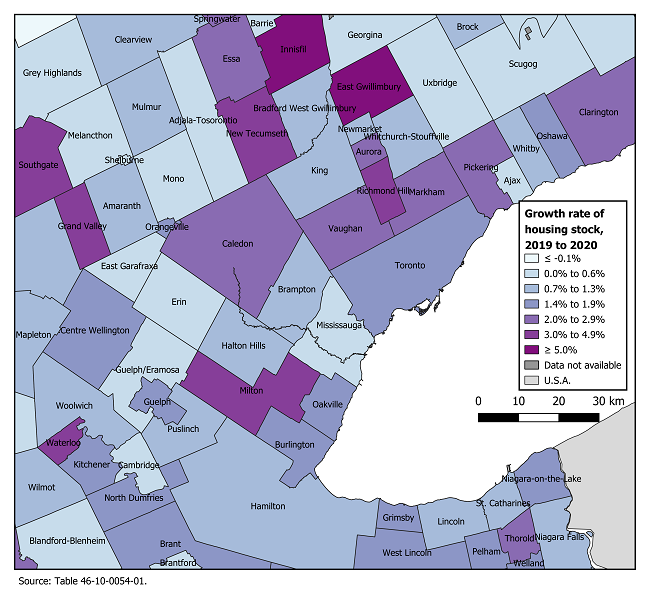
In the Toronto CMA, the housing stock grew by 1.6%, with the highest growth rate in the CSD of East Gwillimbury (+9.3%). In the city of Toronto CSD, the rate rose from 1.2% in 2018-2019 to 1.6% in 2019-2020.
New properties in Ontario and British Columbia are more likely to be condominium apartments
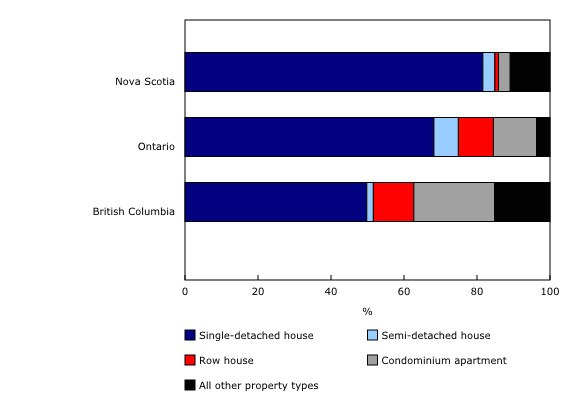
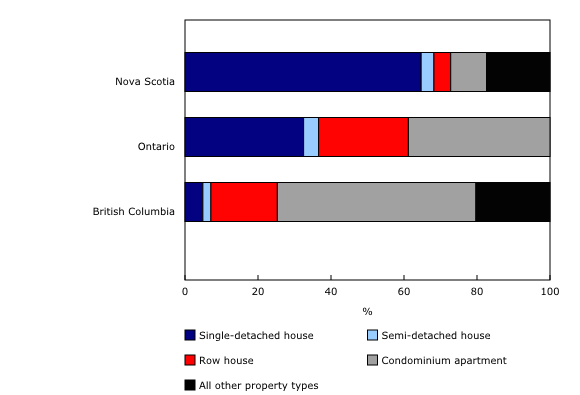
Single-detached houses are the most common property type in all four provinces studied. However, this share is gradually declining, especially in British Columbia and Ontario. From 2019 to 2020, condominium apartments were the largest contributor to housing stock growth in British Columbia (54.4% of net new properties) and Ontario (38.8%). This also held true in the CMAs of Toronto (59.0%) and Vancouver (75.0%). By contrast, most new properties in Nova Scotia (64.7%) were single-detached houses.
These net additions of semi-detached houses, row houses and condominium apartments reflect the numbers reported for comparable property types by the Building Permits Survey for 2018 and the Canada Mortgage and Housing Corporation for 2019.
Fewer vacant lots in Toronto
Vacant land intended for residential use is an important input into housing supply. From 2018 to 2020, new vacant land in the Toronto CMA did not keep pace with construction. As a result, the total number of vacant land properties in Toronto fell by 3,245. In contrast, there were 790 more vacant lots in Vancouver in 2020 than in 2018. In Halifax, the stock of vacant land declined by 475, but still accounted for 12.2% of all the residential properties in 2020, compared with 2.0% in Toronto and 1.5% in Vancouver.
Note to readers
Beginning with this release, the Canadian Housing Statistics Program (CHSP) is introducing quality indicators for all estimates for the reference year 2020. Each released data point is assigned a letter, reflecting the overall quality of the estimate and ranging from A (excellent) to F (too unreliable to be published).
Property use is not available outside census metropolitan areas (CMAs) and census agglomerations (CAs). In this release, reported figures exclude properties outside these areas, as well as vacant land. For the most recent period of construction, the property use indicator is less precise. As a consequence, these estimates should be used with caution.
For the 2020 reference year, a revision to the classification of property types in New Brunswick took place. Consequently, users are advised to limit comparisons of property types between 2019 and 2020.
Data on the living area of properties in British Columbia are now available for the reference year 2020. Data on the living area of condominium apartments in Nova Scotia are currently unavailable. In Ontario, assessment values for properties built since the last assessment year (2016) are not available. The reference years of the assessment values by province or territory are also available.
Geographical boundaries
The CHSP disseminates data based on the geographical boundaries from the Standard Geographical Classification 2016.
Definitions
The core of a geographic area, for the purposes of this release, refers to the census subdivision (CSD) within a census metropolitan area (CMA) with the highest number of residential properties.
Housing stock refers to all residential properties in a given geographic region, excluding vacant land.
The largest CMA refers to the most populated CMA in each province, based on the 2016 Census population.
In Charts 2 and 3, the category "all other property types" includes mobile homes, properties with multiple residential units and other property types.
Property use refers to the use of a residential property by its owners. The property can be occupied by the owner, at least one of the owners or none of the owners on the property title.
Property owner refers to an individual or non-individual (such as a corporation, trust, state-owned entity or related groups) that has property title transferred to, recorded in, registered in or otherwise carried in their name. A property may have more than one owner or an owner may have more than one property, thus the count of owners and properties can differ.
Urban areas, for the purpose of this release, refers to census metropolitan areas (CMAs) and census agglomerations (CAs).
Vacant land includes vacant land properties intended for residential use. Additions to vacant land can come from demolitions of other residential properties or rezoning.
Contact information
For more information, contact us (toll-free 1-800-263-1136; 514-283-8300; STATCAN.infostats-infostats.STATCAN@canada.ca).
To enquire about the concepts, methods or data quality of this release, contact Jean-Philippe Deschamps-Laporte (343-998-7200; jean-philippe.deschamps-laporte@canada.ca).
- Date modified:


