Labour Force Survey, June 2020
Archived Content
Information identified as archived is provided for reference, research or recordkeeping purposes. It is not subject to the Government of Canada Web Standards and has not been altered or updated since it was archived. Please "contact us" to request a format other than those available.
Released: 2020-07-10
Context: COVID-19 restrictions gradually ease
Labour Force Survey (LFS) results for June reflect labour market conditions as of the week of June 14 to June 20. By then, public health restrictions had been substantially eased in most parts of the country. Tighter restrictions remained in place in much of southwestern Ontario, including Toronto. As businesses and workplaces continued to re-open across the country, physical distancing and other requirements remained in place. Likewise, large gatherings continued to be limited.
This gradual easing of restrictions and the re-opening of the economy continued to present both opportunities and challenges for employers and workers. Employers continued to adapt workplaces to ensure the health and safety of workers, customers and the public. Some workers returned to a previous employer while others looked for new work. For many Canadians, adapting to new ways of working included making new child care arrangements.
Ongoing survey enhancements to measure the labour market in exceptional times
A series of survey enhancements continued in June, including additional questions on working from home, difficulty meeting financial needs, and receipt of federal COVID-19 assistance payments. New questions were added to measure the extent to which COVID-19-related health risks are being mitigated through workplace adaptations and protective measures.
This release continues the practice of recent months of integrating the internationally standardized concepts of employment and unemployment with supplementary indicators that help capture the full scope of the labour market disruption.
Data from the LFS are based on a sample of more than 50,000 households every month. In June, Statistics Canada continued to protect the health and safety of Canadians by adjusting the processes involved in conducting these interviews. We are deeply grateful to the many Canadians who responded to the survey. Their ongoing cooperation ensures that we continue to paint an accurate and current portrait of the Canadian labour market and Canada's economic performance.
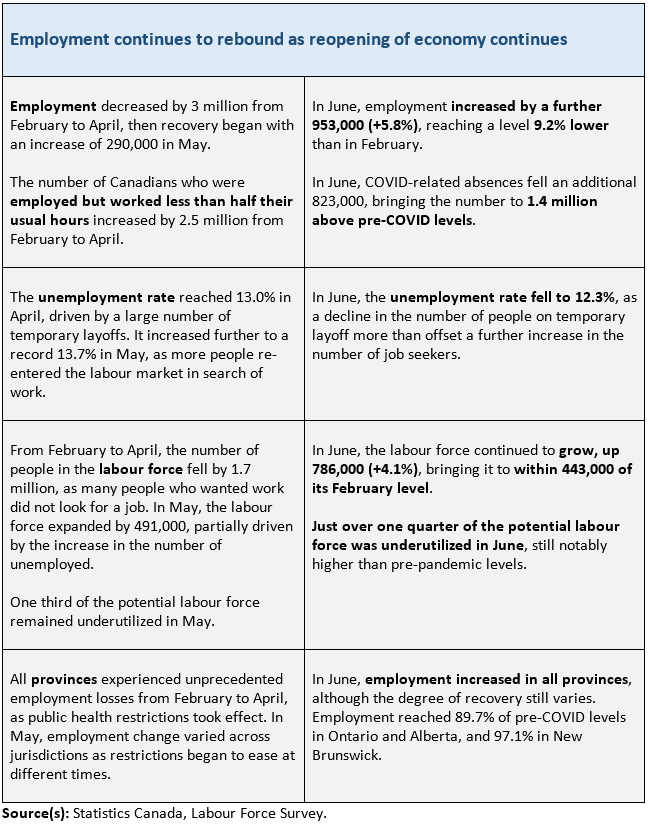
Employment continues to rebound as reopening of economy continues
From February to April, 5.5 million Canadian workers were affected by the COVID-19 economic shutdown. This included a drop in employment of 3.0 million and a COVID-related increase in absences from work of 2.5 million.
By the week of June 14 to June 20, the number of workers affected by the COVID-19 economic shutdown was 3.1 million, a reduction since April of 43%.
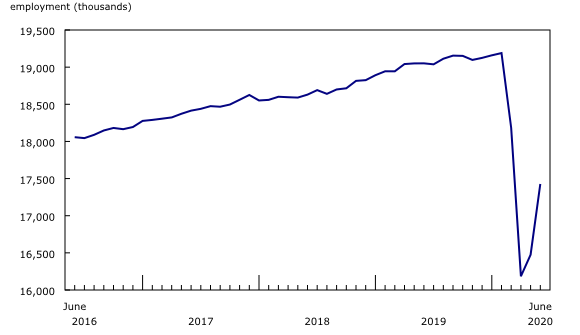
Building on an initial recovery of 290,000 in May, employment rose by nearly one million in June (+953,000; +5.8%), with gains split between full-time work (+488,000 or +3.5%) and part-time work (+465,000 or +17.9%). With these two consecutive increases, employment in June was 1.8 million (-9.2%) lower than in February.
The number of Canadians who were employed but worked less than half their usual hours for reasons likely related to COVID-19 dropped by 823,000 in June. Combined with declines recorded in May, this left absences from work 1.4 million above pre-COVID levels.
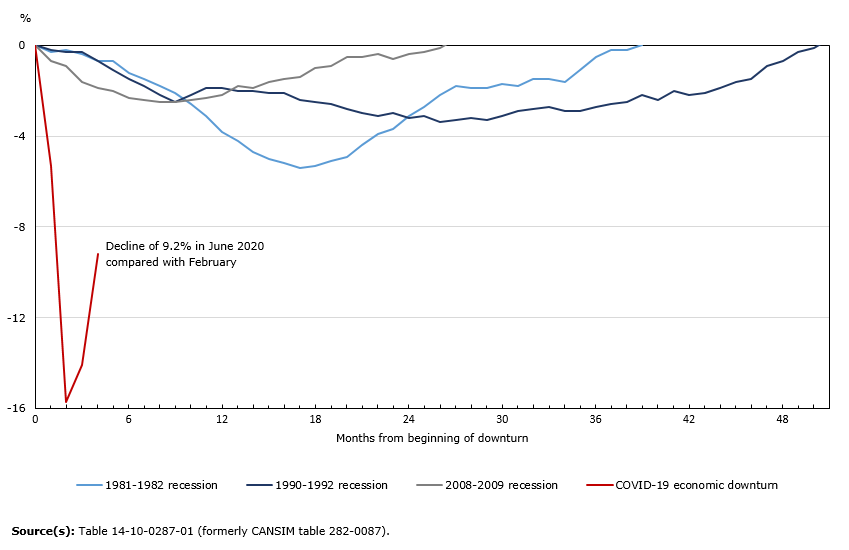
Initial recovery in employment sharper than in previous economic downturns
The employment losses resulting from the COVID-19 economic shutdown were unprecedented in their speed and depth. In just two months, employment fell to 15.7% below pre-COVID February levels. By comparison, the 1981/1982 recession resulted in a total employment decline of 5.4% (-612,000) over approximately 17 months.
With the easing of COVID-19 restrictions in May and June, the initial recovery of employment—to within 9.2% of pre-COVID levels—has been sharper than in previous downturns, when recovery to pre-downturn employment has taken from two to five years.
In all age groups, men are closer to pre-shutdown employment levels than women
In June, employment rose slightly faster among women (+6.1% or +467,000) than men (+5.5% or +487,000). On a cumulative basis however, after including May gains, employment among men had recovered to 92.3% of its February level, compared with 89.2% among women. In each of the three major age groups—youth aged 15-24, core-aged workers aged 25-54 and those aged 55 and older—recovery of COVID-19-related employment losses was more advanced among men than among women.
Unemployment rate drops in June after reaching record high in May
The unemployment rate was 12.3% in June, a drop of 1.4 percentage points from a record-high of 13.7% in May. While this was the largest monthly decline on record, the unemployment rate remains much higher than February, when it was 5.6%.
While the unemployment rate for all major demographics groups fell in June, it remained slightly higher for women (12.7%) than for men (12.1%).
Temporary layoffs decline while employment increases
Approximately 2.5 million Canadians were unemployed in June, a decrease of 167,000 (-6.4%) from May but more than double the February level (1.1 million).
The unemployed include three main categories: those on temporary layoff, who expect to return to a previous job within six months; those who do not expect to return to a previous job and are looking for work; and those who have arrangements to begin a new job within four weeks.
Typically, relatively few of the unemployed are on temporary layoff and the vast majority are job searchers. The labour market shock stemming from the COVID-19 shutdown resulted in a sudden disruption of this pattern. In April, half (49.6%) of the unemployed were on temporary layoff.
As COVID restrictions are eased and economic activity resumes, it is expected that the number of people on temporary layoff will decrease as people return to their previous job or, either by necessity or choice, transition to looking for new work. After holding steady in May, the number of people on temporary layoff fell by 29.1% (-347,000) in June, driven by a decline among core-aged workers aged 25-54. Following this decline, one-third of the unemployed (34.4% or 844,000) were on temporary layoff, while two-thirds (65.6% or 1.6 million) were searching for work in June.
The number of job seekers grows while more Canadians engage in the labour market
The COVID-19 economic shutdown led to a sharp increase in the number of people who wanted a job but did not meet the definition of unemployed because they did not look for work, presumably because they had little confidence in finding a new job.
In May, as the initial easing of COVID-19 restrictions began, the number of people who wanted a job but did not look for one began to fall, accompanied by an increase in the number of people actively looking for work. In June, these trends continued, with an increase in job-seekers (+180,000; +12.6%), observed mostly among youth, and a drop in those who wanted a job but did not look for one (-448,000; -32.1%).
If those who wanted to work but did not look for a job were included as unemployed in June, it would result in an adjusted unemployment rate of 16.3%, a decline of 3.3 percentage points compared with the adjusted rate in May
Increase in labour force participation, with notable differences between men and women
From February to April, the number of people who were active in the labour market—who were either employed or unemployed—declined by 1.7 million. This was driven by increases in both the number of people who wanted a job but did not look for one and the number of people who did not want a job, including those who had taken on other responsibilities as a result of the COVID-19 economic shutdown.
In June, as COVID-19-related restrictions eased, the number of people participating in the labour force rose by 786,000 (+4.1%). This followed an increase of 491,000 (+2.6%) in May and brought the total labour force to within 443,000 of its pre-COVID February level. The labour force participation rate—that is, the labour force as a percentage of the population aged 15 and older—rose by 2.4 percentage points to 63.8% in June, compared with 65.5% in February.
The growth in labour force participation towards pre-COVID levels was not equal for men and women. The participation rate for core-aged men was up 2.7 percentage points to 90.3% in June, 0.8 percentage points below the February level. For core-aged women, the participation rate rose 2.5 percentage points to 82.0%, 1.4 percentage points short of the February level.
Labour underutilization less of a factor in June
Labour underutilization occurs when people who could potentially work are not, or when people could work more hours than they are currently. The "labour underutilization rate" combines those who were unemployed; those who were not in the labour force but who wanted a job and did not look for one; and those who were employed but worked less than half of their usual hours. As the economy continued to recover in June, labour underutilization eased.
In June, a little more than one-quarter (26.9%) of the potential labour force was fully or partially underutilized, down notably from more than one-third in May (34.3%), but remained substantially higher than pre-pandemic levels.
The rate in June declined the most for youth (down 11.3 percentage points to 40.5%), followed by core-aged people (down 7.2 percentage points to 23.6%) and people aged 55 and older (down 6.4 percentage points to 27.6%).
While the labour underutilization rate was similar for men and women prior to the COVID-19 pandemic, the rate has been higher for women since February. In June, the rate was 28.3% for women and 25.5% for men.
Employment increases in all provinces
By the LFS reference week of June 14 to June 20, all provinces had substantially eased COVID-19 restrictions. For most provinces, this was the continuation of a process that had started in early May. For others, including Ontario, the easing of restrictions began after the May LFS reference week.
This continued easing of restrictions was reflected in provincial labour markets. In June, all provinces recorded an increase in employment and a decrease in COVID-related absences.
In Ontario, where the easing of COVID-19 restrictions began in late May and expanded on June 12, employment rose by 378,000 (+5.9%) in June, the first increase since the COVID-19 economic shutdown. The proportion of employed people who worked less than half of their usual hours declined by 6.5 percentage points to 14.1% in Ontario. The unemployment rate declined 1.4 percentage points to 12.2% as the number of people on temporary layoff declined.
In the census metropolitan area of Toronto, where the easing of some COVID-19 restrictions was delayed until June 24, the recovery rate was slightly below that of Ontario in June. The employment level in Toronto was 89.6% of the February level, compared with 94.5% for the rest of the province (not adjusted for seasonality).
Quebec recorded employment gains of 248,000 (+6.5%) in June, adding to similar gains (+231,000) in May and bringing employment to 92.2% of its February level. At the same time, the number of unemployed people in the province declined for the second consecutive month in June (-119,000), pushing the unemployment rate down 3.0 percentage points to 10.7%. The decline in unemployment in Quebec was entirely driven by fewer people on temporary layoff.
The number of people employed in British Columbia rose by 118,000 (+5.4%) in June, following an increase of 43,000 in May. The proportion of employed people who worked less than half of their usual hours declined by 2.9 percentage points to 14.6%. The number of unemployed in the province was little changed in June and the unemployment rate edged down 0.4 percentage points to 13.0%.
In the Western provinces, employment increased in Saskatchewan (+30,000) for the first time since the COVID-19 economic shutdown and rose for the second consecutive month in both Alberta (+92,000) and Manitoba (+29,000).
In New Brunswick, the first province to begin easing COVID-19 restrictions, employment increased by 22,000 in June. Combined with May gains, this brought employment in the province to 97.1% of its pre-COVID February level, the most complete employment recovery of all provinces to date.
Employment increased for the second consecutive month in Nova Scotia (+29,000), Newfoundland and Labrador (+6,000) and Prince Edward Island (+1,700).
In the second quarter of 2020, the number of people employed in Yukon declined by an estimated 1,200 people, compared with the first quarter of the year. Over the same period, employment as a percentage of the population aged 15 and older fell by 4.4 percentage points to 65.6%. The unemployment rate increased from 3.2% in the first quarter to 6.2% in the second quarter of 2020.
Compared with the first quarter of the year, employment In the Northwest Territories fell by an estimated 1,300 people in the quarter ending in June. The unemployment rate was little changed at 9.6%, as fewer people participated in the labour market.
In the second quarter of 2020, employment in Nunavut declined by 2,100 people compared with the first quarter. Over the same period, labour force participation also fell, and the unemployment rate was little changed at 15.3%, as fewer people participated in the labour market.
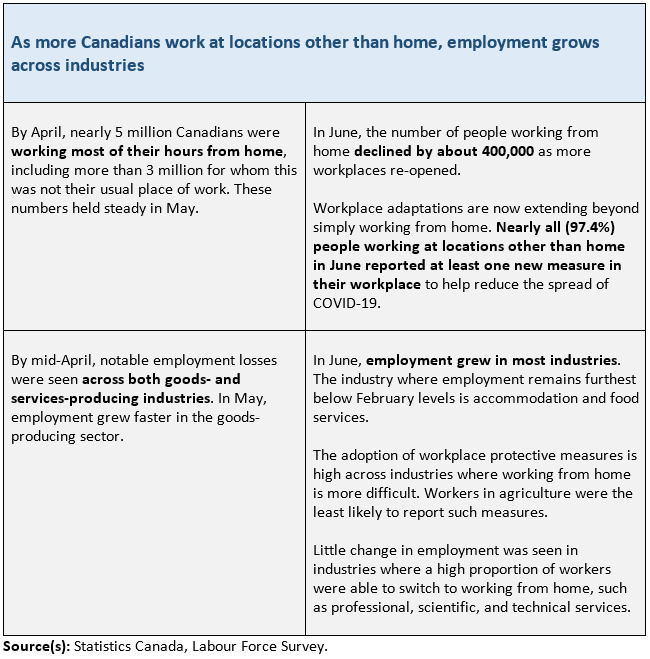
As more Canadians work at locations other than home, employment grows across industries
Workplace adaptations expand beyond working from home
Across industries, the proportion of jobs requiring close physical proximity to others varies widely. In some sectors of the economy—such as public administration and finance, insurance, real estate and rental and leasing—relatively few jobs require close proximity with co-workers, clients or the public. In some industries—such as retail trade, accommodation and food services—a large proportion of jobs require such contact, with the associated risk of COVID-19 transmission.
By the week of April 12 to April 18, a total of 3.3 million Canadians had responded to public health restrictions by shifting from their usual workplaces to working from home.
In industries where a relatively low proportion of jobs require physical proximity to others and can be performed remotely, working from home was a crucial early adaptation to the COVID-19 economic shutdown and was instrumental in mitigating further employment losses.
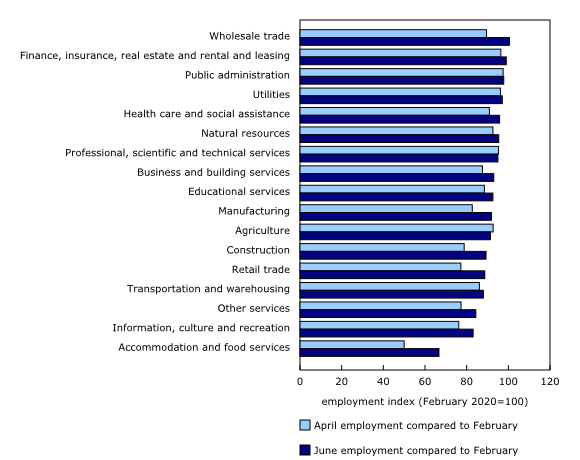
For industries where a high proportion of jobs require physical proximity to others, adapting by working from home was less widespread and job losses were heavy. By April, for example, employment in accommodation and food services had fallen to 50% below its pre-COVID February level.
As the easing of COVID-19 restrictions continues, restoring the confidence of workers and consumers by mitigating COVID-19 health risks will be a crucial factor in the recovery of the labour market. Recent data from the Canadian Perspective Survey Series, for example, indicate that close to 4 in 10 Canadians who had shifted to working from home or were absent from work during the week of June 9 did not feel safe in returning to their usual workplace.
New data from the Labour Force Survey shed light on the extent to which employers have begun to address these concerns through workplace adaptations and other protective measures. Among those who worked at a location other than home during the week of June 14 to June 20, about 8 in 10 reported that their workplace had introduced enhanced cleaning protocols (80.8%) or had reorganized the workplace or work practices (79.6%). More than 8 in 10 (83.4%) reported that they had access to personal protective equipment, while a similar proportion (87.9%) indicated that they had increased access to hand sanitizing or hand washing facilities.
More Canadians working at locations other than home
The easing of restrictions, the introduction of protective measures and new workplace adaptations are reflected in the number of Canadians working at locations other than home. Among those who were employed and worked at least half of their usual hours, working at locations other than home increased by 2 million in June, while the number of Canadians working from home fell by 400,000.
In June, as in previous months, there were notable differences in the profile of those working from home and those working at other locations. A majority of those working at locations other than home and who worked at least half of their usual hours were men (58.9%). In contrast, those who worked from home were about equally likely to be men or women. Less than one-quarter (23.3%) of those working at a location other than home had a bachelor's degree or higher, compared with 6 in 10 (58.5%) of those who worked from home.
As workplaces adapt, employment continues to rebound in accommodation and food services and in retail trade
In the accommodation and food services industry, three in four jobs (74.5%) involve close physical proximity with others. In retail trade, the equivalent figure is 63.4%.
Both industries, which were hardest hit by the employment losses resulting from the COVID-19 economic shutdown, recorded large employment gains for the second consecutive month in June. Employment rose by 164,000 in accommodation and food services and by 184,000 in retail trade.
Despite these gains, employment in both industries remained well below pre-COVID-19 February levels. By the week of June 14 to June 20, employment in accommodation and food services was 66.7% of its February level. Retail trade was further along in its recovery, with employment in June being 88.7% of the February level.
In June, nearly all workers in accommodation and food services (93.6%) reported having access to personal protective equipment, with the proportion only slightly lower in retail trade (87.7%).
In both industries, smaller firms were disproportionately impacted by the COVID-19 economic shutdown in March and April. From May to June, employment in accommodation and food services increased by 39.9% for small firms (fewer than 20 employees), compared with 27.9% for medium and large firms (20 employees or more). In June, employment in retail trade reached 92.3% of February levels for small firms, compared with 89.7% for medium and large firms.
For the second consecutive month, both the proportion of people working less than 50% of their usual hours and the number of unemployed people on temporary layoff who had worked in the industry in the past 12 months fell in retail trade and accommodation and food services (not seasonally adjusted). However, the number of job searchers who had last worked in those industries also increased for the second consecutive month, suggesting that while many are returning to work, a number of people previously employed in those industries are not expecting to return to their previous job (not seasonally adjusted).
Employment increases in educational services and in health care and social assistance
A high proportion of jobs in both the health care and social assistance and educational services industries involve close proximity to others.
As most provinces continued to lift COVID-19 restrictions in June, including restrictions on non-essential health care services, employment in the health care and social assistance industry increased by 121,000, reaching 95.8% of its pre-COVID-19 level.
Among health care and social assistance workers who were working outside their home in June, nearly all (94.9%) reported having access to personal protective equipment.
In the educational services industry, employment increased by 57,000 from April to June, with the number of employed people reaching 92.6% of its February level. Many workers in educational services have shifted their main place of work to their home, with two-thirds (66.9%) working from home during the week of June 14.
Modest employment rebound in other services-producing industries
The information, culture and recreation industry was subject to some of the earliest public health restrictions in the form of limitations on the size of gatherings, and all provinces continued to limit the number of people allowed to gather in public in June. While a notable increase in employment was observed in June (+60,000), employment in this industry was 83.1% of its pre-COVID level, the second-lowest proportion across all industries.
In business, building, and other support services, employment increased by 71,000 in June, bringing the total number of employed people to 93.0% of February levels. Employment also grew by 46,000 in the "other services" industry—which includes hair salons and barbershops as well as religious and civic organizations—and by 44,000 in transportation and warehousing.
Employment nearest to pre-COVID level in services-producing industries with fewest jobs involving close physical proximity
In several services-producing industries—such as wholesale trade, public administration, and finance, insurance, real estate and rental and leasing—fewer than 40% of jobs involve close proximity with others. In many of these industries, employment in June was at or near pre-COVID-shutdown levels.
Monthly employment gains were recorded in wholesale trade (+38,000) and in finance, insurance, real estate and rental and leasing (+17,000). Employment returned to pre-COVID-19 levels in wholesale trade, while it was 1.0% lower than pre-COVID-19 levels in finance, insurance, real estate and rental and leasing.
While there were no employment gains in public administration, and in professional, scientific and technical services in June, COVID-19-related employment losses have been relatively small in both industries. Compared with February, employment was 2.2% lower in public administration and 5.0% lower in professional, scientific and technical services.
In most industries where few jobs require close physical proximity with others, workers have shifted to working from home on a large scale. In finance, insurance, real estate and rental and leasing, 6 in 10 (61.2%) were working from home during the week of June 14, more than double the proportion (28.5%) who usually do so. A larger-than-usual proportion of workers also continued to work from home in professional, scientific and technical services (73.2%) and public administration (53.8%).
Large employment rebound in goods-producing industries
After avoiding large job losses in the first month of the COVID-19 economic shutdown, both the construction and manufacturing industries experienced heavy losses in April, followed by an initial recovery in May.
In June, employment in construction was 157,000 higher than in April, reaching 89.3% of its February level. In the manufacturing industry, employment gains in May and June totalled 160,000, bringing employment to 91.9% of its February level.
In each of the construction and manufacturing industries, both the proportion of people working less than 50% of their usual work hours and the number of people on temporary layoff fell markedly in June. Construction recorded a 53.8% decrease in the number of people on temporary layoff (not adjusted for seasonality).
After increasing from April to May, employment declined in natural resources in June (-6,000), with the loss almost entirely in Quebec. Employment in the industry was virtually unchanged in Alberta in June, and was at 93.8% of the February level. Nationally, employment in the industry was at 95.4% of its February level.
Most workers in goods-producing industries reported that they or their employer had put in place measures to reduce the risk of exposure to COVID-19. However, some adaptation measures were less common in agriculture, where fewer than 5 workers in 10 had access to personal protective equipment at work (47.8%) and just under 6 in 10 were working in an environment where enhanced cleaning protocols (57.0%) were in place.
Significant labour market challenges remain for youth, students, and low-wage workers
Youth employment records strong gains, but remains far below pre-COVID levels
Employment among youth aged 15 to 24 jumped by 15.4% (+263,000) in June, in line with the gradual reopening of industries with higher concentrations of young workers, such as accommodation and food services and retail trade. From February to April, employment among youth decreased by over one-third (-34.2%; -873,000). By June, employment was still down 22.7% (-580,000) compared with February, with the deficit being larger for young women (-26.4%) than young men (-19.1%).
The job market for returning students significantly worse than one year ago
Returning students—those who were enrolled full-time in March and intend to return in September—continued to face particularly challenging labour market conditions in June. On a year-over-year basis, employment for this group was down 277,000 (-23.0%) (not seasonally adjusted). This compares with a decline of 190,000 (-15.3%) among non-student youth (not seasonally adjusted).
From May to June, however, employment for returning students rose by 263,000 (+39.6%) (not adjusted for seasonality). This increase was larger than typically observed from May to June (approximately 100,000 in recent years), a possible indication that the job market for students had improved somewhat in June.
The unemployment rate in June was 33.1% for returning students, up from 12.7% in June 2019, and 20.6% for non-student youth, up from 8.5%. Among returning students aged 20 to 24—who were most likely to have completed their current year of studies by June—the unemployment rate jumped from 8.0% in June 2019 to 33.3% in June 2020.
There were 93,000 (-19.0%) fewer 17- to 19-year-old returning students working in June 2020 compared with June 2019 and all of the decrease was in part-time work. The unemployment rate for these younger students rose by 17.3 percentage points to 31.4%, as the number seeking employment soared by 126.9%.
In May, the federal government opened the application process for temporary financial supports targeted specifically at post-secondary students and recent graduates. Supplementary questions added to the June LFS indicate that 12.7% of youth aged 18 to 24 had received payments for the Canada Emergency Student Benefit (CESB), while more than one-quarter (28.5%) had received payments for the Canada Emergency Response Benefit (CERB).
Employment among low wage workers, particularly women, remains below pre-COVID levels
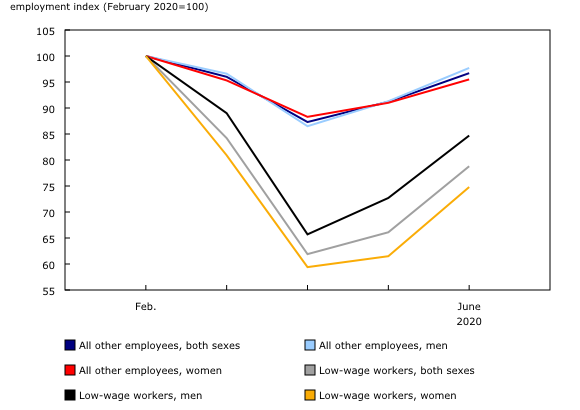
The labour market impact of the COVID-19 economic shutdown was particularly severe for lower-wage workers. From February to April, employment among employees who earned less than $16.03 per hour (two-thirds of the 2019 annual median wage of $24.04/hour) fell by 38.1%, compared with a decline of 12.7% for all other paid employees (not adjusted for seasonality).
In June, employment grew more strongly among lower-wage (+19.3%; +414,000) than among other employees (+6.0%; +699,000) (not adjusted for seasonality). Nevertheless, the recovery rate among low-wage workers (78.8% of the February level) was noticeably lower than the rate among other employees (96.7%) (not adjusted for seasonality).
In June, employment levels among female workers in a low-wage job had reached 74.8% of their February levels, versus 84.7% for their male counterparts (not adjusted for seasonality).
Among parents, employment recovery slowest for mothers with school-aged children
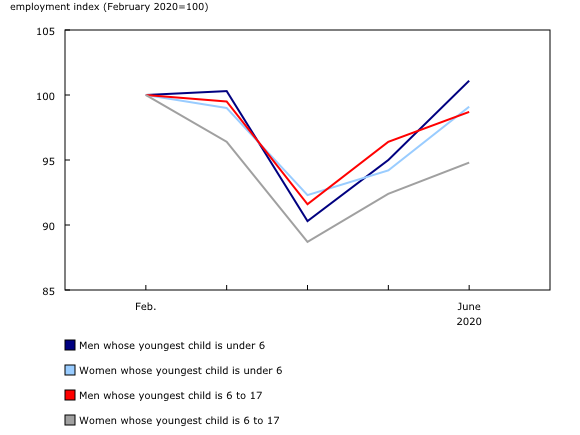
In June, employment among core-aged workers whose youngest child was less than 6 years old increased for both men (+6.4%) and women (+5.2%). By the week of June 14 to June 20, when daycare services for children aged 0 to 5 had reopened in some provinces, employment had returned to February levels for fathers in this group (unadjusted for seasonality) and had edged close to pre-COVID levels for mothers.
Among parents whose youngest child was aged 6 to 17, employment increased in June for fathers, approaching February levels. Among mothers whose youngest child was aged 6 to 17, however, employment remained about 5 percentage points away from the pre-COVID level, despite a month-over-month gain of 2.6% (unadjusted for seasonality). As the easing of COVID-19 restrictions continues in the coming months, and as children aged 6 to 17 begin to return to school in September, the ability of mothers of these children to return to pre-COVID employment levels will be of particular interest to monitor.
A greater proportion of core-aged women with children under 18 (14.3%) worked less than half their usual hours compared with their male counterparts (8.7%) in June, although both shares have decreased significantly since April (unadjusted for seasonality). While the proportions for both women and men remain higher than before the COVID-19 period, the greater tendency for mothers to be absent from work compared with fathers has been a long-standing trend.
Fewer people living in families where no one is employed
In June, the number of people living in couples where neither partner was employed fell for a second consecutive month (-4.6%), while the number of people living in couples in which only one partner was employed also decreased (-7.0%) (not adjusted for seasonality). Although the number of people in these non- and single-earner couple arrangements has declined since April, it remains substantially above pre-COVID levels. The number of single parents who were not employed also fell in June (-11.9%), with the decline in percentage terms larger among men. On average, about three-quarters of single parent families in Canada are headed by women.
Small decline in proportion of people living in households reporting difficulty meeting financial needs
In June, more than one-quarter (28.3%) of Canadians aged 15 to 69 reported receiving some kind of federal income assistance payment since March 15 (the CERB, the CESB, regular Employment Insurance benefits, or new benefits for which they were unsure of the source). The share was higher among those living in households reporting difficulty meeting financial needs (40.7%) compared with those in households who reported it was easy to meet financial needs (21.7%).
Since April, the LFS has included a supplementary question about difficulty meeting basic household financial needs, such as rent or mortgage payments, utilities, and groceries. In June, in the context of continuing employment recovery and ongoing unprecedented government income assistance payments, the proportion of Canadians living in households reporting such difficulties declined slightly, from 22.5% in May to 20.1%.
Among people aged 25 to 54, just over half (51.5%) of those in couples where neither partner is employed lived in households reporting difficulty meeting financial needs, compared with 13.9% of those in couples where both partners are employed. These results are not notably different from those recorded in April, and may reflect differences that were present before the onset of the COVID-19 shutdown.
Employment rate up among very recent immigrants
In June, the employment rate among very recent immigrants (five years or less) rose 3.9 percentage points to 58.5%, driven in part by a decline in the size of this population group. The month-over-month rise was comparable to increases observed among landed immigrants of more than five years (+3.2 percentage points to 53.7%) and those born in Canada (+3.7 percentage points to 58.2%).
Comparable employment recovery between Aboriginal and non-Aboriginal peoples
In June, employment increased by 4.1% (+21,000) among Aboriginal people living off-reserve compared with 6.9% (+1,113,000) among the non-Aboriginal population (not adjusted for seasonality). This brought employment to 6.9% below February levels among Aboriginal people, compared with 6.1% below among the non-Aboriginal population.
In June, the employment rate for Aboriginal people living off-reserve was 4.4 percentage points below the February rate, compared with 3.9 percentage points for the non-Aboriginal population.
Looking ahead
The labour market shock resulting from the COVID-19 economic shutdown has had an unequal impact on different groups of Canadians. In March and April, a disproportionate share of job loss was felt by youth, women and low-paid workers. LFS results from May and June indicate that these same groups face a longer path to labour market recovery than others.
At the same time, workers in a number of industries have continued to work during the COVID-19 shutdown and initial recovery, despite their jobs involving close contact with others, and the associated risk of exposure to the COVID-19 virus. Recent data from the Survey of Employment, Payrolls and Hours, for example, showed that overtime earnings of hospital workers increased by almost one-third (+31.2%, not seasonally adjusted) in April.
In July, the Labour Force Survey will begin asking respondents to report the ethno-cultural groups to which they belong. This will help to equip policymakers with the information needed to address social and economic inequalities, including the impact of COVID-19 across diverse populations. Results based on this new question will be included in the release of July LFS results on August 7.
Sustainable Development Goals
On January 1, 2016, the world officially began implementation of the 2030 Agenda for Sustainable Development—the United Nations' transformative plan of action that addresses urgent global challenges over the next 15 years. The plan is based on 17 specific sustainable development goals.
The Labour Force Survey is an example of how Statistics Canada supports the reporting on the global sustainable development goals. This release will be used to help measure the following goals:


Note to readers
The Labour Force Survey (LFS) estimates for June are for the week of June 14 to 20.
The LFS estimates are based on a sample and are therefore subject to sampling variability. As a result, monthly estimates will show more variability than trends observed over longer time periods. For more information, see "Interpreting Monthly Changes in Employment from the Labour Force Survey."
This analysis focuses on differences between estimates that are statistically significant at the 68% confidence level.
The LFS estimates are the first in a series of labour market indicators released by Statistics Canada, which includes indicators from programs such as the Survey of Employment, Payrolls and Hours (SEPH); Employment Insurance Statistics; and the Job Vacancy and Wage Survey. For more information on the conceptual differences between employment measures from the LFS and those from the SEPH, refer to section 8 of the Guide to the Labour Force Survey (71-543-G).
LFS estimates at the Canada level do not include the territories.
Since March 2020, all face-to-face interviews were replaced by telephone interviews to protect the health of both interviewers and respondents. In addition, all telephone interviews were conducted by interviewers working from their home and none were done from Statistics Canada's call centres. In June, approximately 40,000 interviews were completed, compared with 40,700 in May.
The distribution of LFS interviews in June 2020 compared with May 2020, was as follows:
Personal face-to-face interviews
• May 2020 0.0%
• June 2020 0.0%
Telephone interviews – from call centres
• May 2020 0.0%
• June 2020 0.0%
Telephone interviews – from interviewer homes
• May 2020 68.3%
• June 2020 69.2%
Online interviews
• May 2020 31.7%
• June 2020 30.8%
The employment rate is the number of employed people as a percentage of the population aged 15 and older. The rate for a particular group (for example, youths aged 15 to 24) is the number employed in that group as a percentage of the population for that group.
The unemployment rate is the number of unemployed people as a percentage of the labour force (employed and unemployed).
The participation rate is the number of employed and unemployed people as a percentage of the population aged 15 and older.
Full-time employment consists of persons who usually work 30 hours or more per week at their main or only job.
Part-time employment consists of persons who usually work less than 30 hours per week at their main or only job.
Total hours worked refers to the number of hours actually worked at the main job by the respondent during the reference week, including paid and unpaid hours. These hours reflect temporary decreases or increases in work hours (for example, hours lost due to illness, vacation, holidays or weather; or more hours worked due to overtime).
In general, month-to-month or year-to-year changes in the number of people employed in an age group reflect the net effect of two factors: (1) the number of people who changed employment status between reference periods, and (2) the number of employed people who entered or left the age group (including through aging, death or migration) between reference periods.
Supplementary indicators used in June 2020 analysis
To continue capturing the effect of the COVID-19 pandemic on the labour market, the supplementary indicators used in April have been slightly adapted in May and June. Therefore, they are not directly comparable to the supplementary indicators published in April and March 2020.
Employed, worked zero hours includes employees and self-employed who were absent from work all week, but excludes people who have been away for reasons such as 'vacation,' 'maternity,' 'seasonal business' and 'labour dispute.'
Employed, worked less than half of their usual hours includes both employees and self-employed, where only employees were asked to provide a reason for the absence. This excludes reasons for absence such as 'vacation,' 'labour dispute,' 'maternity,' 'holiday,' and 'weather.' Also excludes those who were away all week.
Not in labour force but wanted work includes persons who were neither employed, nor unemployed during the reference period and wanted work, but did not search for reasons such as 'waiting for recall (to former job),' 'waiting for replies from employers,' 'believes no work available (in area, or suited to skills),' 'long-term future start,' and 'other.'
Unemployed, job searchers were without work, but had looked for work in the past four weeks ending with the reference period and were available for work.
Unemployed, temporary layoff or future starts were on temporary layoff due to business conditions, with an expectation of recall, and were available for work; or were without work, but had a job to start within four weeks from the reference period and were available for work (don't need to have looked for work during the four weeks ending with the reference week).
Labour underutilization rate (specific definition to measure the COVID-19 impact) combines all those who were unemployed with those who were not in the labour force but wanted a job and did not look for one; as well as those who remained employed but lost all or the majority of their usual work hours for reasons likely related to COVID-19 as a proportion of the potential labour force.
Potential labour force (specific definition to measure the COVID-19 impact) includes people in the labour force (all employed and unemployed people), and people not in the labour force who wanted a job but didn't search for reasons such as 'waiting for recall (to former job),' 'waiting for replies from employers,' 'believes no work available (in area, or suited to skills),' 'long-term future start,' and 'other.'
Time-related underemployment rate combines people who remained employed but lost all or the majority of their usual work hours as a proportion of all employed people.
Seasonal adjustment
Unless otherwise stated, this release presents seasonally adjusted estimates, which facilitate comparisons by removing the effects of seasonal variations. For more information on seasonal adjustment, see Seasonally adjusted data – Frequently asked questions.
The seasonally adjusted data for retail trade and wholesale trade industries presented here are not published in other public LFS tables. A seasonally adjusted series is published for the combined industry classification (wholesale and retail trade).
Next release
The next release of the LFS will be on August 7.
Products
The infographic "COVID-19 and the labour market in June 2020" is now available.
More information about the concepts and use of the Labour Force Survey is available online in the Guide to the Labour Force Survey (71-543-G).
The product "Labour Force Survey in brief: Interactive app" (14200001) is also available. This interactive visualization application provides seasonally adjusted estimates available by province, sex, age group and industry. Historical estimates going back five years are also included for monthly employment changes and unemployment rates. The interactive application allows users to quickly and easily explore and personalize the information presented. Combine multiple provinces, sexes and age groups to create your own labour market domains of interest.
The product "Labour Market Indicators, by province and census metropolitan area, seasonally adjusted" (71-607-X) is also available. This interactive dashboard provides easy, customizable access to key labour market indicators. Users can now configure an interactive map and chart showing labour force characteristics at the national, provincial or census metropolitan area level.
The product "Labour Market Indicators, by province, territory and economic region, unadjusted for seasonality" (71-607-X) is also available. This dynamic web application provides access to Statistics Canada's labour market indicators for Canada, by province, territory and economic region and allows users to view a snapshot of key labour market indicators, observe geographical rankings for each indicator using an interactive map and table, and easily copy data into other programs.
Contact information
For more information, contact us (toll-free 1-800-263-1136; 514-283-8300; STATCAN.infostats-infostats.STATCAN@canada.ca).
- Date modified:


