Infographic 4
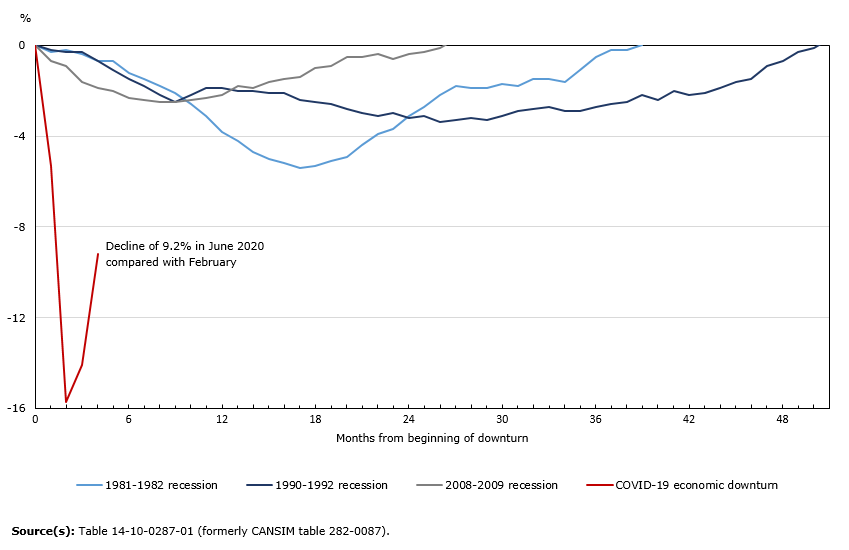
Employment changes indexed from beginning of notable downturns, 1980 to 2020, Canada

Infographic description
The title of the infographic is "Employment changes indexed from beginning of notable downturns, 1980 to 2020, Canada"
This is a linear chart.
The vertical axis shows percentages, from -16 to 0 by increments of 4.
The horizontal axis shows number months from beginning of downturn from 0 to 51 by increments of 6.
There are four series.
The first series is "1981-1982 recession." Its highest point is 0.0% at 0 months, and its lowest point is -5.4% at 17 months.
The second series is "1990-1992 recession." Its highest point is 0.0% at 0 months, and its lowest point is -3.4% at 26 months.
The third series is "2008-2009 recession." Its highest point is 0.0% at 0 months, and its lowest point is -2.5% at 9 months.
The fourth series is "COVID-19 economic downturn." Its highest point is 0.0% at 0 months, and its lowest point is -15.7% at 2 months. This series shows a decline of 9.2% in June 2020 compared with February.
Source(s): Table 14-10-0287-01 (formerly CANSIM table 282-0087).
- Date modified: