
Economic and Social Reports
Recent developments in the Canadian economy: Spring 2023
DOI: https://doi.org/10.25318/36280001202300400002-eng
Skip to text
Text begins
This article provides an integrated summary of recent changes in output, consumer prices, employment, and household finances. It highlights changes in the economic data during the second half of 2022 and into the winter months. The article also examines how economic conditions have changed as borrowing costs have risen.
The report is based on data that are publicly available as of March 31, 2023. New insights on Canada’s economy and society three years after the start of the COVID-19 pandemic are now available, including analysis on demographic trends and the interconnectedness of current economic and social challenges, in addition to a special piece on Consumer price inflation, recent trends and analysis for more on the determinants of higher prices. Monthly information on government, business, and financial market developments, including public health measures related to the pandemic, is available at Canadian Economic News (Statistics Canada n.d.). Monthly commentary on economic developments related to COVID-19 can be found at Canadian Economic Dashboard and COVID-19 (Statistics Canada n.d.).
Overview
Economic activity slowed during the second half of 2022 as businesses and households adjusted to higher borrowing costs. Business entry pulled back and investment in housing contracted sharply. Household spending rose late in the year, while merchandise export volumes and non-residential business outlays edged down. Employment strengthened as the unmet demand for workers eased. Business labour productivity remained near pre-pandemic levels while unit labour costs continued to trend higher.
Headline consumer inflation eased during the second half of 2022, while prices for many household essentials, including food and shelter, remained elevated. Food inflation rose into double-digit territory, while higher mortgage interest costs put upward pressure on shelter prices. Housing affordability deteriorated as mortgage and non-mortgage borrowing grew at a slower pace.
Authors
Guy Gellatly and Carter McCormack work with the Strategic Analysis, Publications and Training division, Analytical Studies and Modelling Branch, Statistics Canada.
Economic growth stalls as domestic demand edges higher
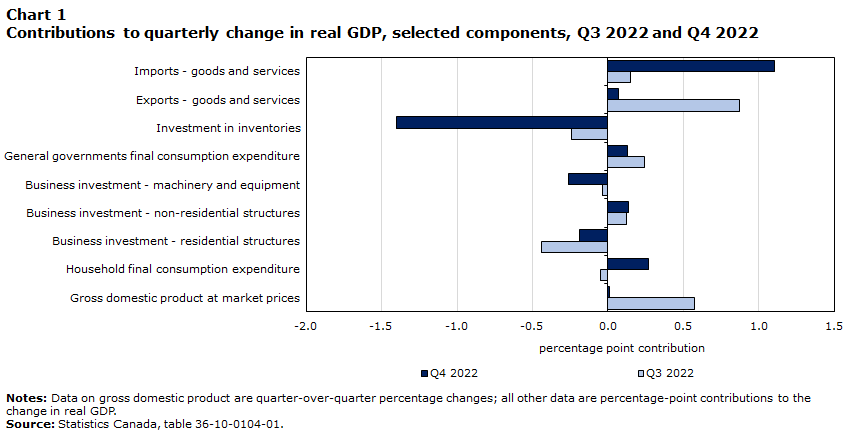
Real gross domestic product (GDP) was basically unchanged in the fourth quarter after rising 0.6% in the third. The flat read on headline GDP followed five consecutive quarters of growth. Slower inventory buildups, lower investment in housing, and lower business outlays on machinery and equipment (M&E) were offset by increases in household and government spending and improvements in net trade (Chart 1).
Data table for Chart 1
| Q3 2022 | Q4 2022 | |
|---|---|---|
| percentage point contribution | ||
| Imports - goods and services | 0.15 | 1.10 |
| Exports - goods and services | 0.87 | 0.07 |
| Investment in inventories | -0.25 | -1.40 |
| General governments final consumption expenditure | 0.24 | 0.13 |
| Business investment - machinery and equipment |
-0.04 | -0.26 |
| Business investment - non-residential structures | 0.12 | 0.14 |
| Business investment - residential structures | -0.44 | -0.19 |
| Household final consumption expenditure | -0.05 | 0.27 |
| Gross domestic product at market prices | 0.58 | 0.01 |
|
Notes: Data on gross domestic product are quarter-over-quarter percentage changes; all other data are percentage-point contributions to the quarterly growth rates in real GDP. Source: Statistics Canada table 36-10-0104-01. |
||
Real GDP in fourth quarter was 2.1% higher than in the fourth quarter of last year, and 2.9% above pre-pandemic levels observed in late 2019.
Following record stockpiling earlier in the year, lower inventory accumulation weighed on economic activity in the fourth quarter, reflecting smaller buildups of manufacturing products and retail and wholesale durables.
Investment in housing also detracted from growth as borrowers continue to adjust to higher financing costs. Outlays on housing fell for the third consecutive quarter (-2.3%) as renovations, resale activity, and new construction all declined. Total residential investment in the fourth quarter was about 2% below pre-COVID levels (Chart 2).

Data table for Chart 2
| Household expenditure | General government final consumption expenditure | Non-residential business investment | Exports of goods and services | Housing | |
|---|---|---|---|---|---|
| index (Q4 2019=100) | |||||
| 2019 | |||||
| Q4 | 100.0 | 100.0 | 100.0 | 100.0 | 100.0 |
| 2020 | |||||
| Q1 | 97.7 | 100.0 | 99.8 | 98.1 | 98.9 |
| Q2 | 84.0 | 96.1 | 81.0 | 81.5 | 84.6 |
| Q3 | 94.9 | 101.5 | 86.8 | 92.6 | 111.4 |
| Q4 | 95.2 | 103.3 | 88.1 | 94.1 | 117.0 |
| 2021 | |||||
| Q1 | 95.7 | 105.5 | 88.0 | 95.2 | 126.8 |
| Q2 | 95.2 | 106.4 | 92.6 | 90.3 | 121.7 |
| Q3 | 99.8 | 106.9 | 93.5 | 91.1 | 110.9 |
| Q4 | 100.1 | 107.7 | 96.8 | 94.6 | 114.1 |
| 2022 | |||||
| Q1 | 100.6 | 108.4 | 97.6 | 92.8 | 116.0 |
| Q2 | 102.9 | 107.8 | 100.6 | 94.3 | 106.0 |
| Q3 | 102.8 | 109.1 | 101.6 | 96.8 | 100.6 |
| Q4 | 103.3 | 109.7 | 100.2 | 97.0 | 98.3 |
| Source: Statistics Canada, table 36-10-0104-01. | |||||
Non-residential business investment also declined in late 2022 after six consecutive quarterly increases. Combined business outlays on non-residential structures and M&E were down 1.4% as lower spending on M&E offset higher outlays on structures. Investment in M&E fell 7.8%, reflecting lower outlays on industrial machinery and equipment, computer equipment, and aircraft and other transportation equipment, while spending on engineering structures rose for the ninth consecutive quarter. Business outlays on intellectual property products continued to increase, advancing for the fourth consecutive quarter.
Merchandise exports edged down 0.3% in the fourth quarter, reflecting lower shipments of metal products, energy products, and motor vehicles and parts. Service exports rose 2.9%, bolstered by higher travel volumes. Total export volumes in the fourth quarter were 3% below pre-pandemic levels.
Goods imports were down 3.4% in the quarter, led by lower shipments of pharmaceuticals, computer equipment and electronics. Service imports fell 2.1%. Despite the pullback, total import volumes remained nearly 5% above pre-COVID levels.
Household expenditures strengthened late in the year as outlays on consumer durables rebounded. Household spending rose 0.5%, supported by purchases of new and used vehicles as easing supply disruptions improved the ability of automakers to meet consumer demand.Note Household spending on food products fell for the seventh consecutive quarter but remained just above pre-pandemic levels. Total spending volumes in late 2022 were 3.3% above their pre-pandemic benchmark.
Final domestic demand, supported by higher spending on consumer durables, rose 0.3% in the fourth quarter, offsetting a 0.2% decline in the third. Final domestic demand in late 2022 was 4% above pre-COVID levels.
Household incomes continue to rise
Household disposable income rose 3.0% in the fourth quarter, buoyed in part by enhancements in government benefits.Note Income gains outpaced the growth in current dollar consumption (+1.6%), pushing the savings rate up to 6.0%. Both household disposable income and saving remain well above their pre-pandemic benchmarks. Disposable income in the fourth quarter was almost 20% above pre-COVID levels, while the savings rate was over twice the rate observed in late 2019.
Business productivity continues to trend lower
Business labour productivity, a measure of the volume of goods and services produced per hour worked, posted its ninth decrease in the last ten quarters. Labour productivity in the fourth quarter was slightly below its pre-COVID baseline, while unit labour costs, which measure the payments to labour required to produce a unit of output, were almost 17% above levels observed in late 2019 (Chart 3). Lower productivity in the goods sector weighed on business productivity late in year, while productivity rose in the service sector for the first time since the initial COVID lockdowns.Note

Data table for Chart 3
| Labour productivity | Unit labour costs | |
|---|---|---|
| index (Q1 2017=100) | ||
| 2017 | ||
| Q1 | 100.00 | 100.00 |
| Q2 | 99.98 | 99.72 |
| Q3 | 99.14 | 101.65 |
| Q4 | 99.60 | 102.99 |
| 2018 | ||
| Q1 | 99.70 | 103.87 |
| Q2 | 100.24 | 103.30 |
| Q3 | 100.00 | 103.46 |
| Q4 | 99.92 | 104.51 |
| 2019 | ||
| Q1 | 100.26 | 105.45 |
| Q2 | 100.18 | 105.68 |
| Q3 | 100.28 | 106.62 |
| Q4 | 100.73 | 107.50 |
| 2020 | ||
| Q1 | 105.38 | 107.91 |
| Q2 | 118.88 | 111.98 |
| Q3 | 107.06 | 110.16 |
| Q4 | 105.40 | 110.50 |
| 2021 | ||
| Q1 | 104.40 | 111.38 |
| Q2 | 102.80 | 115.78 |
| Q3 | 101.56 | 118.16 |
| Q4 | 101.09 | 117.70 |
| 2022 | ||
| Q1 | 101.29 | 121.30 |
| Q2 | 101.17 | 123.41 |
| Q3 | 100.91 | 124.23 |
| Q4 | 100.39 | 125.59 |
| Source: Statistics Canada, table 36-10-0206-01 | ||
Output growth slows in late 2022
Economy-wide output edged down in December 2022 after rising steadily over much of the year. The pace of growth slowed in late 2022 as lower business sector output was offset by higher activity in public sector industriesNote (Chart 4). Lower mining and oil and gas extraction weighed on output growth in the fourth quarter.

Data table for Chart 4
| Business sector industries | Non-business sector industries | |
|---|---|---|
| month-over-month percentage change | ||
| 2021 | ||
| January | 0.4 | 0.4 |
| February | 0.2 | 0.5 |
| March | 0.9 | 1.1 |
| April | -1.0 | -0.8 |
| May | -0.9 | 0.9 |
| June | 0.8 | 0.7 |
| July | 0.5 | 0.5 |
| August | 0.7 | 0.0 |
| September | 0.3 | 0.5 |
| October | 1.0 | -0.2 |
| November | 0.5 | 0.3 |
| December | 0.1 | 0.1 |
| 2022 | ||
| January | -0.2 | -0.3 |
| February | 0.6 | 0.8 |
| March | 0.8 | 0.0 |
| April | 0.2 | 0.1 |
| May | 0.1 | 0.5 |
| June | 0.2 | 0.4 |
| July | 0.1 | 0.3 |
| August | 0.2 | 0.3 |
| September | 0.1 | 0.1 |
| October | -0.2 | 0.6 |
| November | 0.1 | 0.4 |
| December | -0.2 | 0.3 |
| 2023 | ||
| January | 0.6 | 0.3 |
| Source: Statistics Canada, table 36-10-0434-01 | ||
Activity at several client-facing services levelled off during the second half after ramping up earlier in the year following Omicron-related disruptions. Accommodation services, buoyed by rising travel volumes, posted gains in four out of the last six months, recovering to within 6% of its pre-COVID benchmark. Food services and drinking places posted three gains in the second half as volumes at year end remained almost 9% below pre-pandemic levels. Air transportation advanced steadily from February to November before severe winter storms weighed on activity in December, ending the year 30% below its pre-COVID benchmark. Arts, entertainment, and recreation also advanced throughout much of the second half.
After a recent peak in May 2022, retail volumes moderated, posting two gains during the last six months of the year. Activity was up 1.3% in December, bolstered by higher sales at motor vehicle and parts dealers. Overall retail volumes at year end were over 4% above pre-pandemic levels.
Output continued to pull back in sectors directly impacted by higher interest rates. Activity at real estate agents and brokers fell steadily from March to December and, at year end, was almost one quarter below pre-pandemic levels. Residential building construction declined for the eighth time in nine months in December but remained about 3% above its pre-COVID baseline. Legal services, which are strongly influenced by housing market activity, fell steadily from March to November before edging higher at year end.
Lower output in mining and oil and gas extraction and manufacturing weighed on economy-wide output late in the year. After reaching a record high in September 2022, production in the oil sands fell from October to December as scheduled and unplanned maintenance events impacted activity.Note Manufacturing output was down four out of the last six months of the year as both durable and non-durable production pulled back.
High-technology services continued to expand steadily. At year end, activity related to computer systems design has increased for 20 consecutive months and was 27% above pre-pandemic levels. Similarly, scientific research and development services has expanded for 18 consecutive months, ending the year 24% above its pre-COVID baseline.
Economy-wide output rose swiftly in January 2023 as 17 out of 20 major industries posted gains. January’s headline (+0.5%) marked the largest monthly increase since public health measures where being eased early in the year. Statistics Canada’s advance estimate of real GDP points to a 0.3% increase in February.
Headline inflation eases while food prices continue to rise
After peaking at 8.1% in June, headline consumer inflation eased during the second half of 2022, decelerating to 6.3% by year end. The slower pace of price growth after mid-year largely reflected lower prices for gasoline, while higher mortgage interest costs put upward pressure on the headline rate. December marked the 21st consecutive month that headline inflation had been above three percent, and the 10th consecutive month above six percent. Annual price growth excluding gasoline was also 6.3% at year end as inflationary pressures remain widespread.
Consumer inflation continued to ease in early 2023 as base-year effects put downward pressure on the headline rate.Note After edging below the six percent mark in January, headline inflation slowed to 5.2% in February, the largest deceleration in the all-items index since the onset of pandemic. Measured on a month-over-month basis, consumer prices rose in both January and February after declining in December.Note Consumer prices have risen in 23 out of 26 months since inflationary pressure began to build in early 2021.
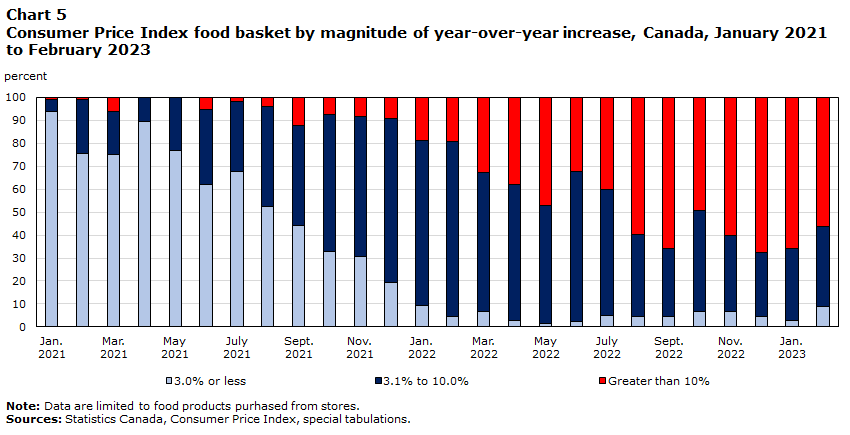
Food price inflation has shown little signs of easing. Yearly price increases for groceries rose into double-digit territory from August to February, averaging 11.1% over this seven-month period. While the growth in meat prices moderated, annual price increases for fresh fruit and fresh vegetables remained elevated, averaging 11.2% and 11.7% respectively, since mid-2022. Yearly price increases for pasta products, which were heavily impacted by Russia’s invasion of Ukraine, have averaged 21.4% since mid-2022, while price growth for dairy products, bolstered by increases in farm gate prices in early 2022, have averaged 10% during this period.
The steep rise in food inflation during 2022 was exceptionally broad-based with elevated price increases affecting a larger amount of food spending.Note In mid-2022, about one third of total spending on grocery items was on products that had seen yearly price increases of more than 10%; by year end, about two thirds of grocery expenditures were on items with price increases in this elevated, double-digit range (Chart 5).
Data table for Chart 5
| 3.0% or less | 3.1% to 10.0% | Greater than 10% | |
|---|---|---|---|
| percent | |||
| 2021 | |||
| January | 93.89 | 5.23 | 0.89 |
| February | 75.47 | 23.65 | 0.89 |
| March | 75.20 | 18.51 | 6.29 |
| April | 89.37 | 10.63 | 0.00 |
| May | 76.71 | 23.29 | 0.00 |
| June | 62.00 | 32.91 | 5.09 |
| July | 67.51 | 30.62 | 1.87 |
| August | 52.50 | 43.68 | 3.82 |
| September | 44.27 | 43.68 | 12.04 |
| October | 32.91 | 59.63 | 7.46 |
| November | 30.70 | 60.81 | 8.48 |
| December | 19.51 | 71.16 | 9.33 |
| 2022 | |||
| January | 9.33 | 71.84 | 18.83 |
| February | 4.33 | 76.42 | 19.25 |
| March | 6.70 | 60.56 | 32.74 |
| April | 2.71 | 59.20 | 38.08 |
| May | 1.52 | 51.25 | 47.22 |
| June | 2.51 | 65.05 | 32.44 |
| July | 4.84 | 55.11 | 40.05 |
| August | 4.57 | 35.84 | 59.59 |
| September | 4.39 | 29.57 | 66.04 |
| October | 6.63 | 44.27 | 49.10 |
| November | 6.54 | 33.15 | 60.30 |
| December | 4.57 | 27.87 | 67.56 |
| 2023 | |||
| January | 2.78 | 31.54 | 65.68 |
| February | 9.05 | 34.86 | 56.09 |
|
Note: Data are limited to food products purhased from stores. Sources: Statistics Canada, Consumer Price Index, special tabulations. |
|||
Shelter costs remain elevated but have risen at a slower pace in recent months amid the pullback in housing market activity. After peaking at 7.4% in the spring of 2022, shelter costs, measured year-over-year, eased to 7.0% at year end, before slowing further in January (6.6%) and February (6.1%). Lower homeowners’ replacement costs (which reflect prices for new homes) and other owned accommodation expenses (which include commissions on real estate transactions) have contributed to the moderation in shelter costs. At the same time, rising mortgage interest costs have put upward pressure on shelter costs as homeowners adjust to higher interest rates. In February 2023, mortgage interest costs rose at their fastest year-over-year pace (+23.9%) in over four decades. Rental prices have also risen as demand has ramped up. Yearly price increases for rental accommodation, which reflect both older and more recent rental contracts, rose to 5.9% in late 2022, before easing to 5.4% in February 2023.
Rising food prices and shelter costs continue to be key financial stressors for Canadian families. In late 2022, about three quarters of Canadians were very concerned about rising food prices and about one in three Canadians lived in a household that had difficulty meeting its financial needs over the past year. Almost half of Canadians (+44%) in late 2022 said they were very concerned with their household’s ability to afford housing or rent. One in four Canadians also reported that they were unable to cover an unexpected expense of $500. Young adults were among those most concerned, with almost half of 35 to 44 year-olds (+44%) reporting difficulties meeting their financial needs in the previous 12 months.Note
Employment surges on gains in full-time work
The labour market remained resilient during the second half of 2022. After moderating during the spring and summer months, employment strengthened late in the year with gains from September to December totalling 164,000. All of the net growth in the fourth quarter was in full-time work and heavily concentrated among private-sector employees (Chart 6). Higher employment among young workers accounted for more than half of the net increase over this three-month period. Broad-based increases across industries were led by higher employment in construction and professional, scientific, and technical services. By year end, the unemployment rate had edged down to 5.0%, near the record low of 4.9% reported in June and July.

Data table for Chart 6
| Public sector employees | Private sector employees | Self-employed | |
|---|---|---|---|
| month-over-month change, thousands of persons | |||
| 2021 | |||
| January | 19.40 | -229.70 | 23.50 |
| February | 33.70 | 266.10 | -30.30 |
| March | 41.70 | 194.30 | 16.60 |
| April | -34.30 | -149.80 | -12.80 |
| May | 16.60 | -83.00 | 7.70 |
| June | 40.60 | 246.40 | -33.60 |
| July | 3.40 | 90.40 | 15.40 |
| August | 12.90 | 85.40 | -28.00 |
| September | 95.00 | 85.20 | -14.00 |
| October | -39.60 | 74.10 | 1.90 |
| November | 43.90 | 77.40 | 18.00 |
| December | 11.80 | 65.80 | 1.30 |
| 2022 | |||
| January | -6.60 | -186.40 | 5.80 |
| February | 8.30 | 318.10 | 31.30 |
| March | 4.60 | 40.40 | -25.40 |
| April | -8.10 | 68.80 | -7.70 |
| May | 72.70 | -74.00 | 32.90 |
| June | -18.00 | -1.40 | -25.70 |
| July | -13.40 | 38.10 | 3.60 |
| August | -10.70 | -12.30 | -1.80 |
| September | 37.80 | -7.20 | -18.80 |
| October | 3.80 | 58.60 | 6.00 |
| November | -1.50 | 0.80 | 27.30 |
| December | -29.80 | 99.20 | -0.10 |
| 2023 | |||
| January | 31.50 | 114.70 | 3.70 |
| February | -7.90 | 38.50 | -8.90 |
|
Note: Shaded areas denote periods impacted by tightening or easing of COVID-19 public health measures. Date ranges from January 2021 to February 2021 and December 2021 to February 2021. Source: Statistics Canada, table 14-10-0288-01. |
|||
Employment surged by 150,000 in January, led by gains among core-age workers and private sector employees. Most of the headline increase was in full-time work. Employment held steady in February as the number of private sector workers continued to edge higher. Cumulative gains over the first two months of 2023 were led by higher employment in wholesale and retail trade, which rebounded from losses in late 2022, and increases in health care and social assistance. Total hours worked also rose sharply in early 2023, advancing 0.8% in January and 0.6% in February.
Three years after the start of the COVID-19 pandemic, employment rates among core-age men and core-age women are near record highs and well above pre-pandemic benchmarks. In February, 85.1% of 25 to 54 year-olds were employed and their unemployment rate stood at 4.3%. Employment rates among young men and women are also well above pre-pandemic levels, while proportionally fewer people aged 55 and over are working due to the impacts of population aging.Note
Unmet demand for workers eases
After peaking at over one million in the spring, job vacancies trended lower in the second half of 2022, declining to 854,000 by year end (Chart 7). Many sectors reported lower vacancies during this period, with sizable pullbacks in accommodation and food services and administrative and support services.Note

Data table for Chart 7
| Health care and social assistance (LHS) | Accommodation and food services (LHS) | Total, all industries (RHS) | |
|---|---|---|---|
| job vacancies | |||
| 2021 | |||
| January | 90,710 | 60,430 | 572,620 |
| February | 118,570 | 61,550 | 619,225 |
| March | 96,480 | 74,475 | 643,880 |
| April | 106,015 | 66,145 | 652,955 |
| May | 114,150 | 70,385 | 673,375 |
| June | 106,015 | 106,965 | 765,040 |
| July | 103,575 | 126,305 | 808,085 |
| August | 124,610 | 148,555 | 874,385 |
| September | 121,670 | 162,760 | 912,085 |
| October | 123,315 | 150,810 | 919,815 |
| November | 118,305 | 142,160 | 910,575 |
| December | 136,880 | 163,540 | 978,610 |
| 2022 | |||
| January | 136,535 | 126,445 | 938,195 |
| February | 123,780 | 139,570 | 921,430 |
| March | 147,280 | 153,845 | 990,015 |
| April | 130,825 | 154,020 | 993,625 |
| May | 135,815 | 157,700 | 1,003,240 |
| June | 146,905 | 150,845 | 984,175 |
| July | 152,840 | 136,410 | 974,990 |
| August | 139,810 | 123,185 | 924,075 |
| September | 152,435 | 123,520 | 911,085 |
| October | 152,745 | 122,250 | 890,670 |
| November | 130,675 | 120,560 | 871,855 |
| December | 149,775 | 114,875 | 854,255 |
| 2023 | |||
| January | 162,135 | 118,850 | 883,230 |
|
Note: RHS refers to right hand scale and LHS referes to left hand scale. Source: Statistics Canada, table 14-10-0406-01. |
|||
Job vacancies edged up in January 2023, led by increases in transportation and warehousing and healthcare and social assistance. Vacancies in healthcare and social assistance rose to a record high of 162,000, more than twice their pre-pandemic level. Labour markets remained tight into the new year with 1.2 unemployed persons for every job vacancy, a level which has remained virtually unchanged since the summer months.
The unmet demand for lower-skilled positions moderated as employment ramped up during 2022. In the fourth quarter, the number of vacancies for positions requiring a high school diploma or less was down 12.8% from levels in late 2021, while vacancies for positions requiring a bachelor’s degree or higher were up 6.9%. Average offered hourly wages for vacant positions rose 8.5% during this period, partly due to a shift in the relative composition of vacancies from lower to higher wage occupations.Note Adjusting for compositional changes, the year-over-year increases in offered wages was 5.9%.Note Customer and service representatives along with nurse aides, orderlies and patient service associates had among the largest increases in offered wages.
Household wealth increases as leverage ratios improve in late 2022
After cumulative declines of nearly $1.2 trillion during the second and third quarters, household net worth rose by $181 billion in the fourth as stronger equities offset continued declines in housing. Despite heavy losses earlier in the year, household wealth, at $15.3 trillion, remained 23.4% above pre-pandemic levels in late 2022.
Household mortgage and non-mortgage borrowing increased at slower pace in the second half. The ratio of household credit-market debt to disposable income declined to 180.5%, while the household debt-to-asset ratio fell to 15.7%, about 50 basis points under its pre-COVID benchmark. The value of household currency and deposits topped the two trillion mark in late 2022 and was 31% above levels observed in late 2019.
Higher living costs and falling asset values over the course of 2022 negatively impacted net saving and wealth, especially among households with lower incomes and younger age profiles. Income inequality narrowed in 2022 due to sizable increases in employment income among lower earning households. At the same time, wealth inequality rose but remained below pre-pandemic levels.
References
Li, B., R. Fair, and C. Johnston. 2023. Analysis on supply chain challenges and conditions in Canada, first quarter of 2023. Analysis in Brief. Catalogue no. 11-621-M. Ottawa: Statistics Canada.
Mitchell, T. and G. Gellatly. 2023. Assessing the rise in broad-based inflationary pressure during 2021 and 2022. Economic and Social Reports. Catalogue no. 36-28-0001. Ottawa: Statistics Canada. DOI: https://doi.org/10.25318/36280001202300200002-eng.
Statistics Canada. 2022. Investment, Productivity and Living Standards. Catalogue 11-631-X. Ottawa: Statistics Canada. Released September 1, 2022.
Statistics Canada. 2022. Research to Insights. Recent Economic and Social Developments. Catalogue 11-631-X. Ottawa: Statistics Canada. Released November 2, 2022.
Statistics Canada. 2023. Consumer Price Inflation, recent trends and analysis. Catalogue 11-631-X. Ottawa: Statistics Canada. Released February 22, 2023.
Statistics Canada. 2023. A look at Canada’s economy and society three years after the start of the COVID-19 pandemic. Catalogue 11-631-X. Ottawa: Statistics Canada. Released March 9, 2023.
- Date modified: