
Research to Insights: Investment, Productivity and Living Standards

Archived Content
Information identified as archived is provided for reference, research or recordkeeping purposes. It is not subject to the Government of Canada Web Standards and has not been altered or updated since it was archived. Please "contact us" to request a format other than those available.
Skip to text
Text begins
About Research to Insights
The Research to Insights series of presentations features a broad range of findings on selected topics of research. Each presentation will draw from and integrate evidence from many different studies that use innovative and high-quality data and methods to better understand relevant and complex policy issues.
Based on applied research of valuable data, the series is intended to provide decision makers, and Canadians more broadly, a comprehensive and horizontal view of the current social, economic and health issues we face in a changing world.
Context: What is productivity?
- Productivity is a measure of how efficiently businesses make use of their labour and capital in the production of products and services. This presentation focuses on labour productivity, a measure of efficiency widely used in conjunction with data on labour costs and profitability to gauge the competitiveness of Canadian businesses.
- Labour productivity rises if more real (or inflation adjusted) output can be produced per hour worked. It depends on (1) the amount and type of capital assets that are available to workers; (2) the skills that workers possess; and (3) a range of other efficiency-related factors, outside of those measured directly in capital and labour, that can affect the amount of output produced (these include technological progress, organizational changes and scale economies).
- The reallocation of productive resources across industries and firms also affects labour productivity for the economy as a whole. This process of reallocation can encompass structural effects when labour inputs are shifted across industries and when more productive firms displace less productive competitors.
Why is productivity important?
“Productivity growth is vital to non-inflationary growth and rising standards of living. At a time when inflation is already well above target, this is more vital than ever.”
Higher productivity leads to improvements in material well-being
- Over the last four decades, increases in labour productivity have been responsible for about 90% of the increase in Canada’s gross domestic product per capita.
- Historically, changes in labour productivity have closely tracked real wage growth.
Improving productivity will become increasingly important as the workforce continues to age
- Higher productivity will be required to sustain long-term improvements in living standards because of the structural impacts that population aging will have on Canada’s labour force. Nearly one in five workers will be approaching retirement age in the coming decade; further increases in the employment-to-population ratio are not expected (2021 Census).

Data table for chart 1
| GDP per capita | GDP per hour | Hours per employment | Employment per population | |
|---|---|---|---|---|
| index (1981 = 100) | ||||
| 1981 | 100.0 | 100.0 | 100.0 | 100.0 |
| 1982 | 95.7 | 101.4 | 98.6 | 95.7 |
| 1983 | 97.2 | 103.7 | 98.3 | 95.4 |
| 1984 | 102.0 | 106.5 | 98.8 | 96.9 |
| 1985 | 105.8 | 107.5 | 99.4 | 99.0 |
| 1986 | 107.0 | 106.6 | 99.4 | 101.0 |
| 1987 | 109.9 | 107.1 | 100.2 | 102.4 |
| 1988 | 113.3 | 108.2 | 100.5 | 104.1 |
| 1989 | 113.9 | 108.4 | 100.4 | 104.6 |
| 1990 | 112.3 | 108.4 | 99.9 | 103.8 |
| 1991 | 108.6 | 109.3 | 98.7 | 100.7 |
| 1992 | 108.3 | 111.4 | 98.7 | 98.5 |
| 1993 | 110.0 | 113.5 | 99.0 | 97.9 |
| 1994 | 113.7 | 115.4 | 99.6 | 98.9 |
| 1995 | 115.5 | 116.7 | 99.4 | 99.6 |
| 1996 | 116.2 | 116.5 | 100.2 | 99.5 |
| 1997 | 120.0 | 119.8 | 99.5 | 100.6 |
| 1998 | 123.6 | 122.0 | 99.1 | 102.3 |
| 1999 | 128.9 | 125.0 | 99.2 | 104.0 |
| 2000 | 134.4 | 129.0 | 98.6 | 105.6 |
| 2001 | 135.3 | 131.0 | 97.7 | 105.7 |
| 2002 | 137.9 | 133.2 | 96.7 | 107.1 |
| 2003 | 139.1 | 133.4 | 95.9 | 108.7 |
| 2004 | 142.1 | 134.5 | 96.5 | 109.4 |
| 2005 | 145.2 | 137.5 | 96.2 | 109.8 |
| 2006 | 147.6 | 139.1 | 96.1 | 110.4 |
| 2007 | 149.2 | 139.3 | 96.0 | 111.6 |
| 2008 | 149.0 | 138.8 | 95.9 | 112.0 |
| 2009 | 143.0 | 139.4 | 94.2 | 108.9 |
| 2010 | 145.8 | 140.9 | 94.8 | 109.2 |
| 2011 | 148.9 | 143.2 | 94.7 | 109.8 |
| 2012 | 149.9 | 143.7 | 95.0 | 109.8 |
| 2013 | 151.8 | 145.8 | 94.6 | 110.0 |
| 2014 | 154.6 | 149.8 | 94.3 | 109.5 |
| 2015 | 154.5 | 149.5 | 94.4 | 109.4 |
| 2016 | 154.3 | 150.1 | 94.4 | 108.9 |
| 2017 | 157.0 | 152.5 | 93.8 | 109.8 |
| 2018 | 159.1 | 153.0 | 94.6 | 110.0 |
| 2019 | 159.8 | 154.3 | 93.4 | 110.9 |
| 2020 | 149.7 | 165.6 | 87.0 | 103.9 |
| 2021 | 155.7 | 156.3 | 92.0 | 108.3 |
|
Note: GDP = gross domestic product. Sources: Common Output Data Repository tables 36-10-0207, 14-10-0022 and 17-10-0060. |
||||
What are the drivers of labour productivity?
-
Capital intensity is
driven by business investment in two types of capital:
- Tangible capital (e.g., buildings and structures, machinery and equipment, and information and communications technology)
- Intangible capital (e.g., software, research and development, and mineral exploration and evaluation).
- Labour quality reflects the skills composition of the workforce (and depends in part on changes in educational attainment over time).
- Multifactor productivity captures all other factors—including technological change, organizational change, capacity utilization and economies of scale—that can affect output growth.
| 1980 to 2000 | 2000 to 2010 | 2010 to 2019 | |
|---|---|---|---|
| Labour productivity growth (%) | 1.7 | 0.7 | 1.2 |
| Percentage point contribution from: | |||
| Capital intensity | 0.9 | 1.0 | 0.4 |
| Labour quality | 0.4 | 0.3 | 0.2 |
| Multifactor productivity | 0.5 | -0.6 | 0.6 |
Competition matters: Underneath this aggregate view of productivity are industries, firms and workers. As productive resources shift between industries and firms—and as less productive firms exit and more productive firms enter—aggregate productivity will also change.
Background: Productivity trends prior to COVID-19
- Canada’s productivity gap with the United States widened during the 1990s and 2000s. Slower productivity growth in Canada reflected, in part, lower spending on information and communications technology. This fueled productivity gains south of the border, especially in high-tech services.
- Canada’s productivity performance improved following the 2008/2009 recession as demand strengthened, especially for Canadian resources. Business investment, bolstered by large capital outlays in oil and gas extraction, and business investment in information and communications technology supported productivity growth during this period.
- Labour productivity growth slowed between 2015 and 2019 as the economy adjusted to lower oil prices. Just before the COVID-19 pandemic, non-residential business investment was about 20% below peak levels reported in late 2014.

Data table for chart 2
| Canada | United States | |
|---|---|---|
| index (Q1 1981 = 100) | ||
| 1981 | ||
| Q1 | 100.0 | 100.0 |
| Q2 | 100.3 | 99.1 |
| Q3 | 99.4 | 100.5 |
| Q4 | 100.0 | 99.3 |
| 1982 | ||
| Q1 | 100.3 | 98.9 |
| Q2 | 101.3 | 99.0 |
| Q3 | 102.6 | 99.0 |
| Q4 | 102.2 | 99.9 |
| 1983 | ||
| Q1 | 104.6 | 100.8 |
| Q2 | 104.9 | 102.5 |
| Q3 | 104.4 | 103.0 |
| Q4 | 106.3 | 103.9 |
| 1984 | ||
| Q1 | 108.1 | 104.4 |
| Q2 | 109.3 | 105.4 |
| Q3 | 108.3 | 105.9 |
| Q4 | 109.6 | 106.2 |
| 1985 | ||
| Q1 | 110.8 | 106.6 |
| Q2 | 109.9 | 107.1 |
| Q3 | 109.8 | 108.8 |
| Q4 | 110.2 | 109.2 |
| 1986 | ||
| Q1 | 108.9 | 110.2 |
| Q2 | 109.6 | 110.9 |
| Q3 | 109.8 | 111.5 |
| Q4 | 107.4 | 111.2 |
| 1987 | ||
| Q1 | 109.1 | 110.8 |
| Q2 | 109.0 | 111.5 |
| Q3 | 110.4 | 111.6 |
| Q4 | 110.4 | 112.6 |
| 1988 | ||
| Q1 | 111.5 | 112.9 |
| Q2 | 111.3 | 113.1 |
| Q3 | 110.9 | 113.4 |
| Q4 | 110.9 | 113.7 |
| 1989 | ||
| Q1 | 111.6 | 113.9 |
| Q2 | 111.4 | 114.5 |
| Q3 | 110.9 | 114.9 |
| Q4 | 110.9 | 115.0 |
| 1990 | ||
| Q1 | 111.6 | 116.2 |
| Q2 | 110.9 | 117.2 |
| Q3 | 110.2 | 117.7 |
| Q4 | 110.2 | 116.5 |
| 1991 | ||
| Q1 | 110.3 | 116.8 |
| Q2 | 110.8 | 118.7 |
| Q3 | 111.1 | 119.5 |
| Q4 | 111.2 | 120.2 |
| 1992 | ||
| Q1 | 112.1 | 122.9 |
| Q2 | 112.7 | 123.8 |
| Q3 | 113.9 | 124.9 |
| Q4 | 114.5 | 125.7 |
| 1993 | ||
| Q1 | 114.2 | 124.7 |
| Q2 | 115.2 | 124.1 |
| Q3 | 116.5 | 124.0 |
| Q4 | 116.1 | 124.9 |
| 1994 | ||
| Q1 | 117.9 | 125.2 |
| Q2 | 118.5 | 125.1 |
| Q3 | 118.3 | 124.5 |
| Q4 | 117.8 | 125.7 |
| 1995 | ||
| Q1 | 119.8 | 125.5 |
| Q2 | 119.7 | 125.9 |
| Q3 | 118.9 | 126.0 |
| Q4 | 119.0 | 126.8 |
| 1996 | ||
| Q1 | 118.0 | 127.8 |
| Q2 | 118.2 | 129.2 |
| Q3 | 118.3 | 129.7 |
| Q4 | 119.4 | 129.9 |
| 1997 | ||
| Q1 | 121.2 | 129.6 |
| Q2 | 122.1 | 131.6 |
| Q3 | 122.0 | 132.9 |
| Q4 | 122.4 | 133.6 |
| 1998 | ||
| Q1 | 125.3 | 134.8 |
| Q2 | 124.3 | 135.4 |
| Q3 | 124.7 | 137.3 |
| Q4 | 125.5 | 138.4 |
| 1999 | ||
| Q1 | 128.2 | 140.6 |
| Q2 | 127.6 | 141.1 |
| Q3 | 130.0 | 142.4 |
| Q4 | 130.0 | 144.3 |
| 2000 | ||
| Q1 | 132.7 | 143.9 |
| Q2 | 134.2 | 146.8 |
| Q3 | 135.4 | 146.8 |
| Q4 | 134.4 | 148.4 |
| 2001 | ||
| Q1 | 134.6 | 147.6 |
| Q2 | 136.0 | 150.0 |
| Q3 | 137.0 | 150.9 |
| Q4 | 138.6 | 152.9 |
| 2002 | ||
| Q1 | 139.2 | 155.6 |
| Q2 | 138.5 | 156.3 |
| Q3 | 138.9 | 157.6 |
| Q4 | 138.8 | 157.4 |
| 2003 | ||
| Q1 | 138.5 | 159.0 |
| Q2 | 139.5 | 161.6 |
| Q3 | 139.1 | 164.5 |
| Q4 | 138.3 | 165.8 |
| 2004 | ||
| Q1 | 138.0 | 166.1 |
| Q2 | 139.0 | 167.4 |
| Q3 | 140.7 | 168.2 |
| Q4 | 141.4 | 169.7 |
| 2005 | ||
| Q1 | 141.4 | 171.3 |
| Q2 | 142.1 | 170.7 |
| Q3 | 144.0 | 171.9 |
| Q4 | 145.0 | 172.3 |
| 2006 | ||
| Q1 | 145.7 | 173.7 |
| Q2 | 144.4 | 173.3 |
| Q3 | 144.9 | 172.6 |
| Q4 | 145.5 | 173.8 |
| 2007 | ||
| Q1 | 146.1 | 174.4 |
| Q2 | 146.0 | 175.0 |
| Q3 | 145.4 | 176.7 |
| Q4 | 144.1 | 177.8 |
| 2008 | ||
| Q1 | 143.5 | 176.8 |
| Q2 | 143.7 | 178.7 |
| Q3 | 145.5 | 179.0 |
| Q4 | 144.9 | 178.0 |
| 2009 | ||
| Q1 | 143.7 | 179.9 |
| Q2 | 144.1 | 183.5 |
| Q3 | 144.5 | 186.2 |
| Q4 | 146.1 | 189.1 |
| 2010 | ||
| Q1 | 145.7 | 190.0 |
| Q2 | 144.7 | 190.1 |
| Q3 | 146.3 | 191.3 |
| Q4 | 146.4 | 192.1 |
| 2011 | ||
| Q1 | 147.4 | 190.7 |
| Q2 | 147.5 | 190.8 |
| Q3 | 148.4 | 190.2 |
| Q4 | 149.8 | 191.5 |
| 2012 | ||
| Q1 | 149.3 | 192.2 |
| Q2 | 148.2 | 193.0 |
| Q3 | 147.9 | 192.8 |
| Q4 | 147.9 | 192.3 |
| 2013 | ||
| Q1 | 148.9 | 193.8 |
| Q2 | 149.8 | 193.5 |
| Q3 | 151.1 | 194.2 |
| Q4 | 153.0 | 195.4 |
| 2014 | ||
| Q1 | 152.5 | 193.6 |
| Q2 | 155.4 | 195.3 |
| Q3 | 157.0 | 196.6 |
| Q4 | 157.5 | 195.4 |
| 2015 | ||
| Q1 | 156.4 | 197.0 |
| Q2 | 154.3 | 197.7 |
| Q3 | 154.1 | 197.6 |
| Q4 | 154.1 | 196.8 |
| 2016 | ||
| Q1 | 154.2 | 197.5 |
| Q2 | 153.8 | 197.2 |
| Q3 | 156.1 | 198.0 |
| Q4 | 156.1 | 199.6 |
| 2017 | ||
| Q1 | 158.0 | 199.5 |
| Q2 | 158.2 | 199.1 |
| Q3 | 157.2 | 200.9 |
| Q4 | 157.6 | 201.7 |
| 2018 | ||
| Q1 | 157.5 | 202.5 |
| Q2 | 158.8 | 203.5 |
| Q3 | 159.3 | 203.9 |
| Q4 | 159.0 | 204.0 |
| 2019 | ||
| Q1 | 159.2 | 205.6 |
| Q2 | 159.3 | 207.5 |
| Q3 | 160.1 | 208.0 |
| Q4 | 160.7 | 208.7 |
| 2020 | ||
| Q1 | 166.6 | 207.8 |
| Q2 | 187.7 | 212.4 |
| Q3 | 169.7 | 216.2 |
| Q4 | 166.9 | 214.3 |
| 2021 | ||
| Q1 | 162.8 | 215.5 |
| Q2 | 161.6 | 217.3 |
| Q3 | 159.6 | 215.2 |
| Q4 | 158.8 | 218.5 |
| Sources: Statistics Canada, table 36-10-0206-01; and U.S. Bureau of Labor Statistics. | ||
COVID-19: Early productivity gains dissipate as employment and hours worked recover
- Large increases in aggregate productivity early in the pandemic reflected large reductions in hours worked in non-essential businesses that were heavily impacted by lockdown measures.
- The overall shift in hours worked away from non-essential activities (where productivity is generally lower) to essential activities (where productivity is higher) resulted in higher productivity for the economy as a whole.
- These structural effects dissipated in 2021 as non-essential businesses ramped up. Productivity fell as the number of hours worked rebounded more quickly than output.
- Labour productivity has declined for seven consecutive quarters. Aggregate productivity in the first quarter of 2021 was 1.3% below pre-pandemic levels.

Data table for chart 3
| Labour productivity measures and related measures | Real gross domestic product | Hours worked | Labour productivity |
|---|---|---|---|
| percent | |||
| 2019 | |||
| Q4 | 0.3 | -0.1 | 0.4 |
| 2020 | |||
| Q1 | -2.7 | -6.2 | 3.7 |
| Q2 | -13.5 | -23.2 | 12.6 |
| Q3 | 10.9 | 22.7 | -9.6 |
| Q4 | 2.5 | 4.2 | -1.6 |
| 2021 | |||
| Q1 | 1.1 | 3.6 | -2.4 |
| Q2 | -1.3 | -0.9 | -0.5 |
| Q3 | 1.3 | 2.4 | -1.1 |
| Q4 | 2.0 | 2.6 | -0.6 |
| 2022 | |||
| Q1 | 0.9 | 1.4 | -0.5 |
| Source: Statistics Canada, table 36-10-0206-01. | |||
Growing pressures on cost competitiveness: In early 2022, unit labour costs, which measure the payments to labour required to produce a unit of output, were over 12% above pre-pandemic levels. Worker compensation has outpaced productivity gains over the course of the pandemic.
End of text boxCOVID-19: Productivity impacts differ across sectors as businesses continue to adjust
Technology-intensive sectors more resilient
- Industries that rely more heavily on technology-based services were more resilient during the pandemic. Higher digital intensity in finance and wholesale trade contributed to productivity gains, while the rapid recovery in retail volumes reflected the rapid transition to digital-based platforms.
Productivity impacts obscured by strong labour demand
- Labour productivity in professional, scientific and technical services in early 2022 remained 5% below pre-pandemic levels as large increases in hours worked have outpaced output gains. This sector has added over 200,000 payroll jobs (+15%) since the start of the pandemic.

Data table for chart 4
| Industry | Net Productivity Growth |
|---|---|
| percent | |
| Arts, entertainment and recreation | -22.6 |
| Administrative and support, waste management and remediation services | -13.2 |
| Transportation and warehousing | -12.2 |
| Information and cultural industries | -5.7 |
| Professional, scientific and technical services | -5.1 |
| Accommodation and food services | -2.2 |
| Mining and oil and gas extraction | -1.8 |
| Manufacturing | -1.5 |
| Business sector | -1.3 |
| Construction | -0.9 |
| Real estate and rental and leasing | 0.7 |
| Non-business sector and others | 1.1 |
| Other business services | 1.7 |
| Utilities | 1.9 |
| Finance and insurance, and holding companies | 2.3 |
| Wholesale trade | 4.4 |
| Retail trade | 8.5 |
| Agriculture, forestry, fishing and hunting | 10.5 |
| Sources: Statistics Canada, tables 36-10-0206-01 and 36-10-0207-01. | |
Competitive turnover may be impacting productivity growth within many industries: Relatively more lower-productivity businesses closed during COVID-19 than during the 2008/2009 recession.
End of text boxSustained productivity gains in the coming years will need to be fuelled by new business investment
“As we emerge from the COVID-19 pandemic, Canada has the opportunity to make long overdue gains in productivity. In the years ahead, business investment decisions will determine the path of Canada’s productivity growth.”
Before COVID-19, lower business investment in productivity-enhancing assets weighed on productivity growth
- Overall business spending on structures and machinery and equipment has trended lower since oil prices fell sharply in the mid-2010s. These outlays have also been slow to recover from COVID-19.
- In early 2022, real outlays on non-residential structures and machinery and equipment were 4% below pre-COVID-19 levels and 22% below peak levels in 2014.
- Real spending on research and development was 8% below pre-pandemic levels and 11% below levels reported in 2014.

Data table for chart 5
| Non-residential structures | Machinery and equipment | Intellectual property products | |
|---|---|---|---|
| index (Q1 2007 = 100) | |||
| 2007 | |||
| Q1 | 100.0 | 100.0 | 100.0 |
| Q2 | 99.8 | 101.2 | 100.7 |
| Q3 | 100.2 | 101.6 | 102.1 |
| Q4 | 100.5 | 105.0 | 104.5 |
| 2008 | |||
| Q1 | 107.2 | 105.4 | 107.6 |
| Q2 | 108.7 | 104.1 | 107.6 |
| Q3 | 109.3 | 103.3 | 105.8 |
| Q4 | 106.6 | 95.3 | 100.1 |
| 2009 | |||
| Q1 | 91.8 | 79.1 | 88.0 |
| Q2 | 85.7 | 77.9 | 85.4 |
| Q3 | 84.9 | 80.3 | 85.6 |
| Q4 | 85.7 | 84.3 | 87.7 |
| 2010 | |||
| Q1 | 93.9 | 84.9 | 91.8 |
| Q2 | 98.6 | 88.8 | 95.6 |
| Q3 | 104.7 | 89.2 | 97.6 |
| Q4 | 111.2 | 92.1 | 97.7 |
| 2011 | |||
| Q1 | 115.5 | 93.3 | 95.6 |
| Q2 | 114.6 | 100.2 | 101.0 |
| Q3 | 119.5 | 95.0 | 104.0 |
| Q4 | 124.0 | 96.5 | 104.1 |
| 2012 | |||
| Q1 | 127.3 | 98.3 | 104.5 |
| Q2 | 133.1 | 99.1 | 99.7 |
| Q3 | 133.7 | 99.0 | 100.8 |
| Q4 | 138.1 | 99.1 | 99.9 |
| 2013 | |||
| Q1 | 141.5 | 99.7 | 101.5 |
| Q2 | 143.7 | 99.8 | 99.1 |
| Q3 | 146.6 | 97.8 | 99.7 |
| Q4 | 147.8 | 100.4 | 99.9 |
| 2014 | |||
| Q1 | 151.5 | 98.7 | 101.5 |
| Q2 | 152.6 | 100.1 | 100.0 |
| Q3 | 154.5 | 101.9 | 99.4 |
| Q4 | 157.3 | 104.1 | 102.5 |
| 2015 | |||
| Q1 | 141.8 | 98.1 | 94.3 |
| Q2 | 135.1 | 95.1 | 88.6 |
| Q3 | 128.9 | 93.1 | 86.6 |
| Q4 | 124.0 | 92.8 | 87.6 |
| 2016 | |||
| Q1 | 118.7 | 84.4 | 88.2 |
| Q2 | 114.1 | 86.3 | 88.8 |
| Q3 | 121.4 | 80.1 | 87.2 |
| Q4 | 113.1 | 78.8 | 86.7 |
| 2017 | |||
| Q1 | 113.0 | 85.9 | 92.2 |
| Q2 | 114.4 | 87.6 | 95.5 |
| Q3 | 116.1 | 86.6 | 98.5 |
| Q4 | 117.9 | 94.1 | 95.5 |
| 2018 | |||
| Q1 | 117.0 | 94.5 | 105.8 |
| Q2 | 117.4 | 97.9 | 107.7 |
| Q3 | 116.7 | 93.8 | 106.1 |
| Q4 | 115.7 | 94.3 | 109.6 |
| 2019 | |||
| Q1 | 119.3 | 102.8 | 104.8 |
| Q2 | 119.9 | 95.5 | 104.0 |
| Q3 | 123.0 | 94.2 | 105.4 |
| Q4 | 124.1 | 88.1 | 105.4 |
| 2020 | |||
| Q1 | 125.3 | 87.0 | 106.7 |
| Q2 | 105.9 | 67.1 | 97.2 |
| Q3 | 104.2 | 81.5 | 100.4 |
| Q4 | 102.0 | 86.7 | 101.6 |
| 2021 | |||
| Q1 | 105.8 | 81.6 | 103.1 |
| Q2 | 108.2 | 87.2 | 103.3 |
| Q3 | 109.2 | 87.1 | 101.2 |
| Q4 | 112.8 | 87.9 | 100.6 |
| 2022 | |||
| Q1 | 116.1 | 88.7 | 100.0 |
| Source: Statistics Canada, table 36-10-0108-01. | |||
What type of investment will spur productivity growth? High-tech services are leading the adoption of digital technologies
Companies have been changing how information and communications technology (ICT) inputs are being integrated into their production systems. Over the last decade, spending on ICT services as intermediate inputs, possibly linked to cloud computing and other advances in data management, has risen at a faster pace than traditional outlays on ICT capital.
End of text box- In early 2022, about one in five companies reported that they plan to increase spending on new or additional digital technologies in the next 12 months.
- High-tech service
industries are leading the way.
- Over 40% of businesses in information and cultural industries, along with 38% in professional, scientific and technical services, intend to purchase new or additional digital technologies.
- About one-quarter of manufacturers intend to do so.
Key questions: How widespread are the employment and income gains associated with advances in digital technology? To what extent will these benefit higher- and lower-skilled workers?

Data table for chart 6
| Industries | Rate |
|---|---|
| percent | |
| Information and cultural industries | 42.0 |
| Professional, scientific and technical services | 37.4 |
| Finance and insurance | 33.7 |
| Wholesale trade | 31.6 |
| Manufacturing | 27.0 |
| Arts, entertainment and recreation | 25.0 |
| Health care and social assistance | 22.8 |
| All industries | 21.9 |
| Retail trade | 20.7 |
| Other services (except public administration) | 18.4 |
| Real estate and rental and leasing | 18.0 |
| Accommodation and food services | 17.0 |
| Transportation and warehousing | 16.5 |
| Agriculture, forestry, fishing and hunting | 14.6 |
| Mining, quarrying, and oil and gas extraction | 12.7 |
| Administrative and support services | 12.7 |
| Construction | 11.1 |
|
Notes: Data are from the Canadian Survey on Business Conditions, first quarter of 2022. Administrative and support services also includes waste management and remediation services. Source: Statistics Canada, table 33-10-0487-01. |
|
Supply chain disruptions are likely to impact productivity growth in the near term
Logistical challenges continue to mount
- 4 in 10 businesses anticipate transportation costs to be a barrier in the coming months (second quarter, 2022).
- Challenges
related to supply chains have grown steadily since mid-2021. Over
one-quarter of businesses anticipate difficulties in acquiring inputs,
products or supplies domestically.
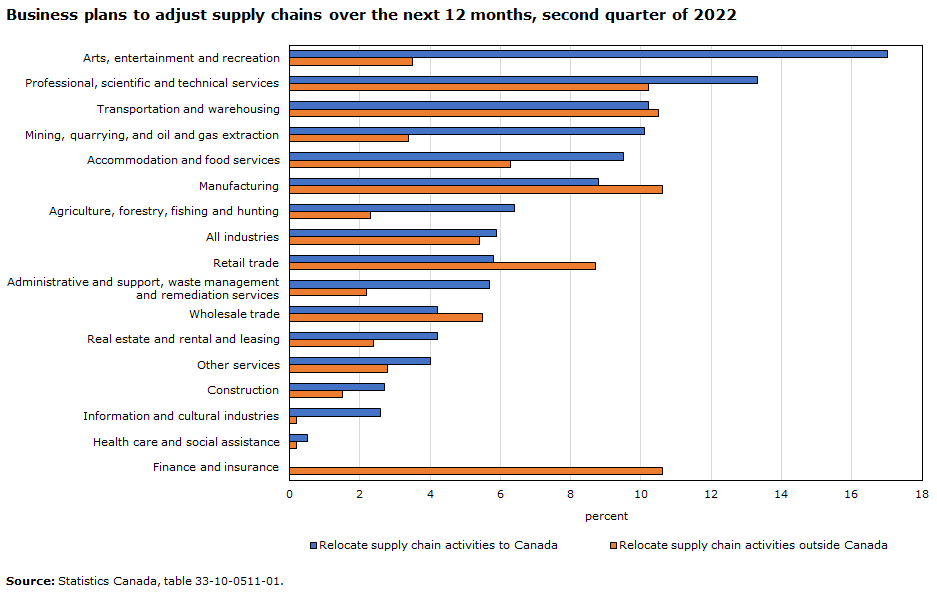
- Over two-thirds of these businesses expecting supply chain challenges reported that these challenges have worsened in recent months, and more than half expect these disruptions to continue for six months or more.
- About 1 in 20 businesses expecting supply chain challenges plan to relocate supply chain activities to Canada over the next year, while a similar number plan to relocate activities outside Canada.
Data table for chart 7
| Relocate supply chain activities to Canada | Relocate supply chain activities outside Canada | |
|---|---|---|
| percent | ||
| Arts, entertainment and recreation | 17.0 | 3.5 |
| Professional, scientific and technical services | 13.3 | 10.2 |
| Transportation and warehousing | 10.2 | 10.5 |
| Mining, quarrying, and oil and gas extraction | 10.1 | 3.4 |
| Accommodation and food services | 9.5 | 6.3 |
| Manufacturing | 8.8 | 10.6 |
| Agriculture, forestry, fishing and hunting | 6.4 | 2.3 |
| All industries | 5.9 | 5.4 |
| Retail trade | 5.8 | 8.7 |
| Administrative and support, waste management and remediation services | 5.7 | 2.2 |
| Wholesale trade | 4.2 | 5.5 |
| Real estate and rental and leasing | 4.2 | 2.4 |
| Other services | 4.0 | 2.8 |
| Construction | 2.7 | 1.5 |
| Information and cultural industries | 2.6 | 0.2 |
| Health care and social assistance | 0.5 | 0.2 |
| Finance and insurance | 0.0 | 10.6 |
| Source: Statistics Canada, table 33-10-0511-01. | ||
Relocation of supply chains may have deeper impacts on productivity in trade-oriented sectors such as manufacturing
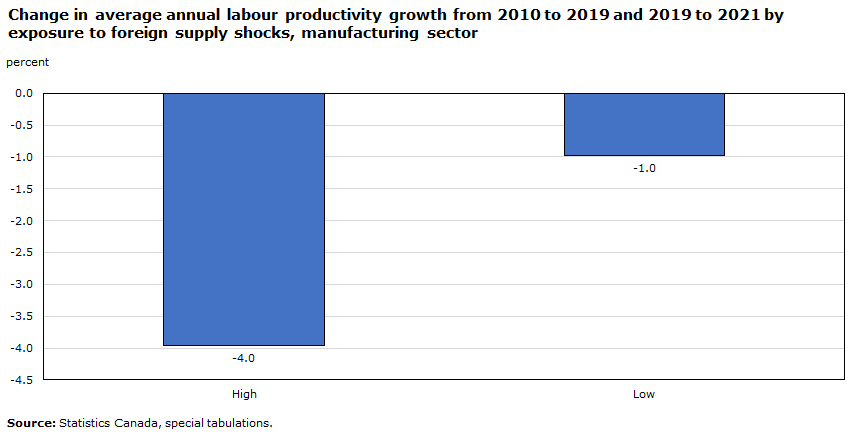
Labour productivity in the manufacturing sector was more impacted by pandemic-related disruptions
- Manufacturing industries with more exposure to foreign supply shocks (whose production depends more on imported intermediate inputs) experienced a larger decline in labour productivity over the course of the pandemic.
- If productivity growth in manufacturing had maintained its pre-pandemic trend, overall business sector productivity during the first two years of the pandemic would have been about 0.3 percentage points higher.
Given foreign exposure, reshoring supply chains may have direct impacts on productivity
- Over three-quarters of Canadian manufacturers rely on imported goods or services, 90% of whom use these inputs in the production of other goods and services in Canada. Imports can enhance firm productivity by allowing Canadian firms to access foreign inputs and technologies that are unavailable or more expensive domestically. Reshoring efforts that are intended to shorten supply chains to limit exposure to external shocks may come at a cost to productivity.
Data table for chart 8
| Exposure to foreign supply shocks | |
|---|---|
| percent | |
| High | -4.0 |
| Low | -1.0 |
| Source: Statistics Canada, special tabulations. | |
Cross-border activity facilitates access to innovation and technology that are essential for productivity growth
Exposure to foreign markets and improvements in productivity go hand in hand
- Industries that are heavily exposed to external supply chain shocks, such as manufacturing and oil and gas extraction, are often those that bring innovative technologies to domestic producers through cross-border trade and foreign direct investment. These cross-border linkages are important sources of productivity growth.
- Statistics Canada research has shown that exporters are 37% more likely to use foreign technologies than non-exporters. Firms that begin to export are also more likely to begin conducting research and development and to collaborate on research and development with foreign buyers.
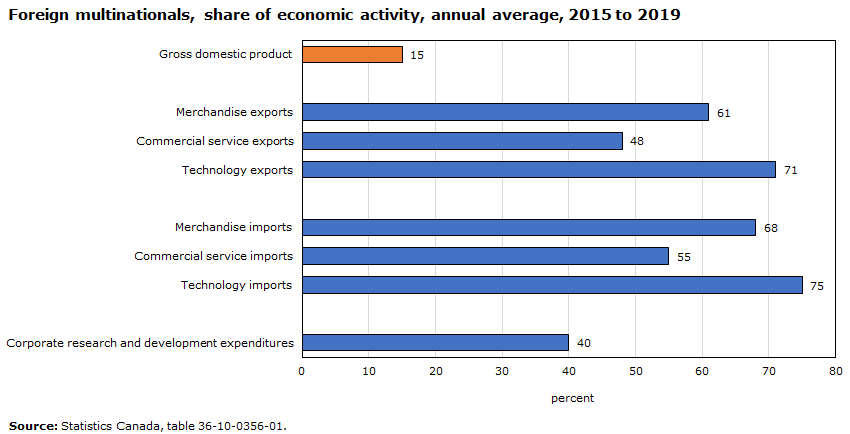
Foreign multinationals remain important conduits for innovation and technology transfer
While foreign multinationals account for 15% of Canada’s economic output, they account for almost two-thirds of Canada’s merchandise trade, and over 70% of cross-border trade in technical knowledge and technology-based services. Canada’s trade in commercial services has grown significantly since 2010, pointing to new opportunities.
Data table for chart 9
| Percent | |
|---|---|
| Gross domestic product | 15 |
| Merchandise exports | 61 |
| Commercial service exports | 48 |
| Technology exports | 71 |
| Merchandise imports | 68 |
| Commercial service imports | 55 |
| Technology imports | 75 |
| Corporate research and development expenditures | 40 |
| Source: Statistics Canada, table 36-10-0356-01. | |
Takeaways
Raising labour productivity will be increasingly important for improving living standards
- With one-fifth of working Canadians nearing retirement age in the coming decade, higher productivity will be needed to offset the impact of the aging population on Canada’s workforce. Higher productivity will also be essential for sustaining real wage growth and enhancing the productive capacity of Canadian industry.
As the disruptive impacts of the COVID-19 pandemic fade, sustained productivity gains will need to be led by business investment
- Non-residential investment has been slow to recover from the COVID-19 pandemic and remains well below peak levels observed in 2014 when large capital outlays in the energy sector fueled productivity growth and income gains. As energy investment decouples from oil prices, other sectors of the economy will need to emerge as key investment drivers.
- The widespread adoption of digital services, accelerated by the pandemic, may provide an important source of productivity growth akin to the integration of information and communications technology in the 1990s. In early 2022, about one in five businesses was planning to increase spending on this technology over the next year.
Reshoring may come at a cost to productivity, while cross-border linkages that facilitate innovation and technology transfer may be the key to productivity gains over the longer term
- Persistent logistical challenges and escalating input costs may adversely impact productivity in the near term as companies adjust supply chains; productivity gains over the longer term will depend in part on maintaining access to globally competitive technologies.
- Date modified: