
Research to Insights: Recent Economic and Social Developments

Archived Content
Information identified as archived is provided for reference, research or recordkeeping purposes. It is not subject to the Government of Canada Web Standards and has not been altered or updated since it was archived. Please "contact us" to request a format other than those available.
Skip to text
Text begins
About Research to Insights
The Research to Insights series of presentations features a broad range of findings on selected research topics. Each presentation draws from and integrates evidence from various studies that use innovative and high-quality data and methods to better understand relevant and complex policy issues.
Based on applied research of valuable data, the series is intended to provide decision makers, and Canadians more broadly, a comprehensive and horizontal view of the current economic, social and health issues we face in a changing world.
Context: After a robust economic recovery, pressure points emerge
- Economic activity slows as borrowing costs rise to rein in inflation.
- Labour market imbalances persist despite robust job gains.
- Population aging weighs steadily on labour force participation.
- Household balance sheets remain healthy, but affordability pressures mount.
- Purchasing power falls as wage gains lag rising consumer prices.
- Business productivity lags as supply disruptions persist and capital outlays slow to recover.
- Challenges to social cohesion remain as public health measures are lifted.
- Mental health impacts persist, especially among young Canadians.
Economic resilience
Steady growth: Economic activity has expanded in 12 of the last 14 months, fuelled by strong goods production and a robust recovery in client-facing services.
- Economy-wide output expanded by 4.3% in the 12 months to July 2022.
Solid job recovery: Total employment has risen by almost 1 million since tighter public health restrictions during the pandemic’s third wave were eased in the spring of 2021. As of September 2022, employment was 404,000 above pre-pandemic levels.
- The unemployment rate was at a record low of 4.9% in June and July 2022.
Business optimism: Despite ongoing pressure from rising input costs, labour-related obstacles and supply disruptions, over two-thirds of businesses are either somewhat or very optimistic about their outlook over the next 12 months. Nearly three-quarters of businesses expect positive average yearly growth over the next three years.

Data table
| Employment | Real gross domestic product | |
|---|---|---|
| percent change, year over year | ||
| 2019 | ||
| January | 2.10 | 2.24 |
| February | 2.26 | 1.64 |
| March | 1.87 | 1.94 |
| April | 2.54 | 2.26 |
| May | 2.77 | 1.97 |
| June | 2.46 | 2.05 |
| July | 1.94 | 1.76 |
| August | 2.55 | 1.56 |
| September | 2.44 | 1.59 |
| October | 2.32 | 1.45 |
| November | 1.38 | 1.63 |
| December | 1.82 | 1.93 |
| 2020 | ||
| January | 1.56 | 1.99 |
| February | 1.42 | 2.43 |
| March | -3.87 | -5.73 |
| April | -14.89 | -16.31 |
| May | -13.35 | -12.77 |
| June | -8.41 | -7.92 |
| July | -6.14 | -5.53 |
| August | -5.42 | -4.61 |
| September | -3.65 | -3.86 |
| October | -3.12 | -3.43 |
| November | -2.55 | -2.78 |
| December | -3.09 | -3.06 |
| 2021 | ||
| January | -4.35 | -2.84 |
| February | -3.06 | -2.80 |
| March | 3.88 | 6.15 |
| April | 15.42 | 17.84 |
| May | 12.86 | 12.20 |
| June | 8.06 | 7.07 |
| July | 6.05 | 4.81 |
| August | 5.30 | 4.41 |
| September | 4.05 | 3.76 |
| October | 3.65 | 4.06 |
| November | 4.22 | 3.86 |
| December | 4.77 | 3.97 |
| 2022 | ||
| January | 4.87 | 3.49 |
| February | 5.14 | 4.05 |
| March | 3.99 | 3.59 |
| April | 5.18 | 4.98 |
| May | 5.68 | 5.50 |
| June | 4.24 | 4.64 |
| July | 3.64 | 4.27 |
| August | 3.06 | Note ...: not applicable |
| September | 2.23 | Note ...: not applicable |
| Sources: Statistics Canada, tables 36-10-0434-01 and 14-10-0287-01. | ||
For more information: Canadian Survey on Business Conditions, third quarter 2022.
Broad-based momentum across industrial sectors as economic activity ramps up
Economic activity in client-facing service industries rose swiftly after Omicron-related restrictions were relaxed in early 2022.
- Activity in accommodation and food services rebounded to pre-COVID-19 levels in June, while arts, entertainment and recreation advanced steadily toward midyear. Air transportation and urban transit posted sizable gains through the spring.
Mining, quarrying and oil and gas extraction bolstered economy-wide output in the second quarter as production rebounded from disruptions and maintenance activities early in the year.
Supply chain challenges: Over 2,300 plants were affected by raw material shortages in the first half of 2022, almost three times as many as during the first six months of 2019.
Output at auto assembly plants was about one-third below pre-pandemic levels in mid-2022.
Impact of higher borrowing costs: Output growth slowed during the spring as activity scaled back in industries that are sensitive to interest rate changes. Real estate agents and brokers and construction have posted sizable declines as lending rates have risen.

Data table
| Mining, quarrying, oil and gas extraction | Manufacturing | Retail trade | Accommodation and food services | |
|---|---|---|---|---|
| index | ||||
| 2020 | ||||
| February | 100.00 | 100.00 | 100.00 | 100.00 |
| March | 96.53 | 91.19 | 88.57 | 64.86 |
| April | 88.32 | 72.64 | 70.53 | 36.82 |
| May | 88.74 | 79.88 | 84.04 | 44.50 |
| June | 84.12 | 89.30 | 98.94 | 57.56 |
| July | 85.40 | 93.34 | 98.74 | 66.93 |
| August | 83.89 | 94.60 | 98.69 | 72.53 |
| September | 87.69 | 95.56 | 101.65 | 72.71 |
| October | 88.26 | 95.19 | 103.63 | 67.08 |
| November | 91.15 | 97.21 | 104.76 | 67.20 |
| December | 94.61 | 96.54 | 99.13 | 60.30 |
| 2021 | ||||
| January | 95.69 | 97.28 | 97.34 | 61.22 |
| February | 94.65 | 95.40 | 103.30 | 65.20 |
| March | 94.53 | 97.10 | 108.30 | 73.58 |
| April | 93.30 | 95.37 | 100.17 | 66.45 |
| May | 93.46 | 94.47 | 96.97 | 63.86 |
| June | 95.04 | 96.39 | 102.59 | 74.57 |
| July | 97.76 | 95.42 | 102.57 | 83.76 |
| August | 97.68 | 95.77 | 104.14 | 89.31 |
| September | 99.52 | 94.39 | 103.63 | 87.69 |
| October | 101.55 | 96.44 | 104.51 | 87.49 |
| November | 98.26 | 97.70 | 104.77 | 89.44 |
| December | 97.36 | 98.60 | 102.03 | 87.82 |
| 2022 | ||||
| January | 95.15 | 98.87 | 105.02 | 76.55 |
| February | 97.58 | 99.39 | 104.65 | 87.35 |
| March | 98.70 | 101.03 | 104.64 | 96.85 |
| April | 101.87 | 100.94 | 105.34 | 97.90 |
| May | 101.87 | 99.38 | 105.91 | 99.31 |
| June | 101.74 | 99.79 | 105.87 | 100.43 |
| July | 103.63 | 99.30 | 103.90 | 99.46 |
| Source: Statistics Canada, table 36-10-0434-01. | ||||
For more information: Trends in manufacturing resulting from the COVID-19 pandemic and supply chain disruptions.
Employment growth dominated by professional services and occupations that typically require university education
The portion of core-age workers now working is well above pre-pandemic levels. Vulnerable population groups, including many racialized communities, have seen robust job gains over the past year.
Growth in the number of public sector employees (+390,000) reflects increases in health care and social assistance, public administration, and educational services.
In private sector industries, large net increases in professional, scientific and technical services (+274 ,000) and finance and real estate industries (+149,000) have been partly offset by declines in accommodation and food services (-142,000). Self-employment also remains well below pre-pandemic levels.
Net employment gains since the onset of the pandemic have been fully concentrated in occupations that usually require university education (+700,000).
Employment losses in mid-2022: From May to September, employment has fallen by 92,000, reflecting declines in wholesale and retail trade, educational services, and Information, cultural and recreational industries. Almost all net losses from May to September were among women.

Data table
| Public | Private | Self Employed | |
|---|---|---|---|
| thousands of persons | |||
| Public administration | 110.8 | Note x: suppressed to meet the confidentiality requirements of the Statistics Act | Note x: suppressed to meet the confidentiality requirements of the Statistics Act |
| Accommodation and food services | -0.2 | -141.6 | -23.7 |
| Information, culture and recreation | -12.7 | 72.1 | 4.2 |
| Health care and social assistance | 136.8 | -18.1 | -36.0 |
| Educational services | 102.3 | 18.6 | -14.8 |
| Professional, scientific and technical services | 4.5 | 273.8 | -6.0 |
| Finance, insurance, real estate, rental and leasing | -6.4 | 149.1 | -22.9 |
| Transportation and warehousing | 30.0 | -62.6 | -26.5 |
| Wholesale and retail trade | 2.3 | 86.2 | -19.5 |
| Manufacturing | 1.2 | -15.3 | -12.7 |
| Construction | 4.5 | 63.0 | -51.6 |
|
Note: Data are unadjusted for seasonality. Source: Statistics Canada, Table 14-10-0026-01. |
|||
For more information: Labour Force Survey, August 2022.
Labour market imbalances persist as businesses continue to adjust
Vacancies continue to increase despite rising payrolls: Job vacancies approached the 1 million mark in the second quarter of 2022, as the job vacancy rate reached a record high (+5.7%). Payroll employment grew by 258,000 on broad-based gains across industries.
- The ratio of unemployed individuals to job vacancies declined to a record low of 1.0 in June, down from 1.9% in June of last year. In the second quarter, 44 employees were hired for every 100 job vacancies.
- Offered hourly wages, measured year over year, were up by 5.3%. Service representatives and other customer and personal service occupations had the largest increase (+12.0%) in offered wages.
Impacts of labour-related obstacles: Nearly 4 in 10 businesses in the second quarter reported that labour-related obstacles would limit the business’s growth, with a similar percentage anticipating that they would hire less suitable candidates.
Businesses upskill: About one-quarter of businesses that expect labour shortages plan to provide training to employees to take other positions within the business.

Data table
| Unemployment-to-job-vacancy ratio | |
|---|---|
| ratio | |
| 2020 | |
| October | 2.7 |
| November | 2.9 |
| December | 3.4 |
| 2021 | |
| January | 3.9 |
| February | 3.2 |
| March | 2.6 |
| April | 2.4 |
| May | 2.4 |
| June | 1.9 |
| July | 1.9 |
| August | 1.8 |
| September | 1.3 |
| October | 1.3 |
| November | 1.3 |
| December | 1.2 |
| 2022 | |
| January | 1.6 |
| February | 1.4 |
| March | 1.2 |
| April | 1.1 |
| May | 1.1 |
| June | 1.0 |
| Source: Statistics Canada, Job Vacancy and Wage Survey, special tabulations. | |
For more information: Canadian Survey on Business Conditions, second quarter 2022.
Population aging is an important factor in explaining current labour shortages
While current economic conditions play an important role, labour supply is increasingly influenced by population aging and changes in the age structure of the workforce over time. More than one in five working-age Canadians are approaching retirement age.
- Since the onset of the pandemic, the working-age population has increased by about 900,000 individuals. About two-thirds of that increase is accounted for by workers who are now 55 years of age and older.
- Population change during this period has been driven by more elderly Canadians with much lower labour force participation rates. Participation rates for specific age groups are very similar to their pre-pandemic baselines.
In August 2022, there were 307,000 Canadians who had left their job to retire at some point in the last year, up from 233,000 one year earlier and from 273,000 in August 2019.
Limits on labour force growth: If the contribution of each age group to the total population had stayed constant over the past three years, there would have been 374,000 more people in the labour force than there are currently.

Data table
| Participation rate, August 2019 | Participation rate, August 2022 | Population change from August 2019 - August 2022 | |
|---|---|---|---|
| percent | thousands | ||
| 15-19 years | 61.4 | 60.8 | 23.1 |
| 20-24 years | 83.6 | 81.2 | -34.1 |
| 25-29 years | 87.4 | 88.1 | 5.2 |
| 30-34 years | 86.9 | 88.7 | 167.7 |
| 35-39 years | 87.1 | 88.7 | 118.1 |
| 40-44 years | 88.4 | 89.3 | 143.5 |
| 45-49 years | 88.9 | 89.4 | -6.6 |
| 50-54 years | 86.7 | 86.7 | -77.0 |
| 55-59 years | 75.2 | 75.6 | -131.3 |
| 60-64 years | 56.3 | 56.5 | 120.2 |
| 65-69 years | 28.0 | 27.3 | 206.0 |
| 70 years and over | 7.8 | 8.0 | 533.1 |
| Source: Statistics Canada, Labour Force Survey, special tabulations. | |||
For more information: Labour Force Survey, August 2022.
An increasingly diverse workforce as immigration fuels population growth
Immigration is projected to remain the main driver of population growth over the coming decades, continuing a trend that began in the early 1990s.
- By 2041, immigrants could account for between 29.1% and 34.0% of Canada’s population, up from 23.0% in 2021. Half of the population will be made up of immigrants and their Canadian-born children.
- According to the 2021 census of population, close to two-thirds of recent immigrants are of core working age.
- From 2016 to 2041, the average annual growth rate of Canada’s racialized population is projected to range from 2.9% to 4.2%, well above the projected rate for the population as a whole (between 0.7% and 1.5%).
While the economic outcomes of recent immigrants improved in the years leading up to the pandemic, longstanding challenges related to skill utilization may still pose barriers.
- From 2001 to 2016, the percentage of university-educated recent immigrants in high-skilled jobs decreased from 46% to 38%.
Immigration is already the driving force of change in Canada’s labour market: In the 2010s, immigrant workers accounted for 84% of the growth in the total labour force, 55% of the growth in high- and medium-skilled jobs, and offset the decline in lower-skilled jobs among Canadian-born workers.

Data table
| Estimated in 2016 | Projected in 2041 (reference scenario) | Mininum | Maximum | |
|---|---|---|---|---|
| millions | ||||
| Other racialized groups ‡ | 0.4 | 0.8 | 734,000 | 938,000 |
| Japanese | 0.1 | 0.2 | 149,000 | 195,000 |
| Korean | 0.2 | 0.5 | 396,000 | 562,000 |
| Southeast Asian | 0.3 | 0.6 | 506,000 | 648,000 |
| West Asian | 0.3 | 0.9 | 699,000 | 990,000 |
| Latin American | 0.5 | 1.0 | 870,000 | 1,189,000 |
| Arab | 0.5 | 1.6 | 1,352,000 | 1,872,000 |
| Filipino | 0.8 | 2.1 | 1,724,000 | 2,375,000 |
| Black | 1.2 | 3.1 | 2,654,000 | 3,565,000 |
| Chinese | 1.7 | 3.1 | 2,616,000 | 3,505,000 |
| South Asian | 2.0 | 5.7 | 4,722,000 | 6,474,000 |
|
‡The category "Other racialized groups" includes people who belong to more than one racialized group or who belong to a racialized group not included elsewhere. Note: The error bars correspond to the minimum and maximum values projected by all 11 scenarios considered. Sources: 2016 Census (adjusted) (3901) and Population projections on immigration and diversity for Canada and its regions, 2016 to 2041 (5126). |
||||
For more information: Research to Insights: Immigration as a Source of Labour Supply.
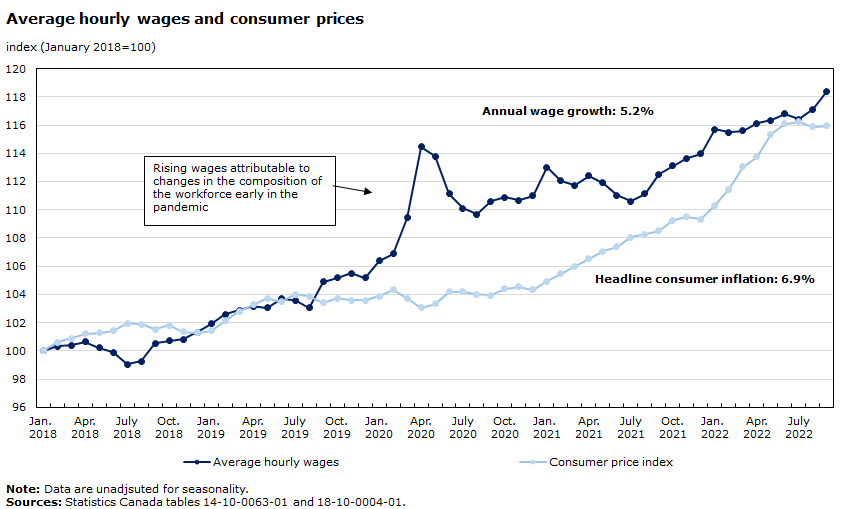
Wage growth strengthens as economic activity ramps up
Mounting wage pressures: In early 2022, offered wages associated with vacancies in certain sectors were lower than workers were willing to accept, particularly in retail trade (offered wages were 22.4% lower), accommodation and food services (15.8% lower), and construction (7.0% lower).
The growth in mean wages expected in 2022 averages 6.1% among businesses anticipating labour shortages in the short term.
Wages have been rising faster for non-unionized employees. Three in 10 employees are covered by a collective bargaining agreement.
Rising job change intentions: While overall rates of labour turnover have remained stable, the number of Canadians who are considering a job change is on the rise. In August 2022, about 12% of permanent employees reported that they are planning to leave their job within the next 12 months, almost double the level recorded in January 2022.
Data table
| Average hourly wages | Consumer price index | |
|---|---|---|
| index | ||
| 2018 | ||
| January | 100.00 | 100.00 |
| February | 100.34 | 100.61 |
| March | 100.41 | 100.91 |
| April | 100.64 | 101.21 |
| May | 100.22 | 101.29 |
| June | 99.89 | 101.44 |
| July | 99.07 | 101.97 |
| August | 99.25 | 101.90 |
| September | 100.52 | 101.52 |
| October | 100.71 | 101.82 |
| November | 100.82 | 101.37 |
| December | 101.31 | 101.29 |
| 2019 | ||
| January | 101.91 | 101.44 |
| February | 102.58 | 102.13 |
| March | 102.88 | 102.81 |
| April | 103.18 | 103.26 |
| May | 103.07 | 103.72 |
| June | 103.70 | 103.49 |
| July | 103.59 | 104.02 |
| August | 103.07 | 103.87 |
| September | 104.90 | 103.42 |
| October | 105.20 | 103.72 |
| November | 105.50 | 103.57 |
| December | 105.20 | 103.57 |
| 2020 | ||
| January | 106.39 | 103.87 |
| February | 106.88 | 104.33 |
| March | 109.42 | 103.72 |
| April | 114.47 | 103.04 |
| May | 113.79 | 103.34 |
| June | 111.14 | 104.18 |
| July | 110.09 | 104.18 |
| August | 109.68 | 104.02 |
| September | 110.62 | 103.95 |
| October | 110.88 | 104.40 |
| November | 110.65 | 104.56 |
| December | 110.99 | 104.33 |
| 2021 | ||
| January | 113.01 | 104.94 |
| February | 112.04 | 105.47 |
| March | 111.74 | 106.00 |
| April | 112.41 | 106.53 |
| May | 111.93 | 107.06 |
| June | 111.03 | 107.37 |
| July | 110.62 | 108.05 |
| August | 111.14 | 108.28 |
| September | 112.52 | 108.50 |
| October | 113.12 | 109.26 |
| November | 113.64 | 109.49 |
| December | 113.98 | 109.34 |
| 2022 | ||
| January | 115.70 | 110.33 |
| February | 115.48 | 111.47 |
| March | 115.59 | 113.06 |
| April | 116.11 | 113.74 |
| May | 116.34 | 115.34 |
| June | 116.79 | 116.10 |
| July | 116.41 | 116.25 |
| August | 117.12 | 115.87 |
| September | 118.39 | 115.95 |
|
Note: Data are unadjusted for seasonality. Source: Statistics Canada tables 14-10-0063-01 and 18-10-0004-01. |
||
For more information: Employer responses to labour shortages, Labour Force Survey, June 2022, Labour Force Survey, August 2022.
Pressures on affordability continue to mount as borrowing costs rise
While many households benefitted considerably from emergency support programs, higher prices are having a substantial impact on their pocketbooks.
- In April 2022, nearly three in four Canadians reported that rising prices are affecting their ability to meet day-to-day expenses.
- Three in 10 Canadians were very concerned about whether they can afford housing or rent.
About one-quarter of Canadians reported that they have had to borrow money from friends or relatives, take on additional debt, or use credit to meet day-to-day expenses.
- Lower-income earners, young Canadians, households with children, persons with disabilities and Canadians belonging to racialized groups were more likely to borrow money.
A recent TD Economics reportconcluded that inflation is hitting middle-income families particularly hard given that their spending patterns are more weighted toward transportation and food.
Food prices continue to rise: Grocery prices, measured year over year, were up 11.4% in September , their largest yearly increase in over four decades. Annual price increases for food have outpaced headline consumer inflation since December 2021.

Data table
| Percentage of Canadians affected by rising prices (April 2022) | Price change, year-over-year (September 2022) | |
|---|---|---|
| percent | ||
| Food | 43.0 | 10.3 |
| Transportation (including gasoline) | 32.0 | 8.7 |
| Housing | 9.0 | 6.8 |
| Household Operations | 8.0 | 3.3 |
| Recreation | 5.0 | 5.8 |
| Education | 2.0 | 2.6 |
| Sources: Statistics Canada, Rising prices are affecting the ability to meet day-to-day expenses for most Canadians & table 18-10-0004-01. | ||
For more information: Impacts of rising prices on Canadians.
Balance sheets remain strong across different age and income profiles, but risks are amplified among key demographics
Young households are more vulnerable to housing market correction: increases in the value of real estate accounted for most of the increase in wealth among young households from early 2021 to early 2022.
With the Bank of Canada’s policy interest rate rising to 3.25% in September, many potential homebuyers are currently being stress tested in the 6 to 7% range.
Despite sharp declines in resale prices, the Bank of Canada’s measure of housing affordability continued to deteriorate in the second quarter, reaching its lowest level in three decades.
Homeownership rates have been declining since 2011 as the growth in renters outpaces that of owners. Declines in homeownership are particularly apparent among younger Canadians.
- Homeownership rates among those aged 25 to 29 years fell from 44.1% in 2011 to 36.5% in 2021, while for those aged 30 to 34 years, homeownership rates fell from 59.2% to 52.3%.
Record decline in wealth: Nearly a trillion dollars was wiped off household balance sheets in the second quarter, erasing about one-quarter of the cumulative increase in household wealth built up since the start of the pandemic. Younger households experienced the steepest proportionate decline in net wealth for the quarter. The household wealth gap widened for the first time since the start of the pandemic.

Data table
| Less than 35 years | 35 to 44 years | 45 to 54 years | 55 to 64 years | 65 years and over | ||||||
|---|---|---|---|---|---|---|---|---|---|---|
| Year-over-Year Q1 2022 | Year-over-Year Q2 2022 | Year-over-Year Q1 2022 | Year-over-Year Q2 2022 | Year-over-Year Q1 2022 | Year-over-Year Q2 2022 | Year-over-Year Q1 2022 | Year-over-Year Q2 2022 | Year-over-Year Q1 2022 | Year-over-Year Q2 2022 | |
| dollars | ||||||||||
| Financial assets | 36,741,000,000 | -7,634,000,000 | 68,227,000,000 | -23,387,000,000 | 123,186,000,000 | -50,000,000,000 | 162,250,000,000 | -74,936,000,000 | 215,433,000,000 | -65,459,000,000 |
| Real estate | 140,195,000,000 | 75,840,000,000 | 228,170,000,000 | 119,425,000,000 | 286,375,000,000 | 139,274,000,000 | 286,807,000,000 | 138,853,000,000 | 336,978,000,000 | 168,659,000,000 |
| Other non-financial assets | 10,479,000,000 | 12,295,000,000 | 16,149,000,000 | 18,247,000,000 | 12,139,000,000 | 13,656,000,000 | 9,574,000,000 | 10,225,000,000 | 15,916,000,000 | 16,973,000,000 |
| Mortgage liabilities | -46,869,000,000 | 45,305,000,000 | -67,686,000,000 | 65,618,000,000 | -45,686,000,000 | 42,034,000,000 | -20,166,000,000 | 17,219,000,000 | -10,969,000,000 | 10,045,000,000 |
| Other liabilities | -5,364,000,000 | 7,928,000,000 | -8,064,000,000 | 11,072,000,000 | -3,485,000,000 | 6,164,000,000 | 565,000,000 | 1,117,000,000 | -2,608,000,000 | 3,409,000,000 |
| Source: Statistics Canada, Table 36-10-0660-01. | ||||||||||
Small businesses struggle to recover as demand normalizes
While large firms are more likely to face labour-related obstacles, small firms face more risk from insufficient demand, have more difficulty with cash flow and anticipate lower profitability.
- In the third quarter of 2022, almost 4 in 10 businesses with fewer than 20 employees anticipate lower profitability over the next three months, compared with one in five businesses with 100 or more employees.
- Small businesses have a less optimistic outlook. Fewer than two-thirds of businesses with fewer than five employees were optimistic about the next 12 months, compared with over four in five businesses with 100 or more employees.
- Recent research from the Canadian Federation of Independent Business found that over half of small businesses are still operating with below normal revenues, while about 6 in 10 are carrying debt—on average about $158,000—that was taken on during the pandemic.
Business dynamics: The business closure rate remained near its historical average during the first half of 2022, while the entry rate fell from March to June as firms continue to deal with rising input costs and labour-related obstacles.

Data table
| Index | |
|---|---|
| All sizes | 103.0 |
| 0 to 4 employees | 95.5 |
| 5 to 19 employees | 101.0 |
| 20 to 49 employees | 104.3 |
| 50 to 99 employees | 106.0 |
| 100 to 299 employees | 105.2 |
| 300 to 499 employees | 106.6 |
| 500 and more employees | 103.0 |
| Source: Statistics Canada, Table 14-10-0214-01. | |
For more information: Analysis on small businesses in Canada, first quarter of 2022.
Business competitiveness is a key challenge coming out of the pandemic
Productivity matters for living standards: Over the last four decades, increases in labour productivity have been responsible for about 90% of the increase in Canada’s gross domestic product per capita and have closely tracked real wage growth.
- Investment and higher productivity will be needed to offset the impact of the aging population on Canada’s workforce to sustain current living standards.
Lower productivity emerging from COVID-19: After rising sharply in the early stages of the pandemic, labour productivity declined for seven consecutive quarters before edging up in the second quarter of 2022. Productivity remains 1.3% below pre-pandemic levels.
Pressures on cost competitiveness: Unit labour costs, which measure the payments to labour required to produce a unit of output, continue to trend higher, and, in the second quarter of 2022, were 14.5% above pre-pandemic levels.
Supply chain disruptions weighing on productivity: Supply chain disruptions may have deeper impacts in trade-oriented sectors such as manufacturing with more exposure to foreign supply shocks. Over three-quarters of Canadian manufacturers rely on imported goods and services. Reshoring efforts intended to support supply chains may come at a cost to productivity.

Data table
| Business investment relative to pre-COVID-19 levels | |
|---|---|
| percentage change, Q4 2019 to Q2 2022 | |
| Total business investment | 1.7 |
| Intellectual property products | -4.6 |
| Machinery and equipment | 4.8 |
| Non-residential structures | -3.8 |
| Housing | 7.3 |
| Source: Statistics Canada, Table 36-10-0104-01. | |
For more information: Research to Insights: Investment, Productivity and Living Standards.
Key drivers of private sector investment are now less certain
Capital spending in oil and gas extraction was $9.3 billion in the second quarter of 2022. While being the largest outlay since 2018, spending in the quarter was less than half of that of the peak levels reported in late 2014.
The share of capital spending accounted for by public sector organizations has trended higher since the mid-2010s.
- Public sector spending accounted for almost 40% of planned outlays in 2022.
- While expected outlays by private organizations rebounded to pre-pandemic levels in 2022, public intentions were one-quarter above their pre-pandemic baseline.
Are digital technologies reshaping investment? Companies have been changing how information and communications technology (ICT) inputs are being integrated into their production systems. Over the last decade, spending on ICT services as intermediate inputs, possibly linked to cloud computing and other advances in data management, has risen at a faster pace than traditional outlays on ICT capital.
In early 2022, about one in five companies reported that they plan to increase spending on new or additional digital technologies in the next 12 months.

Data table
| All industries | Mining, quarrying and oil and gas extraction | Manufacturing | All industries excluding mining, quarrying, and oil and gas extraction, and manufacturing | |
|---|---|---|---|---|
| index | ||||
| 2006 | 100.0 | 100.0 | 100.0 | 100.0 |
| 2007 | 106.3 | 103.9 | 103.2 | 107.5 |
| 2008 | 113.1 | 114.1 | 100.6 | 114.4 |
| 2009 | 97.4 | 73.1 | 70.3 | 109.7 |
| 2010 | 110.5 | 111.5 | 78.3 | 114.2 |
| 2011 | 119.0 | 140.8 | 89.7 | 114.9 |
| 2012 | 126.2 | 162.7 | 88.9 | 117.7 |
| 2013 | 129.6 | 174.3 | 92.4 | 118.2 |
| 2014 | 137.7 | 187.9 | 105.0 | 123.7 |
| 2015 | 127.2 | 132.6 | 109.4 | 127.6 |
| 2016 | 116.4 | 100.2 | 96.5 | 124.9 |
| 2017 | 121.4 | 105.1 | 89.9 | 131.5 |
| 2018 | 133.3 | 100.6 | 124.2 | 146.4 |
| 2019 | 138.6 | 95.4 | 137.3 | 154.4 |
| 2020 | 126.0 | 66.1 | 117.5 | 148.9 |
| 2021 | 139.0 | 74.0 | 127.5 | 164.2 |
| 2022 | 151.0 | 89.3 | 127.4 | 176.4 |
|
Notes: Data for 2021 are preliminary actual estimates; data for 2022 are intentions. Source: Statistics Canada, Table 34-10-0035-01. |
||||
Overcoming challenges to innovation
Canada remains well behind most of its G7 peers in terms business spending on research development. The Conference Board of Canada’s Innovation Report Card 2021 placed Canada 13 out of 16 peer countries.
Before the pandemic, slightly more than half of all businesses reported that they faced obstacles related to innovation. Almost one in three of these businesses cited a lack of skills, uncertainty and risk as the most frequent barriers.
Most businesses did not use government programs as a means to overcome obstacles to innovation. For instance, government programs aimed toward external financing barriers were used by about one in five businesses.
Cross-border linkages are important sources of innovation and technology transfer: While foreign multinationals account for 15% of Canada’s economic output, they account for over 70% of cross-border trade in technical knowledge and technology-based services. Analysis at Statistics Canada has found that exporters are over a third more likely to use foreign technologies than are non-exporters, and that companies that begin to export are also more likely to begin conducting research and development.

Data table
| G7 countries | Rate |
|---|---|
| United States | 2.6 |
| Japan | 2.6 |
| Germany | 2.1 |
| France | 1.6 |
| United Kindom | 1.3 |
| Canada | 0.9 |
| Italy | 0.9 |
|
Notes: Estimates are for reference year 2020. Source: Organisation for Economic Co-operation and Development, Main Science and Technology Indicators. |
|
COVID-19 may have lasting impacts on social cohesion
The rise in violent crime was attributable in part to higher rates of sexual assault, harassing and threatening behaviours, and homicide.
Additionally, the number of hate-motivated crimes reported by police increased by 27% to 3,360 incidents.
- Hate crimes targeting religious affiliation and sexual orientation accounted for most of the national change.
Racialized groups were more than twice as likely to report having experienced discrimination since the beginning of the pandemic, compared with the rest of the population.
Trust in leaders: According to the Edelman Trust Barometer, the percentage of Canadians that viewed government leaders and chief executive officers as trustworthy edged lower in 2022, to 43% and 36%, respectively.

Data table
| Crime Severity Index | Violent Crime Severity Index | Non-violent Crime Severity Index | |
|---|---|---|---|
| index | |||
| 2001 | 105.3 | 97.2 | 108.4 |
| 2002 | 104.1 | 96.2 | 107.2 |
| 2003 | 106.8 | 97.6 | 110.4 |
| 2004 | 104.1 | 96.0 | 107.2 |
| 2005 | 101.3 | 98.5 | 102.4 |
| 2006 | 100.0 | 100.0 | 100.0 |
| 2007 | 95.3 | 97.8 | 94.3 |
| 2008 | 90.6 | 95.1 | 88.9 |
| 2009 | 87.8 | 94.3 | 85.3 |
| 2010 | 82.9 | 89.2 | 80.5 |
| 2011 | 77.6 | 85.7 | 74.5 |
| 2012 | 75.5 | 82.0 | 73.0 |
| 2013 | 68.9 | 74.0 | 66.9 |
| 2014 | 66.9 | 70.7 | 65.4 |
| 2015 | 70.4 | 75.3 | 68.4 |
| 2016 | 72.0 | 76.9 | 70.1 |
| 2017 | 73.6 | 81.3 | 70.7 |
| 2018 | 75.6 | 83.6 | 72.6 |
| 2019 | 79.8 | 90.3 | 75.8 |
| 2020 | 73.9 | 88.0 | 68.7 |
| 2021 | 73.7 | 92.5 | 66.7 |
|
Note: Crime severity indexes are based on Criminal Code incidents, including traffic offences, as well as other federal statute violations. The base index was set at 100 for 2006 for Canada. Populations are based on July 1 estimates from Statistics Canada's Centre for Demography. Source: Statistics Canada, Uniform Crime Reporting Survey (3302) |
|||
Impacts of the pandemic on mental health continue to persist
Mental health has not recovered: More Canadians are reporting fair or poor mental health with the largest declines among youth.
Suicidal ideation has significantly increased since the pandemic began. The rate is highest among those aged 18 to 34 years (8.0%). Fewer than 6 in 10 Canadians report a strong feeling of meaning or purpose, especially youth.
Vulnerable populations are more affected: Canadian adults who were already experiencing mental health difficulties were two times more likely to report a decline in mental health because of COVID-19.
Barriers to care: As of 2021, four in five of those seeking mental health care for post-traumatic stress disorder had trouble accessing care as a result of long wait times, appointment cancellations because of the pandemic and the cost of care.

Data table
| 2019 | 2020 | 2021 | |
|---|---|---|---|
| percent | |||
| Total, 12 years and over | 8.1 | 9.7 | 11.7 |
| 12 to 17 years | 6.0 | 8.3 | 11.9 |
| 18 to 34 years | 11.8 | 13.2 | 15.7 |
| 35 to 49 years | 7.7 | 10.4 | 13.1 |
| 50 to 64 years | 7.2 | 9.0 | 10.3 |
| 65 years and over | 5.2 | 5.5 | 6.8 |
| Source: Statistics Canada, Table 13-10-0096-01 | |||
Takeaways
Population aging amplifies labour shortage worries
- Job vacancies climbed to a record high in mid-2022 despite the strong recovery in payroll jobs. Older Canadians led the increase in the working-age population, slowing the growth of the labour force. One fifth of Canadians are set to retire in the next decade.
Pressures on affordability mount as borrowing costs rise
- Inflation had an impact on most Canadians with three-quarters reporting that rising prices have affected their ability to meet day-to-day expenses. One-quarter of Canadians reported borrowing money or taking on debt to pay their bills, particularly lower-income, younger Canadians and households with children.
Business competitiveness and sources of investment are uncertain in the wake of the COVID-19 pandemic
- Non-residential investment has been slow to recover from the COVID-19 pandemic. It remains well below the peak levels observed in the mid-2010s when large capital outlays in the energy sector fuelled job and income gains.
- Business productivity has fallen below pre-pandemic levels. Higher productivity will be needed to offset the impact of the aging population on Canada’s workforce in order to sustain current living standards.
Social strains remain as public health measures are lifted
- Mental health has yet to recover to pre-pandemic levels, particularly among youth, while fewer than 6 in 10 Canadians report a strong feeling of meaning or purpose. Rising crime severity and increased instances of discrimination underline social strains for marginalized populations.
- Date modified: