
Research to Insights: Consumer price inflation, recent trends and analysis
Skip to text
Text begins
About Research to Insights
The Research to Insights series of presentations features a broad range of findings on selected research topics. Each presentation draws from and integrates evidence from various studies that use innovative and high-quality data and methods to better understand relevant and complex policy issues.
Based on applied research of valuable data, the series is intended to provide decision makers, and Canadians more broadly, a comprehensive and horizontal view of the current economic, social and health issues we face in a changing world.
Context
- Since early 2021, higher prices for gasoline, shelter, food and consumer durables have put upward pressure on consumer inflation. Supply disruptions coupled with strong household demand have fuelled price growth.
- By mid-2022, consumer inflation had accelerated to its fastest pace in four decades, peaking at 8.1% in June. While the headline rate eased in late 2022 as gasoline prices fell, key sources of inflationary pressure, including food and shelter, showed little signs of moderating.
- The pace of inflation has not been uniform across all provinces, but overall trends have been similar. In 2022, Prince Edward Island and Manitoba posted the largest annual increases in average prices.
- As inflation ramped up in 2022, Canadians reported that they were most impacted by rising food prices, followed by higher costs for transportation and housing.
- Wages and earnings have not kept pace with price pressures, especially those related to food and shelter. In the third quarter of 2022, net saving among the bottom 40% of income earners was below levels recorded at the start of the COVID-19 pandemic, while younger households increased their debt leverage to fund consumption.
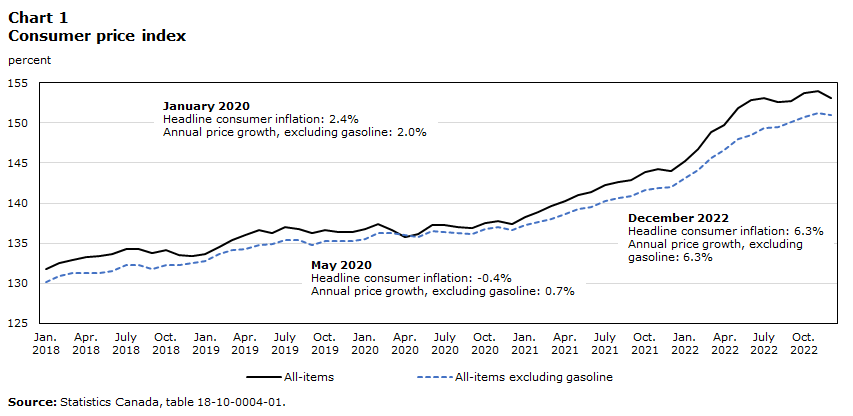
Inflationary pressures built up steadily in 2021 and 2022
- December 2022 marked the 21st consecutive month that the headline rate had been above 3% and the 10th consecutive month above 6%.
- Overall consumer prices have risen by 11.4% during the past two years. Excluding gasoline, prices have increased by 10.5%.
Data table for Chart 1
| All-items | All-items excluding gasoline | |
|---|---|---|
| percent | ||
| 2018 | ||
| January | 131.7 | 130.1 |
| February | 132.5 | 130.9 |
| March | 132.9 | 131.2 |
| April | 133.3 | 131.2 |
| May | 133.4 | 131.2 |
| June | 133.6 | 131.5 |
| July | 134.3 | 132.2 |
| August | 134.2 | 132.2 |
| September | 133.7 | 131.7 |
| October | 134.1 | 132.3 |
| November | 133.5 | 132.2 |
| December | 133.4 | 132.5 |
| 2019 | ||
| January | 133.6 | 132.8 |
| February | 134.5 | 133.6 |
| March | 135.4 | 134.1 |
| April | 136.0 | 134.2 |
| May | 136.6 | 134.8 |
| June | 136.3 | 134.9 |
| July | 137.0 | 135.4 |
| August | 136.8 | 135.4 |
| September | 136.2 | 134.8 |
| October | 136.6 | 135.3 |
| November | 136.4 | 135.2 |
| December | 136.4 | 135.2 |
| 2020 | ||
| January | 136.8 | 135.5 |
| February | 137.4 | 136.3 |
| March | 136.6 | 136.3 |
| April | 135.7 | 136.0 |
| May | 136.1 | 135.8 |
| June | 137.2 | 136.5 |
| July | 137.2 | 136.4 |
| August | 137.0 | 136.2 |
| September | 136.9 | 136.1 |
| October | 137.5 | 136.7 |
| November | 137.7 | 137.0 |
| December | 137.4 | 136.6 |
| 2021 | ||
| January | 138.2 | 137.2 |
| February | 138.9 | 137.6 |
| March | 139.6 | 138.0 |
| April | 140.3 | 138.6 |
| May | 141.0 | 139.2 |
| June | 141.4 | 139.5 |
| July | 142.3 | 140.2 |
| August | 142.6 | 140.6 |
| September | 142.9 | 140.9 |
| October | 143.9 | 141.6 |
| November | 144.2 | 141.9 |
| December | 144.0 | 142.0 |
| 2022 | ||
| January | 145.3 | 143.1 |
| February | 146.8 | 144.1 |
| March | 148.9 | 145.6 |
| April | 149.8 | 146.6 |
| May | 151.9 | 148.0 |
| June | 152.9 | 148.5 |
| July | 153.1 | 149.4 |
| August | 152.6 | 149.5 |
| September | 152.7 | 150.1 |
| October | 153.8 | 150.8 |
| November | 154.0 | 151.2 |
| December | 153.1 | 151.0 |
|
Notes: January 2020 Headline consumer inflation: 2.4% Annual price growth, excluding gasoline: 2.0%. May 2020 Headline consumer inflation: -0.4% Annual price growth, excluding gasoline: 0.7%. December 2022 Headline consumer inflation: 6.3% Annual price growth, excluding gasoline: 6.3% Source: Statistics Canada, table 18-10-0004-01. |
||
Consumer inflation in Canada less pronounced than in several G7 countries, including the United States
- In 2021, inflation in the United States rose at a faster pace than in Canada in part because of much larger increases in used vehicle prices south of the border, which account for a larger share of consumer outlays in the United States.
- Price growth in both countries was similar in 2022, with inflationary pressures easing at mid-year as gasoline prices declined.

Data table for Chart 2
| December 2021 | December 2022 | |
|---|---|---|
| year-over-year percent change | ||
| Italy | 3.9 | 11.6 |
| United Kingdom | 4.8 | 9.2 |
| Germany | 5.3 | 8.6 |
| United States of America | 7.0 | 6.5 |
| Canada | 4.8 | 6.3 |
| France | 2.8 | 5.9 |
| Japan | 0.8 | 4.0 |
| Source: Organization for Economic Cooperation and Development. | ||
Inflationary pressure became increasingly broad based in 2021 and 2022
How much of consumer spending has been gradually impacted by high inflation?
- Over the course of 2021, the share of spending on products and services that had seen prices rise by more than 3% during the previous 12 months rose considerably. This share increased from about 20% in January 2021 to almost 60% by December of that year.
- When inflation peaked in June 2022, the share of spending on products that had seen yearly price increases of more than 6% now accounted for one-half of the expenditure weight.

Data table for Chart 3
| 3.0% or less | 3.1% to 6.0% | 6.1% to 10.0% | Greater than 10% | |
|---|---|---|---|---|
| percent of basket weight | ||||
| 2021 | ||||
| January | 79.1 | 16.93 | 2.14 | 1.74 |
| February | 74.13 | 16.86 | 8.61 | 0.31 |
| March | 64.84 | 21.93 | 8.12 | 5.02 |
| April | 63.47 | 18.49 | 13.56 | 4.39 |
| May | 56.85 | 24.67 | 7.83 | 10.56 |
| June | 57.11 | 19.89 | 6.08 | 16.93 |
| July | 53.37 | 24.85 | 4.39 | 17.4 |
| August | 46.54 | 23.36 | 11.88 | 18.23 |
| September | 50.28 | 18.54 | 13.33 | 17.86 |
| October | 46.24 | 23.97 | 12.48 | 17.32 |
| November | 43.03 | 26.52 | 13.28 | 17.18 |
| December | 41.18 | 23.28 | 17.76 | 17.79 |
| 2022 | ||||
| January | 32.48 | 35.4 | 13.29 | 18.84 |
| February | 31.31 | 33.99 | 13.98 | 20.73 |
| March | 33.11 | 25.41 | 19.5 | 21.99 |
| April | 28.63 | 23.62 | 24 | 23.76 |
| May | 23.99 | 26.42 | 21.94 | 27.57 |
| June | 22.55 | 26.56 | 31.95 | 18.86 |
| July | 23.4 | 26.53 | 34.01 | 15.98 |
| August | 19.07 | 29.36 | 35.73 | 15.76 |
| September | 18.41 | 30.78 | 31.91 | 18.82 |
| October | 14.56 | 32.06 | 34.92 | 18.38 |
| November | 16.4 | 35 | 29.95 | 18.57 |
| December | 26.11 | 30.86 | 27.79 | 15.16 |
| Source: Statistics Canada, Consumer Price Index, special tabulations. | ||||
Rising food prices and housing costs are key stressors for Canadian families
- In April 2022, nearly three in four Canadians reported that rising prices were affecting their ability to meet day-to-day expenses.
- Three in ten Canadians were very concerned about whether they could afford housing or rent.
- By the fall of 2022, almost half (44%) said they were very concerned with their household’s ability to afford housing or rent.
- One in four Canadians said they were unable to cover an unexpected expense of $500.
- Young adults were among those most concerned over finances, with almost half of people aged 35-44 years saying they found it difficult to meet their financial needs in the previous 12 months.

Data table for Chart 4
| percent of respondents | |
|---|---|
| Transportation (including gasoline) | 0.32 |
| Housing | 0.09 |
| Household operations | 0.08 |
| Recreation | 0.05 |
| Education | 0.02 |
| Food | 0.43 |
| Sources: Statistics Canada, “Rising prices are affecting the ability to meet day-to-day expenses for most Canadians,” The Daily, June 2022, and Portrait of Canadian Society – Impacts of Rising Prices, April 19 to May 1, 2022. | |
For more information: The Daily — One in four Canadians are unable to cover an unexpected expense of $500 (statcan.gc.ca)
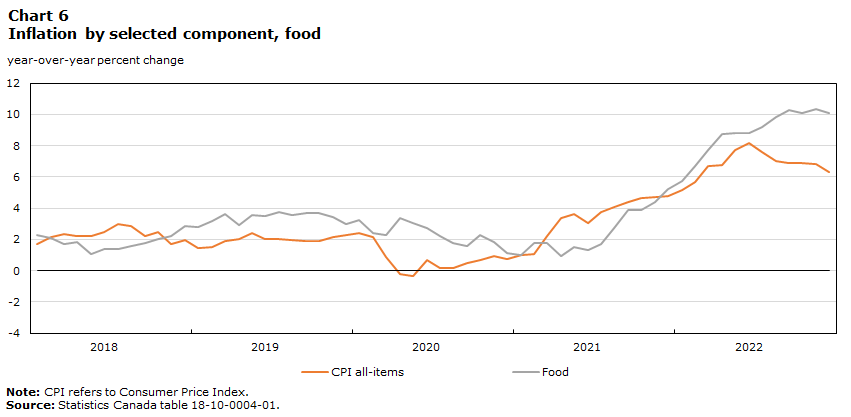
While gasoline prices eased during the second half of 2022, price pressures on food and housing continued to put severe strain on living costs
- In late 2022, prices for many products and services that directly impact living costs remained elevated. Food prices continued to edge higher and, measured year-over-year, remained in double-digit territory from September to December.
- Shelter costs also continued to rise steadily as higher mortgage interest costs offset recent declines in homeowners’ replacement costs (which reflect prices for new homes).
- Prices for rental accommodation rose in 19 of the past 24 months as the demand for rental units ramped up.

Data table for Chart 5
| CPI all-items | Gasoline (RHS) | |
|---|---|---|
| year-over-year percent change | ||
| 2018 | ||
| January | 1.7 | 7.8 |
| February | 2.2 | 12.6 |
| March | 2.3 | 17.1 |
| April | 2.2 | 14.2 |
| May | 2.2 | 22.9 |
| June | 2.5 | 24.6 |
| July | 3.0 | 25.4 |
| August | 2.8 | 19.9 |
| September | 2.2 | 12.0 |
| October | 2.4 | 12.0 |
| November | 1.7 | -5.4 |
| December | 2.0 | -8.6 |
| 2019 | ||
| January | 1.4 | -14.2 |
| February | 1.5 | -11.9 |
| March | 1.9 | -4.4 |
| April | 2.0 | -1.6 |
| May | 2.4 | -3.7 |
| June | 2.0 | -9.2 |
| July | 2.0 | -6.9 |
| August | 1.9 | -10.2 |
| September | 1.9 | -10.0 |
| October | 1.9 | -6.7 |
| November | 2.2 | 0.9 |
| December | 2.2 | 7.4 |
| 2020 | ||
| January | 2.4 | 11.2 |
| February | 2.2 | 7.0 |
| March | 0.9 | -21.2 |
| April | -0.2 | -39.3 |
| May | -0.4 | -29.8 |
| June | 0.7 | -15.7 |
| July | 0.1 | -14.9 |
| August | 0.1 | -11.1 |
| September | 0.5 | -10.7 |
| October | 0.7 | -12.4 |
| November | 1.0 | -11.9 |
| December | 0.7 | -8.5 |
| 2021 | ||
| January | 1.0 | -3.3 |
| February | 1.1 | 5.0 |
| March | 2.2 | 35.3 |
| April | 3.4 | 62.5 |
| May | 3.6 | 43.4 |
| June | 3.1 | 32.0 |
| July | 3.7 | 30.9 |
| August | 4.1 | 32.5 |
| September | 4.4 | 32.8 |
| October | 4.7 | 41.7 |
| November | 4.7 | 43.6 |
| December | 4.8 | 33.3 |
| 2022 | ||
| January | 5.1 | 31.7 |
| February | 5.7 | 32.3 |
| March | 6.7 | 39.8 |
| April | 6.8 | 36.3 |
| May | 7.7 | 48.0 |
| June | 8.1 | 54.6 |
| July | 7.6 | 35.6 |
| August | 7.0 | 22.1 |
| September | 6.9 | 13.2 |
| October | 6.9 | 17.8 |
| November | 6.8 | 13.7 |
| December | 6.3 | 3.0 |
|
Note: CPI refers to Consumer Price Index and RHS refers to right-hand side axis. Source: Statistics Canada table 18-10-0004-01. |
||
Data table for Chart 6
| CPI all-items | Food | |
|---|---|---|
| year-over-year percent change | ||
| 2018 | ||
| January | 1.7 | 2.3 |
| February | 2.2 | 2.1 |
| March | 2.3 | 1.7 |
| April | 2.2 | 1.8 |
| May | 2.2 | 1.0 |
| June | 2.5 | 1.4 |
| July | 3.0 | 1.4 |
| August | 2.8 | 1.6 |
| September | 2.2 | 1.8 |
| October | 2.4 | 2.0 |
| November | 1.7 | 2.2 |
| December | 2.0 | 2.9 |
| 2019 | ||
| January | 1.4 | 2.8 |
| February | 1.5 | 3.2 |
| March | 1.9 | 3.6 |
| April | 2.0 | 2.9 |
| May | 2.4 | 3.5 |
| June | 2.0 | 3.5 |
| July | 2.0 | 3.8 |
| August | 1.9 | 3.6 |
| September | 1.9 | 3.7 |
| October | 1.9 | 3.7 |
| November | 2.2 | 3.4 |
| December | 2.2 | 3.0 |
| 2020 | ||
| January | 2.4 | 3.2 |
| February | 2.2 | 2.4 |
| March | 0.9 | 2.3 |
| April | -0.2 | 3.4 |
| May | -0.4 | 3.1 |
| June | 0.7 | 2.7 |
| July | 0.1 | 2.2 |
| August | 0.1 | 1.8 |
| September | 0.5 | 1.6 |
| October | 0.7 | 2.3 |
| November | 1.0 | 1.9 |
| December | 0.7 | 1.1 |
| 2021 | ||
| January | 1.0 | 1.0 |
| February | 1.1 | 1.8 |
| March | 2.2 | 1.8 |
| April | 3.4 | 0.9 |
| May | 3.6 | 1.5 |
| June | 3.1 | 1.3 |
| July | 3.7 | 1.7 |
| August | 4.1 | 2.7 |
| September | 4.4 | 3.9 |
| October | 4.7 | 3.8 |
| November | 4.7 | 4.4 |
| December | 4.8 | 5.2 |
| 2022 | ||
| January | 5.1 | 5.7 |
| February | 5.7 | 6.7 |
| March | 6.7 | 7.7 |
| April | 6.8 | 8.8 |
| May | 7.7 | 8.8 |
| June | 8.1 | 8.8 |
| July | 7.6 | 9.2 |
| August | 7.0 | 9.8 |
| September | 6.9 | 10.3 |
| October | 6.9 | 10.1 |
| November | 6.8 | 10.3 |
| December | 6.3 | 10.1 |
|
Note: CPI refers to Consumer Price Index. Source: Statistics Canada table 18-10-0004-01. |
||

Data table for Chart 7
| CPI all-items | Shelter | Household operations | |
|---|---|---|---|
| year-over-year percent change | |||
| 2018 | |||
| January | 1.7 | 1.4 | 1.3 |
| February | 2.2 | 1.7 | 2.3 |
| March | 2.3 | 1.7 | 1.9 |
| April | 2.2 | 1.7 | 1.9 |
| May | 2.2 | 2.0 | 0.6 |
| June | 2.5 | 2.0 | 0.0 |
| July | 3.0 | 2.4 | 1.0 |
| August | 2.8 | 2.3 | 1.3 |
| September | 2.2 | 2.5 | 1.9 |
| October | 2.4 | 2.5 | 1.7 |
| November | 1.7 | 2.4 | 1.6 |
| December | 2.0 | 2.2 | 3.6 |
| 2019 | |||
| January | 1.4 | 2.4 | 1.7 |
| February | 1.5 | 2.4 | 0.4 |
| March | 1.9 | 2.7 | 0.7 |
| April | 2.0 | 2.7 | -0.1 |
| May | 2.4 | 2.7 | 1.2 |
| June | 2.0 | 2.5 | 1.8 |
| July | 2.0 | 2.3 | 0.7 |
| August | 1.9 | 2.4 | 0.9 |
| September | 1.9 | 2.3 | 0.5 |
| October | 1.9 | 2.6 | -0.1 |
| November | 2.2 | 2.5 | -0.3 |
| December | 2.2 | 2.8 | -0.6 |
| 2020 | |||
| January | 2.4 | 2.4 | -0.8 |
| February | 2.2 | 2.3 | 0.0 |
| March | 0.9 | 1.9 | 0.3 |
| April | -0.2 | 1.3 | 0.3 |
| May | -0.4 | 1.0 | -0.2 |
| June | 0.7 | 1.7 | -0.4 |
| July | 0.1 | 1.5 | 0.1 |
| August | 0.1 | 1.5 | -0.2 |
| September | 0.5 | 1.7 | -0.4 |
| October | 0.7 | 1.8 | -0.4 |
| November | 1.0 | 1.9 | -0.5 |
| December | 0.7 | 1.6 | -0.7 |
| 2021 | |||
| January | 1.0 | 1.4 | 0.3 |
| February | 1.1 | 1.4 | -0.8 |
| March | 2.2 | 2.4 | -2.2 |
| April | 3.4 | 3.2 | -1.1 |
| May | 3.6 | 4.2 | -0.7 |
| June | 3.1 | 4.4 | -0.9 |
| July | 3.7 | 4.8 | -0.3 |
| August | 4.1 | 4.8 | -0.1 |
| September | 4.4 | 4.8 | 0.4 |
| October | 4.7 | 4.8 | 0.9 |
| November | 4.7 | 4.8 | 0.2 |
| December | 4.8 | 5.4 | 0.7 |
| 2022 | |||
| January | 5.1 | 6.2 | 0.7 |
| February | 5.7 | 6.6 | 1.5 |
| March | 6.7 | 6.8 | 2.7 |
| April | 6.8 | 7.4 | 2.0 |
| May | 7.7 | 7.4 | 2.9 |
| June | 8.1 | 7.1 | 3.1 |
| July | 7.6 | 7.0 | 2.7 |
| August | 7.0 | 6.6 | 3.0 |
| September | 6.9 | 6.8 | 3.3 |
| October | 6.9 | 6.9 | 3.2 |
| November | 6.8 | 7.2 | 3.8 |
| December | 6.3 | 7.0 | 3.7 |
|
Note: CPI refers to Consumer Price Index. Source: Statistics Canada table 18-10-0004-01. |
|||
Canadian food prices are growing at their fastest pace in 40 years
- Many factors are contributing to food inflation, including supply chain disruptions, erratic weather, labour shortages and wage pressures, rising prices for farm inputs, higher import and transport costs, and geopolitical events such as the war in Ukraine.
- Unlike past trends, many of these pressures have been occurring simultaneously or in a more pronounced manner, leading to broad based increases in food prices not only domestically, but globally.
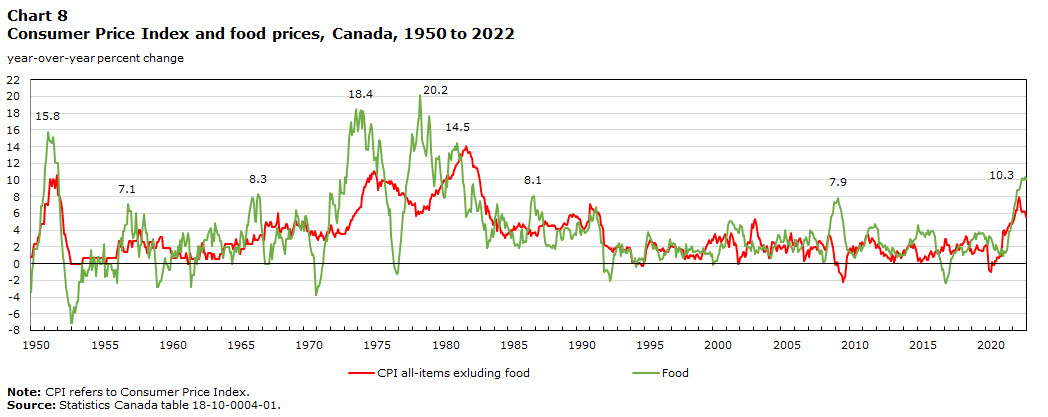
Description for Chart 8
Chart 8 shows line graphs for food prices and the consumer price index (CPI) excluding food prices. There are two lines. The graphs show the year over year percentage change in the price of food on a monthly basis and the year over year percentage change in consumer prices excluding food on a monthly basis. There are also numbers at various points throughout the graph to signify peak food prices at various times. The y-axis shows the percentage change in prices, from a minimum of -8.0% to a maximum of 22.0%. The x-axis of the graph is months starting with January 1950 and ending with December 2022.
The data is available in CSV format
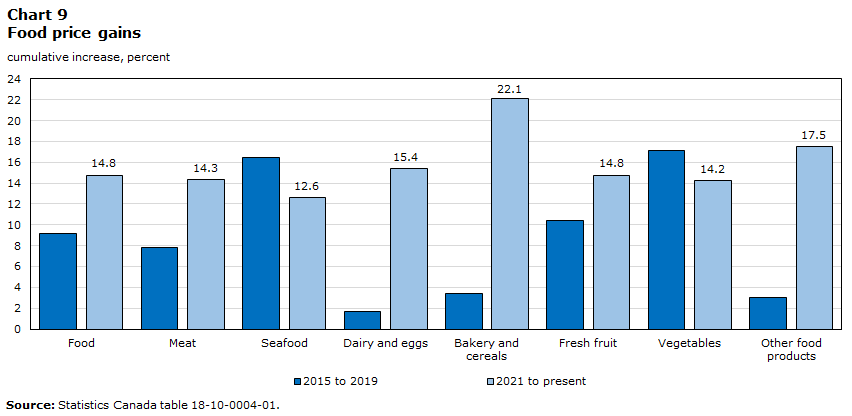
Food inflation has become increasingly broad based as supply chain issues, labour shortages, transportation costs, weather events and geopolitical developments put upward pressure on food prices
- For context, food prices rose a cumulative 9.2% from 2015 to 2019, while they increased 14.8% between January 2021 and December 2022.
Data table for Chart 9
| 2015 to 2019 | 2021 to present | |
|---|---|---|
| cumulative increase, percent | ||
| Food | 9.2 | 14.8 |
| Meat | 7.9 | 14.3 |
| Seafood | 16.5 | 12.6 |
| Dairy and eggs | 1.7 | 15.4 |
| Bakery and cereals | 3.4 | 22.1 |
| Fresh fruit | 10.4 | 14.8 |
| Vegetables | 17.1 | 14.2 |
| Other food products | 3.0 | 17.5 |
| Source: Statistics Canada table 18-10-0004-01. | ||
- The second half of 2022 witnessed a sharp rise in the share of food spending in double-digit territory, with little relief as headline inflation eased late in the year. At year-end, food items with yearly price increases of more than 10% accounted for two-thirds of food expenditures.

Data table for Chart 10
| 3.0% or less | 3.1% to 6.0% | 6.1% to 10% | Greater than 10% | |
|---|---|---|---|---|
| percentage of basket weight | ||||
| 2021 | ||||
| January | 93.9 | 3.5 | 1.7 | 0.9 |
| February | 75.5 | 17.6 | 6.0 | 0.9 |
| March | 75.2 | 18.5 | 0.0 | 6.3 |
| April | 89.4 | 0.4 | 10.3 | 0.0 |
| May | 76.7 | 13.2 | 10.1 | 0.0 |
| June | 62.0 | 17.6 | 15.4 | 5.1 |
| July | 67.5 | 24.2 | 6.4 | 1.9 |
| August | 52.5 | 25.3 | 18.4 | 3.8 |
| September | 44.3 | 26.9 | 16.8 | 12.0 |
| October | 32.9 | 41.6 | 18.0 | 7.5 |
| November | 30.7 | 36.4 | 24.4 | 8.5 |
| December | 19.5 | 29.8 | 41.4 | 9.3 |
| 2022 | ||||
| January | 9.3 | 32.8 | 39.0 | 18.8 |
| February | 4.3 | 27.0 | 49.4 | 19.3 |
| March | 6.7 | 7.0 | 53.6 | 32.7 |
| April | 2.7 | 12.8 | 46.4 | 38.1 |
| May | 1.5 | 11.2 | 40.1 | 47.2 |
| June | 2.5 | 16.0 | 49.0 | 32.4 |
| July | 4.8 | 9.0 | 46.1 | 40.1 |
| August | 4.6 | 8.6 | 27.2 | 59.6 |
| September | 4.4 | 5.6 | 24.0 | 66.0 |
| October | 6.6 | 9.1 | 35.1 | 49.1 |
| November | 6.5 | 9.7 | 23.5 | 60.3 |
| December | 4.6 | 11.4 | 16.5 | 67.6 |
|
Note: Data are limited to food products purchased from stores. Sources: Statistics Canada tables 18-10-0004 and 18-10-0007-01. |
||||
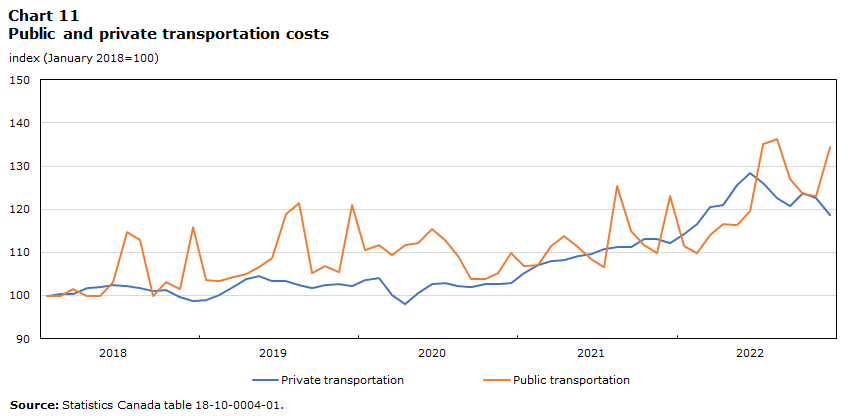
Rising fuel prices have had an impact on families, in terms of travel budgets, and producers, in terms of shipping costs
- Since January 2021, private transportation costs have increased by 12.6%, largely because of the growing cost of operating a passenger vehicle (+13.4%), while rail freight transportation costs have increased by 23.8%.
- The cost of public transportation has increased by 25.8%, largely because of the increase in intercity transportation costs (+47.4%). The latter has been driven mainly by air transportation.
Data table for Chart 11
| Private transportation | Public transportation | |
|---|---|---|
| Index (January 2018=100) | ||
| 2018 | ||
| January | 100.0 | 100.0 |
| February | 100.4 | 99.8 |
| March | 100.4 | 101.6 |
| April | 101.8 | 99.8 |
| May | 102.1 | 99.8 |
| June | 102.4 | 103.1 |
| July | 102.1 | 114.6 |
| August | 101.7 | 113.0 |
| September | 101.0 | 100.0 |
| October | 101.3 | 103.1 |
| November | 99.7 | 101.5 |
| December | 98.7 | 115.8 |
| 2019 | ||
| January | 99.0 | 103.6 |
| February | 100.1 | 103.3 |
| March | 102.1 | 104.2 |
| April | 103.9 | 104.9 |
| May | 104.6 | 106.5 |
| June | 103.3 | 108.6 |
| July | 103.3 | 118.9 |
| August | 102.4 | 121.4 |
| September | 101.8 | 105.1 |
| October | 102.4 | 106.8 |
| November | 102.7 | 105.5 |
| December | 102.2 | 121.0 |
| 2020 | ||
| January | 103.7 | 110.5 |
| February | 104.0 | 111.7 |
| March | 100.1 | 109.4 |
| April | 98.1 | 111.7 |
| May | 100.5 | 112.2 |
| June | 102.6 | 115.4 |
| July | 102.9 | 112.8 |
| August | 102.3 | 109.1 |
| September | 102.0 | 103.9 |
| October | 102.6 | 103.7 |
| November | 102.6 | 105.1 |
| December | 102.8 | 109.9 |
| 2021 | ||
| January | 105.3 | 106.8 |
| February | 107.1 | 107.0 |
| March | 108.0 | 111.6 |
| April | 108.2 | 113.7 |
| May | 109.2 | 111.2 |
| June | 109.7 | 108.4 |
| July | 110.9 | 106.5 |
| August | 111.2 | 125.3 |
| September | 111.2 | 115.0 |
| October | 113.0 | 111.6 |
| November | 113.1 | 109.9 |
| December | 112.1 | 123.1 |
| 2022 | ||
| January | 114.2 | 111.6 |
| February | 116.6 | 109.8 |
| March | 120.6 | 114.1 |
| April | 121.1 | 116.7 |
| May | 125.7 | 116.2 |
| June | 128.5 | 119.7 |
| July | 126.1 | 135.2 |
| August | 122.6 | 136.3 |
| September | 120.7 | 127.0 |
| October | 123.7 | 123.6 |
| November | 122.6 | 123.0 |
| December | 118.6 | 134.4 |
| Source: Statistics Canada table 18-10-0004-01. | ||
- Since January 2021, trucking transportation costs have risen 30.9%, while rail freight transportation costs have increased by 23.8%.

Data table for Chart 12
| Freight Rail Services Price Index | General freight trucking | |
|---|---|---|
| Index (January 2018=100) | ||
| 2018 | ||
| January | 100.0 | 100.0 |
| February | 100.7 | 100.7 |
| March | 102.0 | 101.6 |
| April | 101.5 | 102.7 |
| May | 102.0 | 104.0 |
| June | 106.6 | 105.6 |
| July | 107.8 | 105.7 |
| August | 107.4 | 105.7 |
| September | 107.8 | 106.1 |
| October | 108.1 | 107.1 |
| November | 109.4 | 107.3 |
| December | 109.9 | 107.3 |
| 2019 | ||
| January | 110.0 | 106.7 |
| February | 108.8 | 107.1 |
| March | 109.2 | 108.3 |
| April | 109.5 | 108.8 |
| May | 110.0 | 109.4 |
| June | 110.1 | 108.9 |
| July | 110.0 | 108.5 |
| August | 110.6 | 109.2 |
| September | 110.4 | 109.3 |
| October | 111.1 | 108.4 |
| November | 111.6 | 109.0 |
| December | 111.4 | 109.2 |
| 2020 | ||
| January | 111.2 | 109.8 |
| February | 112.6 | 109.5 |
| March | 114.2 | 108.7 |
| April | 114.7 | 106.4 |
| May | 113.7 | 105.5 |
| June | 110.8 | 105.4 |
| July | 111.1 | 105.3 |
| August | 110.1 | 105.3 |
| September | 109.7 | 106.6 |
| October | 110.7 | 105.8 |
| November | 110.1 | 105.8 |
| December | 109.2 | 106.3 |
| 2021 | ||
| January | 109.8 | 108.2 |
| February | 110.7 | 108.6 |
| March | 110.7 | 109.5 |
| April | 111.6 | 110.5 |
| May | 110.8 | 110.5 |
| June | 110.9 | 111.4 |
| July | 112.8 | 112.2 |
| August | 113.7 | 113.5 |
| September | 114.6 | 113.7 |
| October | 115.6 | 115.7 |
| November | 116.7 | 117.8 |
| December | 118.7 | 118.8 |
| 2022 | ||
| January | 119.6 | 121.8 |
| February | 119.9 | 125.8 |
| March | 121.9 | 132.7 |
| April | 122.9 | 139.3 |
| May | 129.2 | 144.5 |
| June | 129.5 | 145.5 |
| July | 132.8 | 144.8 |
| August | 132.5 | 140.7 |
| September | 132.5 | 141.6 |
| October | 133.7 | Note ...: not applicable |
| November | 134.8 | Note ...: not applicable |
| December | 135.9 | Note ...: not applicable |
|
... not applicable Sources: Statistics Canada tables 18-10-0212-01 and 18-10-0043-01. |
||
The costs of owning or renting a home are rising at the fastest pace in over 30 years
- Higher mortgage interest costs, which rose 18% in the 12 months to December 2022, put strong upward pressure on headline inflation in late 2022.
- Housing affordability deteriorated markedly during the second and third quarters of 2022 as borrowing costs rose.
- Yearly price increases for rental accommodation, which reflect both older and more recent rental contracts, were 5.9% in December 2022.
- The costs of utilities have grown, largely because of rising household fuel and natural gas prices.

Data table for Chart 13
| Shelter | Rented accommodation | Owned accommodation | Water, fuel and electricity | |
|---|---|---|---|---|
| Index (January 2018=100) | ||||
| 2018 | ||||
| January | 100.0 | 100.0 | 100.0 | 100.0 |
| February | 100.2 | 100.2 | 100.2 | 100.3 |
| March | 100.2 | 100.2 | 100.3 | 99.7 |
| April | 100.4 | 100.3 | 100.5 | 100.1 |
| May | 100.5 | 100.5 | 100.7 | 99.4 |
| June | 100.6 | 100.6 | 100.9 | 99.3 |
| July | 100.9 | 100.7 | 101.1 | 100.3 |
| August | 101.1 | 100.8 | 101.4 | 100.1 |
| September | 101.3 | 101.0 | 101.6 | 100.2 |
| October | 101.6 | 101.1 | 102.1 | 100.5 |
| November | 101.9 | 101.2 | 102.3 | 100.8 |
| December | 101.9 | 101.2 | 102.5 | 100.3 |
| 2019 | ||||
| January | 102.4 | 102.2 | 102.7 | 101.2 |
| February | 102.6 | 102.6 | 102.9 | 101.5 |
| March | 102.9 | 103.0 | 103.1 | 102.2 |
| April | 103.1 | 102.6 | 103.3 | 103.4 |
| May | 103.2 | 102.7 | 103.4 | 103.4 |
| June | 103.1 | 102.9 | 103.5 | 101.6 |
| July | 103.3 | 103.2 | 103.6 | 101.9 |
| August | 103.5 | 103.9 | 103.7 | 102.2 |
| September | 103.7 | 104.0 | 103.9 | 102.2 |
| October | 104.3 | 104.7 | 104.6 | 102.1 |
| November | 104.4 | 104.4 | 104.8 | 103.1 |
| December | 104.7 | 104.7 | 104.9 | 103.7 |
| 2020 | ||||
| January | 104.8 | 104.6 | 105.0 | 103.9 |
| February | 105.0 | 105.4 | 105.1 | 103.5 |
| March | 104.9 | 105.6 | 105.5 | 101.2 |
| April | 104.5 | 104.9 | 105.8 | 98.5 |
| May | 104.2 | 104.1 | 105.7 | 98.1 |
| June | 104.8 | 104.7 | 105.7 | 100.9 |
| July | 104.8 | 104.4 | 105.7 | 101.5 |
| August | 105.1 | 105.3 | 105.8 | 101.7 |
| September | 105.4 | 105.6 | 106.1 | 102.5 |
| October | 106.2 | 105.8 | 106.9 | 103.3 |
| November | 106.4 | 105.9 | 107.1 | 104.1 |
| December | 106.4 | 105.3 | 107.2 | 104.7 |
| 2021 | ||||
| January | 106.2 | 105.6 | 107.3 | 102.6 |
| February | 106.5 | 105.6 | 107.5 | 103.8 |
| March | 107.4 | 106.2 | 108.0 | 106.3 |
| April | 107.9 | 106.0 | 108.6 | 107.8 |
| May | 108.6 | 106.7 | 109.4 | 108.0 |
| June | 109.4 | 107.0 | 110.6 | 107.9 |
| July | 109.9 | 107.2 | 111.1 | 109.0 |
| August | 110.2 | 107.0 | 111.4 | 109.7 |
| September | 110.5 | 107.6 | 111.8 | 109.4 |
| October | 111.2 | 107.8 | 112.3 | 112.2 |
| November | 111.6 | 107.8 | 112.7 | 113.4 |
| December | 112.2 | 108.3 | 113.5 | 113.7 |
| 2022 | ||||
| January | 112.8 | 109.0 | 113.8 | 114.9 |
| February | 113.5 | 110.0 | 114.2 | 116.6 |
| March | 114.7 | 110.7 | 115.5 | 117.9 |
| April | 115.9 | 110.9 | 116.9 | 120.4 |
| May | 116.7 | 111.5 | 117.3 | 123.4 |
| June | 117.1 | 111.7 | 118.0 | 123.2 |
| July | 117.5 | 112.5 | 118.1 | 124.8 |
| August | 117.5 | 112.3 | 118.3 | 123.2 |
| September | 118.0 | 112.4 | 119.1 | 123.4 |
| October | 119.0 | 112.9 | 119.9 | 125.6 |
| November | 119.7 | 114.2 | 120.3 | 127.3 |
| December | 120.1 | 114.7 | 120.9 | 126.6 |
| Source: Statistics Canada table 18-10-0004-01. | ||||
Despite higher wages and earnings, most workers have seen their purchasing power decline as inflationary pressures ramp up
- Average hourly wages, measured year-over-year, were up 5.1% December 2022, while average weekly earnings rose 4.2% in the 12 months to November.
- Higher-paid employees are more likely to have seen their wages keep pace with rising prices, including many in higher-paying sectors such as professional, scientific and technical services, and the finance, insurance and real estate industries.
- By contrast, the portion of workers receiving pay raises was relatively low in agriculture and accommodation and food services, industries with below-average wages.

Data table for Chart 14
| Consumer Price Index | Average hourly wage rate | |
|---|---|---|
| Index (January 2018=100) | ||
| 2018 | ||
| January | 100.0 | 100.0 |
| February | 100.6 | 100.2 |
| March | 100.9 | 100.3 |
| April | 101.2 | 100.3 |
| May | 101.3 | 99.9 |
| June | 101.4 | 99.7 |
| July | 102.0 | 99.1 |
| August | 101.9 | 99.1 |
| September | 101.5 | 100.7 |
| October | 101.8 | 101.1 |
| November | 101.4 | 101.2 |
| December | 101.3 | 101.5 |
| 2019 | ||
| January | 101.4 | 102.3 |
| February | 102.1 | 102.4 |
| March | 102.8 | 102.3 |
| April | 103.3 | 102.5 |
| May | 103.7 | 102.3 |
| June | 103.5 | 102.8 |
| July | 104.0 | 102.3 |
| August | 103.9 | 102.1 |
| September | 103.4 | 104.1 |
| October | 103.7 | 104.2 |
| November | 103.6 | 104.2 |
| December | 103.6 | 104.1 |
| 2020 | ||
| January | 103.9 | 105.2 |
| February | 104.3 | 105.8 |
| March | 103.7 | 108.7 |
| April | 103.0 | 113.2 |
| May | 103.3 | 112.6 |
| June | 104.2 | 110.1 |
| July | 104.2 | 108.9 |
| August | 104.0 | 108.6 |
| September | 103.9 | 109.3 |
| October | 104.4 | 110.0 |
| November | 104.6 | 109.5 |
| December | 104.3 | 109.7 |
| 2021 | ||
| January | 104.9 | 111.8 |
| February | 105.5 | 111.4 |
| March | 106.0 | 110.8 |
| April | 106.5 | 111.7 |
| May | 107.1 | 111.0 |
| June | 107.4 | 110.1 |
| July | 108.0 | 110.3 |
| August | 108.3 | 110.7 |
| September | 108.5 | 112.3 |
| October | 109.3 | 112.3 |
| November | 109.5 | 112.5 |
| December | 109.3 | 113.4 |
| 2022 | ||
| January | 110.3 | 114.9 |
| February | 111.5 | 114.4 |
| March | 113.1 | 114.3 |
| April | 113.7 | 115.3 |
| May | 115.3 | 115.1 |
| June | 116.1 | 115.6 |
| July | 116.2 | 115.1 |
| August | 115.9 | 116.0 |
| September | 115.9 | 117.7 |
| October | 116.8 | 118.3 |
| November | 116.9 | 118.9 |
| December | 116.2 | 118.8 |
|
Notes: Rising wages attributable to the changing composition of the workforce early in the COVID-19 pandemic. Annual wage growth: 4.8% and Headline consumer infaltion: 6.3%. Sources: Statistics Canada tables 14-10-0063-01 and 18-10-0004-01. |
||
Inflationary pressures weigh on more vulnerable households as incomes and savings adjust
- For low-income households, expenditures on necessities as a share of disposable income fell early in the pandemic as government support measures bolstered income levels and many households began to pay down debt.
- Financial vulnerabilities have re-emerged as income supports wound down and cost pressures rose. Overall, expenditures and debt rose more than income and assets in the third quarter of 2022, suggesting that increases in the cost of living are having a negative impact on net saving and wealth, especially for more vulnerable households.
- Low- and middle-income households have seen large reductions in their net savings, while younger households have become more leveraged.

Data table for Chart 15
| Lowest quintile | Third quintile | |
|---|---|---|
| percent | ||
| 1999 | 86.3 | 54.1 |
| 2000 | 89.4 | 55.1 |
| 2001 | 81.6 | 55.0 |
| 2002 | 87.6 | 55.0 |
| 2003 | 85.8 | 55.3 |
| 2004 | 90.4 | 54.6 |
| 2005 | 98.4 | 56.0 |
| 2006 | 97.9 | 53.5 |
| 2007 | 95.5 | 55.2 |
| 2008 | 100.1 | 53.7 |
| 2009 | 94.3 | 52.5 |
| 2010 | 98.9 | 52.4 |
| 2011 | 96.9 | 53.2 |
| 2012 | 95.2 | 54.1 |
| 2013 | 101.0 | 53.6 |
| 2014 | 102.7 | 55.8 |
| 2015 | 105.9 | 53.3 |
| 2016 | 104.8 | 52.9 |
| 2017 | 107.7 | 53.6 |
| 2018 | 103.7 | 53.1 |
| 2019 | 104.6 | 53.4 |
| 2020 | 80.4 | 47.4 |
| 2021 | 86.1 | 48.8 |
| 2022 Q1 | 102.4 | 44.4 |
| 2022 Q2 | 117.2 | 48.7 |
| 2022 Q3 | 90.0 | 42.9 |
|
Notes: Ovals indicate a time period where expenditure on food, housing and transportation are greater than 100% of disposable income (2013-2019 & Q1-Q2 2022). 2022 data presented as quarterly values as year end 2022 data is not yet available. Sources: Statistics Canada tables 36-10-0587-01 and 36-10-0662-01. |
||
Conclusion and key takeaways
- Inflationary pressures became increasingly widespread as the headline rate rose to a 40-year high, affecting a large portion of household outlays.
- High inflation, especially for food products, has put a severe strain on living costs, especially among more vulnerable households as income and saving levels adjust to the withdrawal in pandemic-related supports.
- Despite moderate increases in wages and earnings, most workers have seen their purchasing power decline as inflationary pressures ramp up.
- Date modified: