
Analysis in Brief
Analysis on supply chain challenges and conditions in Canada, first quarter of 2023
Skip to text
Text begins
Canadian businesses have been experiencing supply chain challenges since the beginning of the COVID-19 pandemic in early 2020 and exacerbated by the 2022 conflict in Ukraine. While these challenges have been significant, they have been abating throughout 2022. The proportion of businesses experiencing worsening supply chain conditions declined over the year, shining a spotlight on the strength, resilience, and optimism of Canadian supply chains. Nonetheless, the status of supply chains and the impact they have on the economy remain of great interest.
In 2022, widespread global supply constraints combined with pent-up consumer demand and the economic consequences of the conflict in Ukraine resulted in inflationary pressures for much of the year. While annual inflation was 0.7% in 2020 and 3.4% in 2021Note , it picked up speed in 2022. The Consumer Price Index (CPI) reached peak levels in June 2022 with an 8.1% increase, the largest annual change since January 1983.Note However, inflation gradually decreased to 5.9% year over year in January. On a monthly basis, the CPI rose 0.5% in January 2023 following a 0.6% decline in December. On a seasonally adjusted monthly basis, the CPI rose 0.3%.Note The relative easing in inflationary pressures toward the end of 2022 coincided with a decline in the proportion of businesses that experienced or expected to experience worsened supply chain challenges.
From the beginning of January to early February 2023, Statistics Canada conducted the Canadian Survey on Business Conditions to better understand the current environment within which businesses in Canada are operating and their expectations moving forward. Based on the results of the survey, fewer businesses expected supply chain challenges than the previous quarter. Businesses experiencing supply chain challenges were less likely to report these challenges as worsening. Additionally, fewer businesses expected worsening supply chain challenges in the short term, compared to the previous quarter. However, the leading factors that contributed to worsened supply chain challenges over the last three months remained the same from the previous quarter. This article provides insights on the topic of supply chain challenges and the impacts of these issues on businesses in Canada.
Fewer businesses expected supply chain challenges
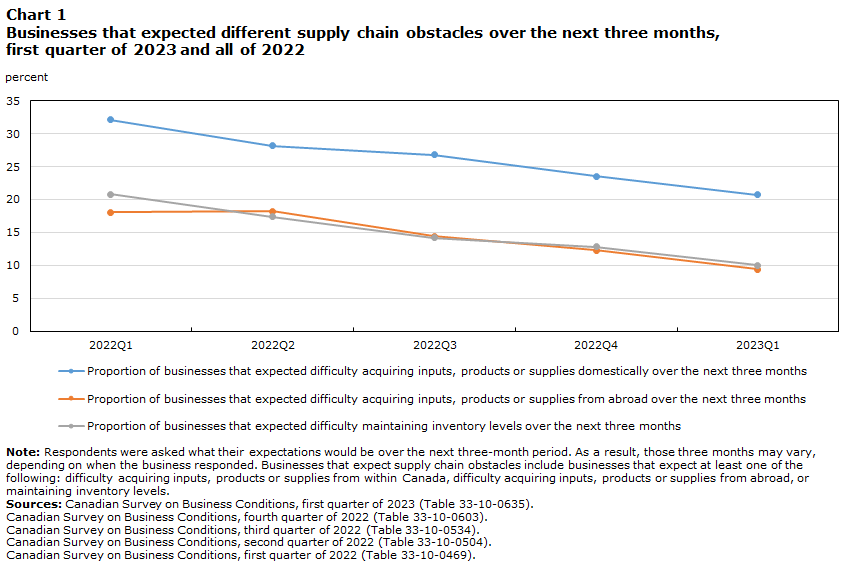
One in ten (10.0%) businesses expected maintaining inventory levels to be an obstacle over the next three months.Note This number has decreased from the previous quarter, when over one-tenth (12.8%) of businesses expected maintaining inventory levels to be an obstacle. However, this remains a significant obstacle in some industries. Nearly one quarter of businesses in retail trade (24.9%) and wholesale trade (24.7%) expect maintaining inventory levels to be a challenge over the next three months. These businesses planned to respond to these difficulties in various ways, with close to half (49.1%) planning to raise selling prices for goods and services offered, and over three-tenths planning to: find alternate inputs (35.8%); hold higher-than-usual level of inventories as a precaution against future shortages (33.6%); and improve inventory tracking to plan timing of purchases (32.0%).
Among businesses that expected maintaining inventory levels to be a challenge over the next three months, over two-fifths (45.5%) expected these difficulties to continue for six months or more, a significant decrease from the previous quarter (56.3%). Businesses in administrative and support, waste management and remediation services (65.1%) and manufacturing (58.2%) were most likely to expect maintaining inventory levels to be a challenge for 6 months or more. Conversely, over one-third (34.9%) of businesses expecting maintaining inventory levels to be an obstacle over the next three months were uncertain how long these challenges will persist.
One-fifth (20.7%) of businesses expected difficulty acquiring inputs, products or supplies domestically over the next three months. This proportion has decreased from the previous quarter, when close to one-quarter (23.5%) of businesses anticipated challenges in this regard. Furthermore, this decline has been observed since the first quarter of 2022. Businesses in construction (36.7%) and manufacturing (32.3%) were most likely to expect this obstacle.
Data table for Chart 1
| Supply chain obstacle faced by businesses |
2022Q1 | 2022Q2 | 2022Q3 | 2022Q4 | 2023Q1 |
|---|---|---|---|---|---|
| percent | |||||
| Proportion of businesses that expected difficulty acquiring inputs, products or supplies domestically over the next three months | 32.1 | 28.2 | 26.8 | 23.5 | 20.7 |
| Proportion of businesses that expected difficulty acquiring inputs, products or supplies from abroad over the next three months | 18.1 | 18.2 | 14.4 | 12.3 | 9.4 |
| Proportion of businesses that expected difficulty maintaining inventory levels over the next three months | 20.8 | 17.4 | 14.2 | 12.8 | 10.0 |
|
Note: Respondents were asked what their expectations would be over the next three-month period. As a result, those three months may vary, depending on when the business responded. Businesses that expect supply chain obstacles include businesses that expect at least one of the following: difficulty acquiring inputs, products or supplies from within Canada, difficulty acquiring inputs, products or supplies from abroad, or maintaining inventory levels. Sources: Canadian Survey on Business Conditions, first quarter of 2023 (Table 33-10-0635). Canadian Survey on Business Conditions, fourth quarter of 2022 (Table 33-10-0603). Canadian Survey on Business Conditions, third quarter of 2022 (Table 33-10-0534). Canadian Survey on Business Conditions, second quarter of 2022 (Table 33-10-0504). Canadian Survey on Business Conditions, first quarter of 2022 (Table 33-10-0469). |
|||||
Among businesses expecting difficulty acquiring inputs, products or supplies domestically, close to half (48.6%) expected these challenges to continue for six months or more, down from the previous quarter (56.0%). Meanwhile, nearly two-fifths (39.2%) of businesses are uncertain how long these challenges will persist, an increase from the previous quarter (30.8%).
| Q42022 | Q12023 | |
|---|---|---|
| % of businesses | ||
| Maintaining inventory levels | 56.3 | 45.5 |
| Difficulty acquiring inputs, products or supplies domestically | 56.0 | 48.6 |
| Difficulty acquiring inputs, products or supplies from abroad | 61.3 | 56.2 |
|
Note: The results in this table are based on the survey that was in collection from January 3 to February 6, 2023, and respondents were asked what their expectations would be over the next three-month period. As a result, those three months could range from January 3 to May 6, 2023, depending on when the business responded. Respondents were asked if the business or organization expected various obstacles over the next three months. If they reported that they expected difficulty acquiring inputs, products or supplies from within Canada or abroad or maintaining inventory levels as obstacles, they were asked how long they expected these to continue being an obstacle. Source: Canadian Survey on Business Conditions, first quarter of 2023 (Table 33-10-0638 ). Canadian Survey on Business Conditions, fourth quarter of 2022 (Table 33-10-0605). |
||
Less than one-tenth (9.4%) of businesses expected difficulty acquiring inputs, products or supplies from abroad over the next three months, a decrease from 12.3% of businesses in the previous quarter. Over one-fifth of businesses in wholesale trade (23.7%) and manufacturing (20.1%) expected to experience this challenge. Of businesses expecting these difficulties over the next three months, over half (56.2%) expected these challenges to continue for six months or more, down from the previous quarter (61.3%). At the same time, over three-tenths (31.3%) are uncertain how long these challenges will persist.
Expectations related to supply chain challenges continued to improve
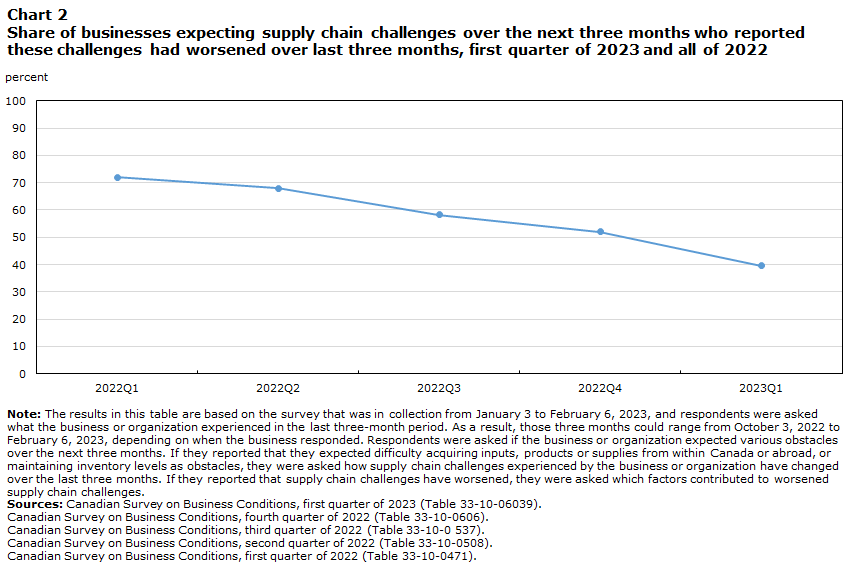
Among businesses that expected supply chain challenges over the next three months, close to two-fifths (39.6%) reported these challenges had worsened over the last three months.Note This figure has significantly decreased from the previous quarter (52.0%), the fourth straight quarter of decline since the first quarter of 2022.
Businesses in other services (except public administration) (56.4%), accommodation and food services (56.0%), and information and cultural industries (52.2%) were the most likely to report that supply chain challenges have worsened over the last three months.
Data table for Chart 2
| Change experienced in supply chain challenges | 2022Q1 | 2022Q2 | 2022Q3 | 2022Q4 | 2023Q1 |
|---|---|---|---|---|---|
| percent | |||||
| Proportion of businesses that reported supply chain challenges experienced have worsened over the last three months | 71.9 | 67.9 | 58.2 | 52.0 | 39.6 |
|
Note: The results in this table are based on the survey that was in collection from January 3 to February 6, 2023, and respondents were asked what the business or organization experienced in the last three-month period. As a result, those three months could range from October 3, 2022 to February 6, 2023, depending on when the business responded. Respondents were asked if the business or organization expected various obstacles over the next three months. If they reported that they expected difficulty acquiring inputs, products or supplies from within Canada or abroad, or maintaining inventory levels as obstacles, they were asked how supply chain challenges experienced by the business or organization have changed over the last three months. If they reported that supply chain challenges have worsened, they were asked which factors contributed to worsened supply chain challenges. Sources: Canadian Survey on Business Conditions, first quarter of 2023 (Table 33-10-06039). Canadian Survey on Business Conditions, fourth quarter of 2022 (Table 33-10-0606). Canadian Survey on Business Conditions, third quarter of 2022 (Table 33-10-0 537). Canadian Survey on Business Conditions, second quarter of 2022 (Table 33-10-0508). Canadian Survey on Business Conditions, first quarter of 2022 (Table 33-10-0471). |
|||||
For these businesses, the leading factors that contributed to worsened supply chain challenges over the last three months were increased prices of inputs, products or supplies (81.7%); increased delays in deliveries of inputs, products or supplies (78.7%), and supply shortages resulting in fewer inputs, products or supplies being available (72.9%). These were also the leading factors in the previous quarter (79.7%, 80.4%, and 75.0% respectively).
Under half (48.0%) of businesses that expected supply chain challenges over the next three months reported that these challenges have remained about the same over the last three months, an increase from the previous quarter (41.1%). Over one in ten (12.4%) businesses said that supply chain challenges have improved over the last three months, compared to 6.9% in the previous quarter. For the fourth straight quarter, among businesses that expected to experience supply chain challenges, there was a decline in the proportion of businesses that expected these to worsen over the next three months, from 43.4% in the first quarter of 2022 to 20.3% in the current quarter. The proportion of businesses that expected these challenges to improve over the next three months was relatively unchanged from the previous quarter (12.4%) to this quarter (12.8%).
Planned adjustments to supply chains
In the first quarter of 2023, among businesses that expected to experience supply chain challenges, close to one-third planned to partner with new suppliers (32.1%), while close to three-tenths planned to substitute inputs, products or supplies with alternate inputs, products or supplies (29.1%) and work with suppliers to improve timeliness (28.4%).
Additionally, over one-fifth (23.5%) of businesses were uncertain of plans to adjust their supply chain, and one-fifth (20.2%) had no plans to adjust their supply chain over the next 12 months.
Methodology
From January 3 to February 6, 2023, representatives from businesses across Canada were invited to take part in an online questionnaire about business conditions and business expectations moving forward. The Canadian Survey on Business Conditions uses a stratified random sample of business establishments with employees classified by geography, industry sector, and size. An estimation of proportions is done using calibrated weights to calculate the population totals in the domains of interest. The total sample size for this iteration of the survey is 30,554 and results are based on responses from a total of 15,963 businesses or organizations.
References
Statistics Canada. 2023. Canadian Survey on Business Conditions, first quarter of 2023.
- Date modified: