
Police-reported crime statistics in Canada, 2025
Released: 2026-07-22
75.0
2025
-4.9% 
(annual change)
5,585
2025
-2.4%
(annual change)
97.2
2025
-4.2%
(annual change)
66.8
2025
-5.3%
(annual change)
2,694
2025
-3.8%
(annual change)
88.7
2025
-3.6%
(annual change)
7,222
2025
-7.0%
(annual change)
100.2
2025
4.0% 
(annual change)
84.9
2025
-6.8%
(annual change)
2,598
2025
-31.0%
(annual change)
68.4
2025
-5.8%
(annual change)
5,492
2025
-7.9%
(annual change)
71.6
2025
-10.5%
(annual change)
67.7
2025
-3.7%
(annual change)
1,859
2025
-12.7%
(annual change)
73.0
2025
-3.3%
(annual change)
6,147
2025
0.8%
(annual change)
89.8
2025
-5.6%
(annual change)
66.9
2025
-2.1%
(annual change)
2,789
2025
-4.0%
(annual change)
90.4
2025
5.6%
(annual change)
6,200
2025
0.5%
(annual change)
108.6
2025
8.9%
(annual change)
83.8
2025
4.0%
(annual change)
2,192
2025
-5.5%
(annual change)
61.6
2025
-5.1%
(annual change)
3,673
2025
-3.9%
(annual change)
98.0
2025
-0.9%
(annual change)
47.5
2025
-8.2%
(annual change)
3,364
2025
4.1%
(annual change)
57.2
2025
-6.2%
(annual change)
4,296
2025
-3.7%
(annual change)
74.9
2025
-8.7%
(annual change)
50.6
2025
-4.7%
(annual change)
2,142
2025
-3.9%
(annual change)
130.0
2025
-8.8%
(annual change)
9,812
2025
-3.9%
(annual change)
194.6
2025
-10.5%
(annual change)
105.4
2025
-7.6%
(annual change)
4,345
2025
-16.6%
(annual change)
146.6
2025
-5.0%
(annual change)
11,938
2025
-5.0%
(annual change)
194.3
2025
-3.3%
(annual change)
128.8
2025
-6.0%
(annual change)
5,074
2025
-16.8%
(annual change)
90.6
2025
-6.6%
(annual change)
7,390
2025
-0.7%
(annual change)
102.0
2025
-5.5%
(annual change)
86.8
2025
-7.1%
(annual change)
2,427
2025
-1.5%
(annual change)
92.4
2025
-1.6%
(annual change)
6,943
2025
0.3%
(annual change)
98.0
2025
2.2%
(annual change)
90.9
2025
-3.2%
(annual change)
2,164
2025
-1.5%
(annual change)
195.4
2025
-6.1%
(annual change)
19,234
2025
-10.8%
(annual change)
236.0
2025
5.8%
(annual change)
180.9
2025
-11.3%
(annual change)
5,849
2025
-15.6%
(annual change)
485.9
2025
-7.5%
(annual change)
49,536
2025
-7.9%
(annual change)
556.3
2025
-3.2%
(annual change)
461.8
2025
-9.4%
(annual change)
5,887
2025
-21.7%
(annual change)
461.2
2025
9.5%
(annual change)
57,617
2025
6.2%
(annual change)
719.0
2025
8.2%
(annual change)
362.1
2025
10.6%
(annual change)
10,465
2025
-6.2%
(annual change)
Overview
In Canada, police-reported crime is typically measured using two primary indicators: the conventional crime rate, which has historically been the standard measure of crime volume relative to the population, and the Crime Severity Index (CSI), which measures both crime volume relative to the population and the relative severity of all police-reported crimes by assigning greater weight to more serious offences.
In 2025, the CSI decreased 5% to a value of 75.01. This marked the second consecutive annual decrease, following an upward trend beginning in 2015 that reached 81.27 in 2023.
The conventional crime rate—comprising Criminal Code offences but excluding traffic offences—declined 2% to 5,585 incidents per 100,000 population in 2025. When compared with the CSI, this suggests that the overall severity of crime declined more than the volume of crime, as there was a steeper percentage decline in the CSI.
The CSI reflects changes in the volume of crime relative to the population, the average severity of crime, or both. It was standardized to a value of 100 in 2006, which serves as a baseline for comparisons over time. The CSI can also be used to examine annual changes in the combined volume and severity of police-reported crime. Values have ranged from a low of 66.90 in 2014 to a high of 118.84 in 1998, the first year for which CSI data are available. In 2025, the CSI was 37% lower than the peak in 1998 and 25% lower than the 2006 base year.
Introduced in 2009, the CSI was designed to complement the conventional crime rate, which measures the number of police-reported crimes relative to the population but assigns equal weight to all crimes. While the crime rate remains an important historical measure of overall crime volume, it is less sensitive to changes in relatively infrequent but more serious crimes. The CSI addresses this limitation by weighting all crimes according to their severity while still accounting for the volume of police-reported crime. Developed through extensive consultation and methodological testing, the CSI is a key indicator under the Good Governance domain of Canada's Quality of Life Framework. For more information on the CSI and the measurement of police-reported crime, see Understanding and using the police-reported Crime Severity Index and the Note to readers.
This release is intended to provide a high-level overview of police-reported crime in Canada for 2025 and does not necessarily capture all long-term trends, regional variation or violation-specific patterns.
Additional contextual or detailed information can be found in previously published analytical products linked in the Note to readers, the accompanying online data tables, and the tables included at the end of this release.
The accompanying infographic, "Police-reported crime in Canada, 2025," is also now available. Additionally, police-reported crime data for 2025 will be available shortly after this release in interactive data visualization dashboards through the Police-reported Information Hub.
The decline in the overall CSI in 2025 reflected decreases in the violent CSI (-4%) and the non-violent CSI (-5%). While both recorded similar percentage-point decreases, non-violent crimes continued to account for a larger share (63%) of the CSI.
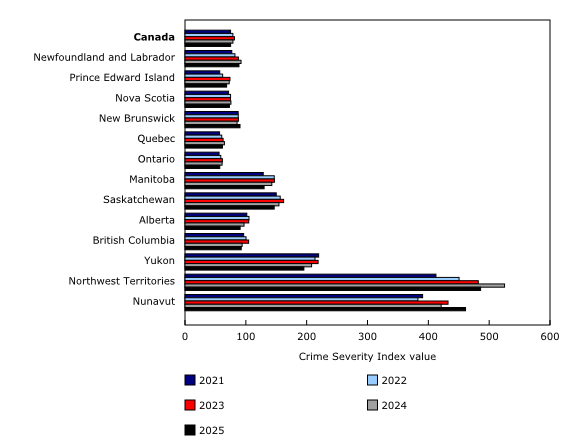
A decline in the CSI was observed across all provinces and territories in 2025, except in New Brunswick (+6%) and Nunavut (+10%). Similarly, most of Canada's census metropolitan areas also recorded declines.
Chart 1

Police-reported Crime Severity Indexes, Canada, 1998 to 2025
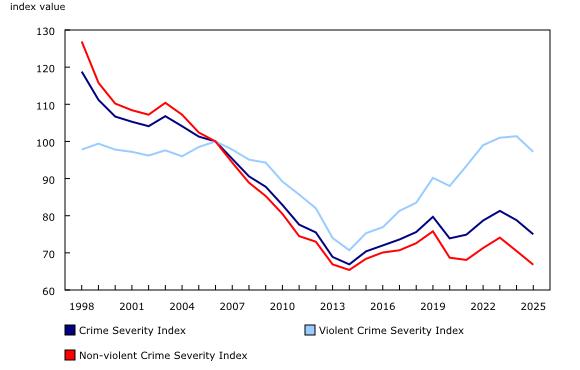
Chart 2
Police-reported crime rates, Canada, 1962 to 2025
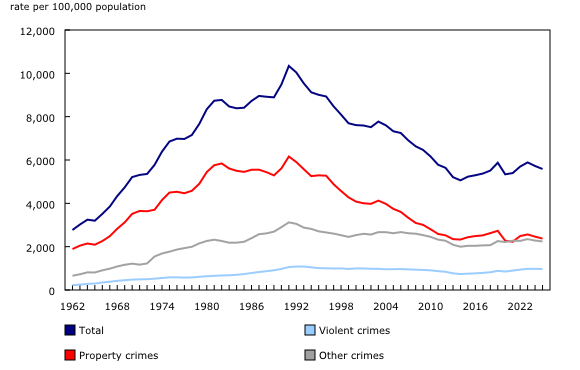
Chart 3
Police-reported Crime Severity Index, by province and territory, 2021 to 2025
Key national trends in police-reported crime in 2025
The following sections examine changes in the rates of police-reported violations that contributed most to the annual change in the CSI, including theft-related violations, fraud and extortion, and child sexual abuse and exploitation material violations. They also examine other indicators of crime and public safety, such as homicide and hate crime.
Rate of breaking and entering down for third consecutive year, and the largest contributor to the decline in the Crime Severity Index
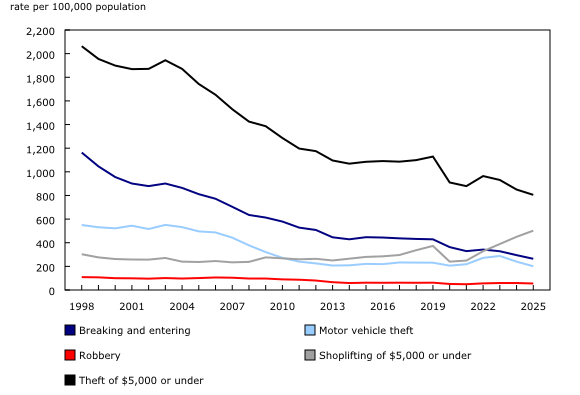
Breaking and entering—the most severe property crime based on its weight in the CSI—had the largest impact on the decline in the CSI in 2025. The police-reported rate declined 11% to 264 incidents per 100,000 population, or 109,753 incidents. The rate was down in all provinces and territories.
The rate of breaking and entering has been steadily declining over time. The rate in 2025 was 41% lower than in 2015, and 77% lower than in 1998, the first year with comparable data.
Motor vehicle theft down for the second consecutive year, following three consecutive years of increases
In 2025, the rate of motor vehicle theft fell 16% to 201 incidents per 100,000 population, or 83,652 incidents. It fell at the same rate as in 2024, which was preceded by three annual increases. Additionally, the rate in 2025 was 9% lower than in 2015, and 64% lower than its peak in 2003.
Shoplifting up for the fifth consecutive year, while other minor theft down for the third consecutive year
Despite the overall decline in the CSI, rates for some violations increased in 2025. For the second year in a row, shoplifting of $5,000 or under was the largest contributor to offset the decrease in the CSI.
Police reported 208,941 incidents of shoplifting in 2025, a rate of 502 incidents per 100,000 population, up 11% from 2024. The rate of shoplifting has increased for five years in a row from 2020 to 2025 and by more than three-quarters (+79%) from 2015 to 2025.
In contrast, other theft of $5,000 or under (minor theft) was down 5% in 2025. This was the third consecutive decrease and the rate in 2025 was down more than one-quarter (-26%) from 2015. Despite the opposing trends, the rate of minor theft in 2025 was 1.6 times higher than that of shoplifting, with 805 incidents per 100,000 population.
Chart 4
Selected police-reported property crimes and robbery, Canada, 1998 to 2025
Police-reported rate of child sexual abuse and exploitation material down for second consecutive year, but reporting is impacted by case processing and investigative complexity
The rate of child sexual abuse and exploitation material (CSAEM) incidents, formerly known as child pornography, declined 21% in 2025, to a rate of 36 incidents per 100,000 population, or 15,075 incidents total. This marked the second consecutive annual decrease, following a sharp increase in 2023 (+54%). The decline in 2025 was the second largest contributor to the decrease in the CSI. Similar to previous years, making or distributing CSAEM accounted for the majority (61%) of these incidents in 2025, while the remaining 39% were possessing or accessing CSAEM.
When interpreting annual changes, police-reported incidents of CSAEM undercount the occurrence of these crimes in Canada. Annual counts and trends likely reflect the number of investigations (active or closed), rather than all identified cases. Due to a substantial increase in case volume and complexity—including the use of generative artificial intelligence and high volumes of text-based content—police services may lack the resources to investigate all identified cases and may encounter broader investigative challenges (for example, legal thresholds for warrants, IP address privacy limitations, and the complexity of cybercrime investigations). For more information, see the Note to readers and Online child sexual exploitation: A statistical profile of police-reported incidents in Canada, 2024.
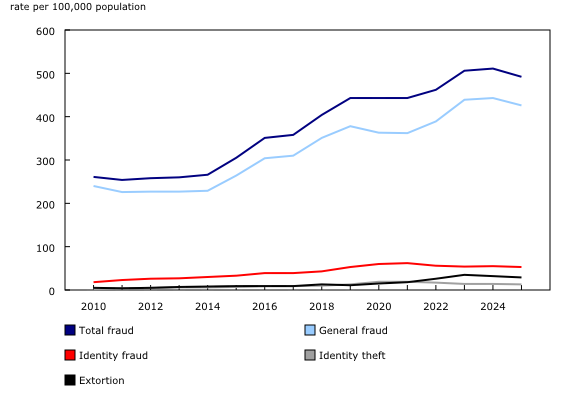
Rate of total fraud down following decade-long upward trend, while extortion declines for the second consecutive year
In 2025, the police-reported rate of total fraud (comprising general fraud, identity theft and identity fraud) decreased 4% to 492 incidents per 100,000 population. However, this rate was 61% higher than in 2015.
Often associated with fraud, extortion is a violent crime that involves obtaining property through coercion. The police-reported rate of extortion decreased for the second consecutive year, down 10% to 29 incidents per 100,000 population in 2025. However, the rate was over three times higher in 2025 than a decade earlier (9 incidents per 100,000 population in 2015).
Despite the relative volume of fraud and extortion, many of these crimes go unreported to police.
Chart 5
Fraud and extortion, police-reported rates, Canada, 2010 to 2025
Decline in police-reported hate crime, following lengthy upward trend
A hate crime may target a person or property and is motivated in whole or in part by factors such as race, colour, national or ethnic origin, religion, sexual orientation, gender identity or expression, language, sex, age, mental or physical disability, or other similar factors.
The number of police-reported hate crimes decreased 3%, from 4,841 incidents in 2024 to 4,708 incidents in 2025. Prior to 2025, the number of hate crimes had more than doubled (+166%) from 2018 to 2024. Expressed as a rate, police-reported hate crimes declined 4% in 2025 to 11 incidents per 100,000 yet were more than twice as high as in 2018 (5 incidents).
The decline in the number of incidents in 2025 was in large part the result of fewer hate crimes targeting religion (-18% to 1,115 incidents) and those targeting sexual orientation (-19% to 534 incidents). In contrast, hate crimes targeting race or ethnicity were essentially stable (2,391 incidents in 2025, 1 fewer than in 2024), while those targeting other motivations (such as hate crimes targeting mental or physical disability, language, sex or gender, age, or immigrants or newcomers to Canada) were up 52%, to 562 incidents.
Detailed information on hate crimes can be found in table 6 and in online data tables 35-10-0066, 35-10-0067 and 35-10-0191.
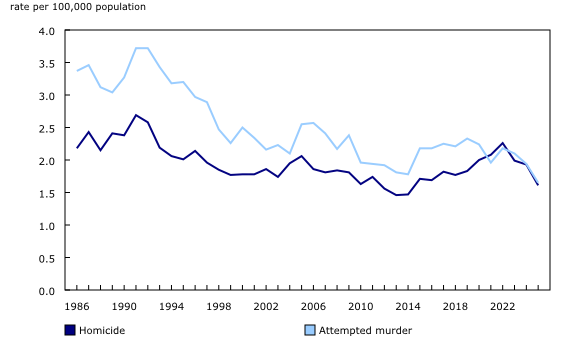
National homicide rate declines for the third consecutive year
Police reported 672 homicides in 2025, 125 fewer than a year earlier. This represented 1.61 homicides per 100,000 population, down 16% from 1.93 in 2024. It was the largest year-over-year decline since 1986, resulting in the lowest rate since 2014.
Among homicide victims in 2025, there were 175 women and girls, 67 fewer than in 2024, while the number of men and boys decreased by 53 to 494 victims. There were three victims of unknown gender in 2025, five fewer than the previous year. While men and boys accounted for the majority (74%) of homicide victims, women were disproportionately killed by their spouses or intimate partners (41% versus 5%).
Continued decrease in gang-related homicides
Gang-related homicides dropped from 155 in 2024 to 119 homicides in 2025, a rate of 0.29 homicides per 100,000 population. These accounted for less than one-fifth (18%) of all homicides. The decline was driven largely by fewer gang-related homicides involving a handgun (-39%), down from 79 homicides in 2024 to 48 in 2025. Overall, homicides committed with a handgun fell 31%.
Homicide victimization rate continues to be higher among Indigenous people than non-Indigenous people
In 2025, the homicide victimization rate among Indigenous people (9.59 homicides per 100,000 Indigenous population) was approximately eight times higher than that of the non-Indigenous population (1.13 homicides per 100,000 non-Indigenous population).
See the Note to readers for information on homicide victim identification and links to tables with detailed characteristics of homicides.
Chart 6
Attempted murder and homicide, police-reported rates, Canada, 1986 to 2025
Note to readers
Related context and information
Police-reported crime statistics can be affected by many factors, including reporting behaviour by the public, proactive policing, police resources and practices, public awareness, and legislative changes. As such, they should be interpreted alongside other sources of information. Police-reported data also only reflect incidents that come to the attention of police.
Self-reported victimization data provide a complementary source of information on Canadians' experiences of crime, including incidents not reported to police. For example, in 2019, about 3 in 10 Canadians (29%) indicated that the victimization that they or their household experienced was reported to police. Reporting varied widely depending on the type of crime, from about half of all motor vehicle thefts, break and enters, and robberies, to 6% of sexual assaults.
Readers interested in related topics not covered in this release, or in a broader view of the justice system, may consult previously released products, primarily through the Juristat publication, covering topics such as family and intimate partner violence, the sex trade, trafficking in persons, firearms and violent crime, drug-related crime, urban and rural crime characteristics, self-reported victimization, key indicators for Canadian criminal courts and correctional services, and comparisons between crime in Canada and the United States.
Uniform Crime Reporting Survey
Police-reported crime data (other than detailed information on homicides) are drawn from the Uniform Crime Reporting (UCR) Survey, a census of all crime known to police services in Canada. As of 2025, data cover 99.6% of the Canadian population. Coverage for each province and territory is as follows: Newfoundland and Labrador (100%), Prince Edward Island (100%), Nova Scotia (100%), New Brunswick (90.9%), Quebec (99.3%), Ontario (99.9%), Manitoba (99.8%), Saskatchewan (98.9%), Alberta (100%), British Columbia (100%), Yukon (98.4%), the Northwest Territories (99.2%) and Nunavut (100%). Police-reported crime statistics conform to a nationally approved set of common crime categories (violations) and definitions. Differences in local police service policies, procedures and enforcement practices can affect the comparability of crime trends.
There are two primary versions of the UCR collection instrument that operate simultaneously: the Aggregate UCR1 Survey and the Incident-Based UCR2 Survey. The UCR1 collects summary data by offence type and has been collected since 1962, permitting a longer historical comparison than the UCR2. The UCR2, introduced in 1988, collects more detailed information (microdata) on incidents, victims and accused persons, and includes a more detailed set of violation categories. The majority of the information presented in this release uses aggregate outputs produced using UCR2 data, with UCR1 offence codes mapped to UCR2 violations codes where possible and imputed where necessary.
Revisions to the UCR Survey are accepted for a one-year period after the data are initially released. For example, when the 2025 crime statistics are released, the 2024 data are updated with any revisions that have been made from May 2025 to May 2026. The data are revised only once and are then permanently frozen. Over the past 10 years, data have been revised upward 10 times, with an average annual revision of 0.52%. Additionally, the 2024 revision to counts of people charged and youth not charged resulted in a 0.60% increase to 2024 counts.
See "Definitions" for detailed explanations of common concepts and terminology used in the analysis of police-reported crime information.
In this release, percent change calculations are based on unrounded numbers.
Understanding and using the Crime Severity Index
The conventional crime rate and the Crime Severity Index (CSI) are two complementary ways to measure police-reported crime. The crime rate measures the volume of crime per 100,000 population, comprising all Criminal Code violations (except traffic violations). The CSI measures both the volume and the severity of crime and includes all Criminal Code and other federal statute violations. The CSI has a base index value of 100 for 2006. Both the conventional crime rate and the CSI measure crime based on the most serious violation in the criminal incident.
The CSI is not intended to be used in isolation or as a universal indicator of overall safety. It is best understood in a broad context with other information from the justice system continuum, as well as other characteristics, such as population and demographics, labour market conditions and activities, employment and income, and housing and families.
For more information on concepts and the use of the CSI, see "Measuring crime in Canada: Introducing the Crime Severity Index and improvements to the Uniform Crime Reporting Survey" (85-004-X) and the suite of products for Understanding and using the Crime Severity Index, including a video, an accompanying infosheet and reference document, and a webinar recorded in July 2024.
Measuring police-reported shoplifting
In the Uniform Crime Reporting (UCR) Survey, shoplifting has been collected as a distinct violation code for statistical reporting purposes, allowing it to be analyzed separately from other thefts. The classification of an incident as shoplifting is based on information gathered by police through their investigation and reported to the UCR Survey. Shoplifting is not a separate offence under the Criminal Code and is included within the broader offence of theft.
While shoplifting may be considered a relatively minor offence, it may result in considerable financial loss for businesses. Additionally, online reporting of shoplifting may also contribute to an increase in police-reported incidents relative to other thefts.
Challenges around measuring police-reported child sexual abuse and exploitation material
Section 163.1 of the Criminal Code makes it illegal to access, possess, make, print or distribute child sexual abuse and exploitation material (CSAEM).When there is no victim identified, these offences are reported to the UCR Survey with the most serious violation recorded as CSAEM, which is typically categorized under "other Criminal Code violations." In incidents where a victim is identified, police will report the most serious violation as sexual assault, sexual exploitation or other sexual violations against children, which are categorized as crimes against the person—"violent crimes"—and CSAEM may be reported as a secondary violation.
It is important to note that variations in rates between years may reflect differences in the recognition, reporting, and investigation of CSAEM incidents, and not necessarily lower or higher rates of occurrence. Year-over-year differences in reporting may be influenced by a variety of factors, such as the presence or absence of public awareness campaigns, community engagement and the willingness of the public to report incidents to police. Additionally, police resources, policies and the investigational complexities of CSAEM in particular, and child sexual exploitation more generally, can have a considerable impact on police-reported metrics.
The Royal Canadian Mounted Police's National Child Exploitation Crime Centre (NCECC) serves as the primary point of contact in Canada for investigations related to the sexual exploitation of children on the Internet. A substantial increase in the volume and complexity of CSAEM and other cases has placed significant strain on the NCECC and police services, limiting their ability to respond to growing investigative demands.
Additionally, the Supreme Court of Canada's recent decision in R. v. Bykovets (2024 SCC 6)—which held that there is a reasonable expectation of privacy attached to IP addresses under section 8 of the Canadian Charter of Rights and Freedoms—may have impacted cybercrime investigations, where IP address information is often the only known identifier. As a result of this decision, police are required to obtain prior judicial authorization (i.e., a warrant or production order) before they can ask third parties (i.e., Internet Service Providers) for subscriber information linking the IP address to an individual. This requirement can hinder or halt investigations, meaning that the number of incidents recorded in police Records Management Systems—and subsequently reported to the UCR Survey—may underestimate the prevalence of this crime.
Only cases captured in a police Records Management System are reported through the UCR Survey, meaning that all other cases—including those waiting to be actioned by the NCECC and police of jurisdiction—are excluded from police-reported data. Therefore, police-reported data on CSAEM likely reflect the number of police investigations for the year and not the full extent of this crime in Canada.
Homicide Survey
Detailed information on the characteristics of homicide victims and accused persons is drawn from the Homicide Survey, which collects police-reported information on the characteristics of all homicide incidents, victims and accused persons in Canada. This survey began collecting information on all murders in 1961 and was expanded in 1974 to include all incidents of manslaughter and infanticide. The term "homicide" is used to refer to each single victim of homicide. For instance, a single incident can have more than one victim. In this release, each victim is counted as a homicide.
Detailed information on the characteristics of homicides such as rates across geographies, method of death and gang-relation, and the characteristics of victims and accused persons, such as Indigenous identity or racialized group information, age, gender and relationship to the accused can be found in online data tables. An analytical report summarizing some of this more detailed information will also be released in the fall.
Indigenous identity and the Homicide Survey
Indigenous identity is reported by police to the Homicide Survey and is determined through information found with the victim or accused person, such as status cards, or through information supplied by victims' families, by community members or from other sources (i.e., band records). Forensic evidence such as genetic testing results may also be an acceptable means of determining the Indigenous identity of victims. Given the potential limitations of secondary identification, victim identification may be underreported.
For the purposes of the Homicide Survey, Indigenous identity includes people identified by police as First Nations people (status or non-status), Métis or Inuit, and Indigenous people whose Indigenous group is not known to police. Non-Indigenous identity refers to instances where the police have confirmed that a victim is not an Indigenous person. Indigenous identity reported as "unknown" by police includes instances where police are unable to determine the Indigenous group of the victim or where the Indigenous group is not collected by the police service.
Indigenous peoples in Canada continue to face a disproportionate risk of homicide, which is deeply rooted in the historical and present-day effects of colonization, including systemic discrimination, poverty and intergenerational trauma.
For more information and context on homicides and victimization among Indigenous people, see for example, the following sources: "Violent victimization and perceptions of safety: Experiences of First Nations, Métis and Inuit women in Canada" and "Victimization of First Nations people, Métis and Inuit in Canada." Furthermore, additional context on the historical and present-day effects of colonization, including systemic discrimination, poverty and intergenerational trauma can be found in the following sources: "Reclaiming power and place: The Final Report on the National Inquiry into Missing and Murdered Indigenous Women and Girls" and "Honouring the truth, reconciling for the future: Summary of the final report of the Truth and Reconciliation Commission of Canada."
Products
Data for 2025 will be available on July 29, 2026, in the interactive data visualization dashboards "Police-reported Information Hub: Selected Crime Indicators," "Police-reported Information Hub: Criminal Violations," "Police-reported Information Hub: Geographic Crime Comparisons," "Police-reported Information Hub: Hate crime in Canada," and "Police-reported Information Hub: Homicide in Canada," available through the "Police-reported Information Hub" as part of the publication Statistics Canada – Data Visualization Products (71-607-X).
The infographic "Police-reported crime in Canada, 2025" (11-627-M) is also released today.
Additional data, such as detailed microdata, are available upon request.
Contact information
For more information, or to enquire about the concepts, methods or data quality of this release, contact us (toll-free 1-800-263-1136; 514-283-8300; infostats@statcan.gc.ca) or Media Relations (statcan.mediahotline-ligneinfomedias.statcan@statcan.gc.ca).
- Date modified: