
Self-reported fraud in Canada, 2019
Highlights
- Of all crimes measured by the 2019 General Social Survey (GSS) on Canadians’ Safety, fraud is the most common. In 2019, 2.5 million people reported being the victim of fraud in the previous 12 months, or 7.8% of the Canadian population aged 15 and older.
- In the five years preceding the survey, 17% of the population experienced at least one fraud. The proportion was highest in Alberta (22%), whereas people living in Nunavut (8.6%), New Brunswick (13%), Newfoundland and Labrador (13%), Nova Scotia (14%) and Quebec (14%) were the least likely to have experienced fraud.
- The financial losses reported by all victims of fraud in the five years preceding the GSS were over $16 billion. Approximately one-quarter of victims of fraud lost at least $1,000.
- First Nations people, Inuit and francophones were less likely to report having been a fraud victim in the five years preceding the GSS. However, immigrants, persons with disabilities, people with a high personal income or level of education, and people who have had difficult experiences were more likely to have been victims of fraud.
- Fraud is one of the crimes least likely to be reported to the police. Approximately 1 fraud victim in 10 (11%) reported the most serious fraud to the police, a proportion that varied from 6% in Manitoba to 17% in Saskatchewan. However, a number of victims reported the incident to another organization, such as the Canadian Anti-Fraud Centre (7%) or the bank or credit card issuing company (65%).
- Victims aged 65 and older, people with a physical or mental disability, and victims with high financial losses were more likely to have reported the fraud to the police. In contrast, LGBTQ2+ people were less likely to have alerted the police.
- Among crimes recorded by police, fraud has seen the greatest increase in number of incidents since 2011, rising from 87,174 incidents in 2011 to 168,483 incidents in 2021. In 2011, fraud represented 6.5% of the Crime Severity Index, a proportion that reached 12% in 2021. It also represented more than half of cybercrime in 2021.
- Extortion, which is often associated with fraud has seen its rate quadruple since 2011 according to police-reported data. Extortion rose from 4.4 incidents per 100,000 population in 2011 to 17.6 incidents per 100,000 population in 2021.
- The police-reported fraud rate has stabilized since 2019 because of the drop in payment card and cheque fraud, likely due to changes in consumption habits during the COVID-19 pandemic. However, fraudulent government claims, such as those related to the Canada Emergency Response Benefit, increased during this period.
- Approximately three-quarters (73%) of the population felt that fraud had increased in the five years preceding the GSS, while about the same proportion felt that crime in general is stable.
Introduction
Over the past 20 years, police-reported crime has declined for most offences in Canada. Overall, the crime rate declined by 29% between 2001 and 2021. However, some offences do not follow this general trend.
The development of new technologies, and especially the widespread use of the Internet, have changed the way we interact, consume and work. These changes have also disrupted the way crime manifests itself, with technologies providing criminals with new opportunities (Canadian Anti-Fraud Centre, 2022; Prates et al., 2013). The offences most likely to be committed using information technologies—such as child sex offences, criminal harassment, indecent or harassing communications, threats, extortion, fraud, and child pornography—have all increased in recent years.
Among these offences, fraud is by far the one most often reported by police. Although only a portion of frauds are committed using information technologies, they represented more than half of police-reported cybercrime in 2021. Fraud committed via information technologies or other means also represented a significant share of property crime. In 2021, fraud was reported by the police more often than other common property crimes, such as break and enter, motor vehicle theft, or shoplifting.
Fraud can cause substantial financial losses for its victims (Canadian Anti-Fraud Centre, 2022), but it can also have significant negative impacts on an emotional and psychological level and on quality of life (Cross et al., 2016; Modic and Anderson, 2015; Sarriá et al., 2019). Still, fraud is often considered to be a harmless crime and its impact minimized (Canadian Anti-Fraud Centre, 2022). Additionally, few victims of fraud report their victimization to the authorities, and those who try often face many obstacles (Cross et al., 2016).
Relatively little is known about the true extent of fraud in Canada and the full implications for its victims. The General Social Survey (GSS) on Canadians’ Safety (Victimization) measures the experiences of Canadians with respect to criminal victimization, including incidents that were not reported to the authorities. This article presents the main GSS results on self-reported fraud. Some results on police-reported fraud from the Uniform Crime Reporting Survey are also presented to supplement and provide context for the GSS analyses.
Of all crimes measured by the General Social Survey on Canadians’ Safety, fraud is the most common
For the first time in 2019, the GSS on Canadians’ Safety included questions to measure the extent of fraud committed against individuals. Specifically, survey respondents were asked if, in the five years preceding the survey, anyone had a) used their personal information to obtain money or buy goods, b) used their personal information to create an account or obtain services, c) tricked or deceived them out of money, or d) they had been a victim of another type of fraud. They were then asked if at least one fraud occurred during the previous 12 months.
Just over 5 million people aged 15 and older (17% of the population) reported having been a victim of at least one fraud in the five years preceding the GSS. Specifically, nearly 2.5 million people reported being the victim of fraud in the previous 12 months, or 7.8% of the Canadian population aged 15 and older (Chart 1).
Chart 1 start

Data table for Chart 1
| Type of crime | percent | 95% confidence interval | |
|---|---|---|---|
| lower | upper | ||
| Fraud | 7.8 | 7.3 | 8.5 |
| Theft of personal property | 6.7 | 6.1 | 7.2 |
| Theft of household property | 4.8 | 4.4 | 5.3 |
| Violent crimeData table for chart 1 Note 1 | 4.3 | 3.8 | 4.8 |
| Vandalism | 3.4 | 3.0 | 3.8 |
| Assault | 2.7 | 2.4 | 3.1 |
| Break and enter | 2.6 | 2.3 | 2.9 |
| Motor vehicle theft | 1.5 | 1.3 | 1.8 |
| Sexual assault | 1.4 | 1.1 | 1.7 |
| Robbery | 0.5 | 0.4 | 0.7 |
Source: Statistics Canada, General Social Survey on Canadians' safety, 2019. |
|||
Chart 1 end
In addition to fraud, the GSS on Canadians’ Safety measures the prevalence of victimization for eight other crimes: sexual assault, robbery, assault, break and enter, motor vehicle theft, theft of personal property, theft of household goods, and vandalism. In 2019, more people said they had been a victim of at least one fraud in the past 12 months than of any other type of crime. The number of victims of fraud (2.5 million) was higher than the number of victims of all violent crimes (sexual assault, robbery and assault) measured by the GSS combined, at 1.4 million (4.3% of the population) (Chart 1).
Chart 2 start

Data table for Chart 2
| Type of fraud | percent | 95% confidence interval | |
|---|---|---|---|
| lower | upper | ||
| Someone used your personal information to obtain money or buy goods | 12 | 11 | 12 |
| Someone used your personal information to create an account or obtain services | 2 | 1 | 2 |
| Someone tricked or deceived you out of money either in person, by telephone or online | 4 | 4 | 5 |
| Another type of fraud | 3 | 3 | 3 |
|
Note: The responses “Not stated” and “Don’t know” are included in the calculation of percentages, but are not presented unless they represent at least 5% of responses. The categories are not mutually exclusive. Error bars represent the 95% confidence intervals and can be interpreted as such: if the survey were repeated many times, then 95% of the time (or 19 times out of 20), the interval would cover the true population value. Source: Statistics Canada, General Social Survey on Canadians' safety, 2019. |
|||
Chart 2 end
Among the various types of fraud, 12% of the population was a victim of fraud where someone used their personal or banking information to obtain money or buy goods or services in the five years preceding the GSS. The second most common type of fraud involved the victim being tricked or deceived out of money (4.2%) (Chart 2).
Fraud is more prevalent in Alberta than elsewhere in the country
The prevalence of self-reported fraud varied across Canada. Overall, 17% of the population reported having been a victim of at least one fraud in the five years preceding the survey. In Alberta, this proportion was 22% (Chart 3).
The lowest prevalence of fraud was in Nunavut, where fewer than one in ten people (8.6%) was a victim of at least one fraud in the 5 years preceding the survey. New Brunswick (13%), Newfoundland and Labrador (13%), Nova Scotia (14%) and Quebec (14%) also had a lower prevalence of fraud than other regions of the country.
Chart 3 start

Data table for Chart 3
| Province or territory | percent | 95% confidence interval | |
|---|---|---|---|
| lower | upper | ||
| Newfoundland and Labrador | 13Note * | 11 | 16 |
| Prince Edward Island | 14 | 11 | 18 |
| Nova Scotia | 14Note * | 12 | 17 |
| New Brunswick | 13Note * | 11 | 15 |
| Quebec | 14Note * | 12 | 16 |
| Ontario | 17 | 15 | 18 |
| Manitoba | 18 | 15 | 21 |
| Saskatchewan | 16 | 14 | 19 |
| Alberta | 22Note * | 19 | 25 |
| British Columbia | 18 | 16 | 20 |
| Yukon | 18 | 15 | 21 |
| Northwest Territories | 16 | 13 | 20 |
| Nunavut | 9Note * | 6 | 12 |
| Canada | 17 | 16 | 18 |
Source: Statistics Canada, General Social Survey on Canadians' safety, 2019. |
|||
Chart 3 end
Overall, the prevalence of fraud was also slightly higher in census metropolitan areas (CMAs) (17%) than in other regions of the country (15%). The CMAs of Edmonton (24%), Victoria (23%) and Calgary (22%) had a higher prevalence of fraud than the rest of the country, while the CMAs of London (11%), Saskatoon (12%), Halifax (13%) and St. John’s (13%) had a lower prevalence.Note Note
Losses related to fraud against individuals top $16 billion in five years
Financial losses are naturally one of the many possible repercussions of fraud. However, most victims of fraud in the five years preceding the survey reported no losses (38%) or a loss of less than $250 (16%) from the most serious fraud they experienced. In contrast, some people suffered relatively significant losses. For example, about 170,000 people (3.2% of victims of fraud) suffered losses of $10,000 or more (Table 1, Chart 4).
Chart 4 start

Data table for Chart 4
| Value of losses sustained due to fraud (dollars) | percent | 95% confidence interval | |
|---|---|---|---|
| lower | upper | ||
| No losses | 38 | 35 | 41 |
| 1 to 249 | 16 | 14 | 18 |
| 249 to 499 | 9 | 7 | 10 |
| 500 to 999 | 11 | 10 | 13 |
| 1,000 to 2,499 | 12 | 10 | 14 |
| 2,500 to 9,999 | 9 | 8 | 11 |
| 10,000 to 99,999 | 3 | 2 | 4 |
| 100,000 or more | 1 | 0 | 1 |
|
0 true zero or a value rounded to zero Note: Includes people who were victims of at least one fraud in the five years preceding the survey. If a person was a victim of more than one fraud during this period, the information refers to the most serious fraud experienced. The amounts in this chart do not include amounts for which the victim was reimbursed (e.g., by the bank, credit card company, or insurance). The responses “Not stated” and “Don’t know” are included in the calculation of percentages, but are not presented unless they represent at least 5% of responses. The sum of the categories may not equal 100 due to rounding and the inclusion of the responses “Not stated” and “Don’t know” in the calculation of percentages. Error bars represent the 95% confidence intervals and can be interpreted as such: if the survey were repeated many times, then 95% of the time (or 19 times out of 20), the interval would cover the true population value. Source: Statistics Canada, General Social Survey on Canadians' safety, 2019. |
|||
Chart 4 end
Among people who suffered losses because of fraud in the five years preceding the survey, the average loss was just over $5,000. However, the relatively high average loss was attributable to very high losses experienced by a minority of victims, as the median loss was approximately $600 (Table 1). In total, the financial losses reported by all victims of fraud in the five years preceding the GSS were almost $16.3 billion. It should be noted that information on the amount of the loss was only collected for the most serious fraud experienced in the five years preceding the survey. Total losses would undoubtedly have been higher if information had been collected for each fraud experienced during this period.
In some cases, individuals experienced lost time in addition to financial losses. Most victims of fraud said that the incident was resolved in less than one hour (31%) or between one and 24 hours (40%). In contrast, in nearly one in ten cases (8.1%), it took more than a month to resolve the problems caused by the fraud (Table 1).
Fraud is rarely reported to the police
Fraud is only very rarely reported to the police. Approximately one fraud victim in ten (11%) reported to police the most serious fraud they had experienced in the five years preceding the GSS (Table 2, Chart 5). Therefore, fraud is one of the crimes least likely to be reported to the police. Data on reporting other types of crime measured by the GSS to the police are collected for each incident (rather than for the most serious one) experienced in the 12 months preceding the survey (rather than in the past five years). Therefore, a perfect comparison cannot be established. Nevertheless, we can say that fraud is much less likely to be reported than the average for crimes (29% reporting rate), with a rate similar to that of sexual assault (6%) (Cotter, 2022).
Chart 5 start

Data table for Chart 5
| Authority to which the fraud was reported | percent | 95% confidence interval | |
|---|---|---|---|
| lower | upper | ||
| Police | 11 | 9 | 12 |
| Bank | 65 | 62 | 67 |
| Canadian Anti-Fraud Centre | 7 | 5 | 8 |
| Consumer protection bureau | 2 | 2 | 4 |
| Other | 7 | 6 | 8 |
| Not reported | 25 | 23 | 28 |
|
Note: Includes people who were victims of at least one fraud in the five years preceding the survey. If a person was a victim of more than one fraud during this period, the information refers to the most serious fraud experienced. The responses “Not stated” and “Don’t know” are included in the calculation of percentages, but are not presented unless they represent at least 5% of responses. The categories are not mutually exclusive. Error bars represent the 95% confidence intervals and can be interpreted as such: if the survey were repeated many times, then 95% of the time (or 19 times out of 20), the interval would cover the true population value. Source: Statistics Canada, General Social Survey on Canadians' safety, 2019. |
|||
Chart 5 end
The GSS results on reporting fraud to the police support several other studies in Canada and elsewhere that show the extent of the dark figure for fraud, i.e., the portion of crimes not included in police-reported crime statistics (Cross and Blackshaw, 2015; Kemp et al., 2020; Morgan, 2021; Smyth and Carleton, 2011). Many of these studies also note that victims of fraud face a number of obstacles when they want to report fraud. One of these obstacles is knowing which organization or organizations the fraud should be reported to. While few frauds were reported to the police, many victims reported the most serious fraud to other organizations. Nearly two-thirds (65%) of victims reported the most serious fraud to the bank or credit card issuing company, 7% reported it to the Canadian Anti-Fraud Centre, 2% reported it to a consumer protection bureau, and 7% reported it in another way (Chart 5).
More victims of fraud in Saskatchewan and Quebec reported fraud to the police
The probability of a fraud being reported to the police varied from province to province. Among people who were victims of at least one fraud in the five years preceding the survey, victims from Saskatchewan (17%) and Quebec (15%) were more likely to have reported the most serious fraud to the police than victims from other provinces. In contrast, victims of fraud living in Manitoba (6%) were least likely to report fraud to the police. Victims from Quebec (11%) were also most likely to have reported the fraud to the Canadian Anti-Fraud Centre, while victims from Alberta (3%) were least likely (Table 2).
The probability of the fraud being reported to the police also varied by the amount of the loss. While 8% of victims of fraud who had not incurred any losses reported the fraud to the police, this proportion rose to 35%E among people who had lost $10,000 or more. Victims of fraud aged 65 and older (14%)—and especially those 75 years and older (21%)—were also more likely than victims aged under 65 to report their victimization. The same was true of people with a physical or mental disability (12%), who reported frauds more often than people without a disability (9%). In contrast, LGBTQ2+ victims were half as likely as non-LGBTQ2+ people to have reported to the police the most serious fraud they had experienced in the five years preceding the survey.
Start of text box 1
Text box 1
Police-reported fraud
In 2021, Canadian police services reported 168,483 fraud incidents,Note nearly double the number in 2011 (87,174 fraud incidents). Among all crimes, fraud saw the largest increase in absolute numbers during this period. In 2021, fraud accounted for approximately 12% of the Crime Severity Index (CSI)Note —about twice the proportion that it was in 2011 (6.5%)—making fraud the main factor that slowed the CSI’s decline during that period. In 2021, fraud represented 14% of property crimes recorded by the police, and it has become more frequent than other high-volume property crimes, such as break and enter or motor vehicle theft. Fraud also represented more than half (57%) of police-reported cybercrime incidents.
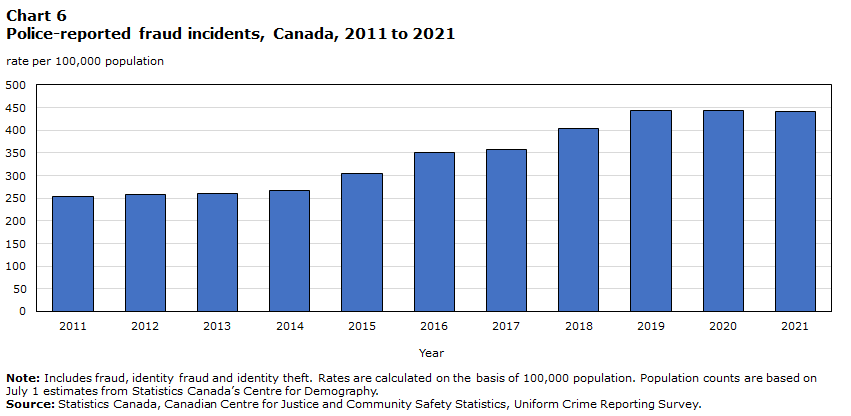
The 168,483 police-reported fraud incidents in 2021 represented a rate of 441 incidents per 100,000 population, slightly down from the previous year (443) but nearly twice as high as in 2011 (254) (Chart 6). Among all incidents of police-reported fraud, 14% were identity fraud and 4% were identity theft. Extortion, which can be considered a type of fraud although it is categorized as a violent crime, has also risen significantly since 2011. From 2011 to 2021, the police-reported extortion rate quadrupled, from 4.4 incidents to 17.6 incidents per 100,000 population.
Chart 6 start
Data table for Chart 6
| Year | rate per 100,000 population |
|---|---|
| 2011 | 254 |
| 2012 | 258 |
| 2013 | 260 |
| 2014 | 266 |
| 2015 | 305 |
| 2016 | 351 |
| 2017 | 358 |
| 2018 | 404 |
| 2019 | 443 |
| 2020 | 443 |
| 2021 | 441 |
|
Note: Includes fraud, identity fraud and identity theft. Rates are calculated on the basis of 100,000 population. Population counts are based on July 1 estimates from Statistics Canada’s Centre for Demography. Source: Statistics Canada, Canadian Centre for Justice and Community Safety Statistics, Uniform Crime Reporting Survey. |
|
Chart 6 end
The nature of police-reported total fraud has changed since 2011, in part because of the COVID-19 pandemic.Note The stability in the fraud rate since 2019 is largely attributable to the decrease in card fraud (fraudulent use of payment cards or another type of card) (-27% from 2019) and cheque fraud (‑36%), which could partly be due to the decrease of in-person commerce during the pandemic. In contrast, fraud involving false claims or false applications increased by 90% during the same period, largely because of the increase in fraudulent government claims, which can include, for example, a fraudulent application for the Canada Emergency Response Benefit (CERB).
Since 2011, securities or financial fraud has seen the largest increase (+579%). Additionally, fraud can take very different forms and incidents may not always fit into a limited set of categories. In 2021, approximately 4 in 10 frauds were identified by police as “other fraud” (Chart 7).
Chart 7 start

Data table for Chart 7
| Year | Cheque fraud | Card fraud (debit, credit, calling) | Mass marketing | Securities or financial | Fraudulent applications to organizations | By computer (e.g., piracy, phishing) | Identity theft | Other |
|---|---|---|---|---|---|---|---|---|
| rate per 100,000 population | ||||||||
| 2011 | 36 | 65 | 6 | 13 | 3 | 10 | 4 | 119 |
| 2012 | 36 | 59 | 6 | 16 | 2 | 11 | 5 | 121 |
| 2013 | 36 | 56 | 5 | 19 | 3 | 14 | 6 | 122 |
| 2014 | 34 | 58 | 8 | 22 | 4 | 15 | 6 | 119 |
| 2015 | 38 | 70 | 14 | 28 | 7 | 15 | 7 | 126 |
| 2016 | 41 | 88 | 15 | 36 | 9 | 18 | 9 | 135 |
| 2017 | 38 | 100 | 15 | 38 | 6 | 18 | 9 | 134 |
| 2018 | 41 | 110 | 17 | 48 | 7 | 19 | 10 | 150 |
| 2019 | 45 | 119 | 13 | 55 | 7 | 22 | 13 | 170 |
| 2020 | 32 | 95 | 18 | 68 | 15 | 29 | 20 | 167 |
| 2021 | 28 | 85 | 16 | 76 | 13 | 33 | 19 | 171 |
|
Note: Includes fraud, identity fraud and identity theft. Rates are calculated on the basis of 100,000 population. Populations are based on July 1 estimates from Statistics Canada’s Centre for Demography. Source: Statistics Canada, Canadian Centre for Justice and Community Safety Statistics, Incident-based Uniform Crime Reporting Survey, Trend Database. |
||||||||
Chart 7 end
Police-reported fraud rarely led to charges. Among fraud recorded by police in 2021, the vast majority (90%) were not cleared (i.e., resolved), 7% were cleared by charge, and 3% were cleared otherwise. Nevertheless, these proportions are similar to the rates for property crimes in general, where 84% of incidents in 2021 were not cleared, while 8% were cleared by charge. On average, police took 54 days to clear an incident of fraud, which is nevertheless higher than the average of 20 days for property crimes in general.
When an accused was identified in a case of fraud, in just over two-thirds (68%) of incidents the accused was a man with an average age of 34 years. These characteristics are fairly similar to what is observed for all property crimes.
End of text box 1
Postsecondary graduates and high-income earners were even more of a target for fraudsters
High household income has been identified as being associated with an increased risk of being a victim of the household crimes measured by the GSS on Canadians’ SafetyNote (Cotter, 2021). The situation was similar for fraud, where people whose before-tax household income was less than $80,000 were less likely to have been victims than people with a household income of $80,000 or more (14% compared with 19%).Note The differences are even greater when looking at personal income: 13% of people whose annual personal income before taxes was less than $20,000 were victims of fraud in the five years preceding the survey, compared with 24% of people whose personal income was $120,000 or more (Table 3).
Although data from the GSS on Canadians’ Safety show no connection between level of education and the risk of being a victim of violent or property crime, it is completely different for fraud. People who attended university were about 2.5 times more likely to report being a fraud victim than were people with no high school diploma. A high level of education remained a factor associated with an increased risk of fraud even when age, personal income, and other characteristics such as Internet use were taken into account (Table 4).
Internet use is associated with a risk of being a fraud victim
The frequency and type of Internet use can have an impact on the probability of being a target of fraud. People who never use the Internet were about three times less likely than people who use the Internet daily having have been a fraud victim in the five years preceding the survey (6% compared with 18%). Similarly, Internet users who reported not making purchases online were about half as likely to have been victims of fraud than people who did make purchases online (11% compared with 20%) (Table 5).
According to police-reported data, nearly a quarter (24%) of fraud incidents recorded in 2021 were committed through information technologies. Therefore, it is not surprising that people who rarely use the Internet are less likely to have been victims of fraud. However, these people are in the minority since nearly nine in ten reported using the Internet daily and two-thirds reported making purchases online.
First Nations people, Inuit and francophones are less likely to have been victims of fraud
Unlike other types of crimes, roughly equal proportions of the population groups were affected by fraud. Similar to other studies (Trahan et al., 2005; Ross and Smith, 2011), GSS data revealed few differences based on demographic characteristics. Men (16%) and women (17%), racialized peopleNote (17%) and non-racialized peopleNote (17%), LGBTQ2+ people (21%) and non-LGBTQ2+ people (17%) were all victims of fraud in similar proportions.Note In addition, aside from a lower prevalence of fraud in people younger than 25 and people 75 years and older, the differences by age group were relatively modest (Table 3), although those aged 65 to 74 show a higher risk of victimization than others when various risk factors are taken into account (Table 4)
However, some people were a bit more or a bit less likely to have been victims of fraud in the five years preceding the survey. For example, First Nations people (11%) and Inuit (6%E) had a lower prevalence of fraud than non-Indigenous people (17%). These differences may be partly explained by the socioeconomic marginalization of Indigenous people.Note On the whole, average income and level of education are slightly lower among Indigenous people than among non-Indigenous people, and high income and a high level of education are associated with a greater prevalence of fraud (Table 3). Moreover, compared with non-Indigenous people (86%), First Nations people (78%) and Inuit (69%E) were less likely to use the Internet daily. Yet, frequent Internet use is also associated with a greater prevalence of fraud. When these and other various risk factors were considered, Indigenous people were not less likely than non-Indigenous people to have been victims of fraud (Table 4).
People who spoke French most often at home were also less likely than their anglophone counterparts to have been victims of fraud (13% compared with 18%). Even when the differences in income, education and other characteristics are taken into account, francophones were still less likely to have been victims of fraud (Table 4). According to a previous study, francophones were less likely to report being targeted by phishing attempts, which are often written in English (Perreault, 2011).
Lastly, people with a physical or mental disability (19%) were slightly more likely than people without a disability (16%) to have been victims of fraud in the five years preceding the survey. Studies have shown that fraudsters could take advantage of these people’s vulnerability, especially people with disabilities related to mental health (Lichtenberg et al., 2013; Lichtenberg et al., 2016).
People who experienced intimate partner violence are more likely to have been victims of fraud
People who reported having experienced violence or other difficult experiencesNote , recently or earlier in life, were more likely to have been victims of fraud in the five years preceding the survey, even when other factors were taken into account (Table 4). This was especially the case in people who experienced intimate partner violence: 28% had been victims of fraud in the five years preceding the survey, compared with 17% of people whose partner was never violent (Table 6). Although the GSS collected no information on fraudsters’ identity, financial abuse is often part of the patterns of intimate partner violence (Conroy, 2019). For example, a former partner may sometimes have access to personal information that helps in committing fraud. Previous studies also noted a greater prevalence of fraud among people who went through negative experiences, which they attributed to greater vulnerability because of changes in their social support network, activities, and consumer behaviour (Anderson, 2019; Burgos, 2006; Ross and Smith, 2011).
People who were victims of another type of crime in the 12 months preceding the survey (22%) and people who experienced violence during childhood (21%) were also more likely than people who had no such experiences (15%) to have been a victim of fraud (Table 6).
Many victims of fraud do not know how their personal information was obtained
Most (90%) fraud cases reported in the GSS involved personal information having been obtained by fraudsters. However, in many cases, the victims did not know how their personal information had been obtained (41% of victims, or 45% of those whose fraud involved personal information) (Table 1).
Of fraud victims who knew how their personal information had been obtained, many (39%) said that their credit or debit card had been cloned or copied. Others said that access to one of their accounts (online, email) had been pirated (18%), that they had themselves provided the information (16%) or even that the information had been obtained after a database breach or a data leak (10%).
In most cases, the fraud victims discovered the incident while reviewing their bank or credit card statements (38%), or after a financial institution or a credit card company had contacted them (31%).
The vast majority of people took steps to protect their personal information
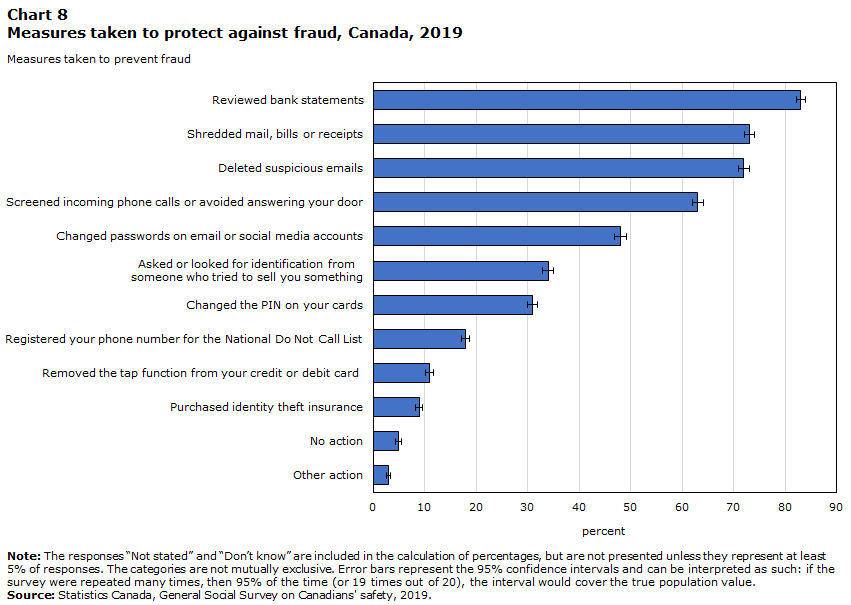
Almost all Canadians (95%) took at least some steps regarding their personal information or to protect themselves from fraud. Of the various steps that could have been taken to prevent fraud, reviewing bank statements or credit card statements was the most frequent, having been done by 83% of people 15 and older. Shredding mail, bills or receipts (73%), deleting suspicious emails (72%), and screening calls or not answering the door (63%) were other steps taken by a majority of the population (Chart 8).
Chart 8 start
Data table for Chart 8
| Measures taken to prevent fraud | percent | 95% confidence interval | |
|---|---|---|---|
| lower | upper | ||
| Reviewed bank statements | 83 | 82 | 84 |
| Shredded mail, bills or receipts | 73 | 72 | 74 |
| Deleted suspicious emails | 72 | 71 | 73 |
| Screened incoming phone calls or avoided answering your door | 63 | 62 | 64 |
| Changed passwords on email or social media accounts | 48 | 47 | 49 |
| Asked or looked for identification from someone who tried to sell you something | 34 | 33 | 35 |
| Changed the PIN on your cards | 31 | 30 | 32 |
| Registered your phone number for the National Do Not Call List | 18 | 17 | 18 |
| Removed the tap function from your credit or debit card | 11 | 10 | 12 |
| Purchased identity theft insurance | 9 | 8 | 10 |
| No action | 5 | 4 | 5 |
| Other action | 3 | 3 | 4 |
|
Note: The responses “Not stated” and “Don’t know” are included in the calculation of percentages, but are not presented unless they represent at least 5% of responses. The categories are not mutually exclusive. Error bars represent the 95% confidence intervals and can be interpreted as such: if the survey were repeated many times, then 95% of the time (or 19 times out of 20), the interval would cover the true population value. Source: Statistics Canada, General Social Survey on Canadians' safety, 2019. |
|||
Chart 8 end
Many people took some other steps to protect themselves from fraud in the 12 months preceding the survey, such as changing their password (48%) or the PIN on their cards (31%), or even asking for the identity of the person trying to sell them something or asking for a donation (34%). Conversely, relatively few people (9.0%) said that they purchased fraud insurance.
People who were victims of fraud are more likely to take steps to protect themselves from it
Generally, the people most likely to be targeted by fraudsters were also the most likely to adopt certain fraud protection measures. For example, of those who had been victims of fraud in the years preceding the survey, 91% reviewed their bank statements, 81% deleted suspicious emails, and 60% regularly changed their passwords. Of the people who were not victims of fraud, these proportions were 82%, 70% and 45%, respectively (Table 7).
Similarly, characteristics associated with an increased risk of fraud were also associated with a greater probability of taking steps to protect themselves from it. For example, as with the proportion of people who were victims of fraud, the proportion who took steps to protect themselves from it increased based on personal income and level of education. Similarly, people younger than 25 and those 75 years and older were generally less likely than people in other age groups to take certain precautions. However, adults between 25 and 44 years were less likely than their counterparts 75 and older to shred mail and bills, which could be attributable to more younger people using online banking and consulting online statements.
The survey did not reveal when the fraud protection measures were adopted (i.e., before or after the fraud, where applicable). Therefore, people at higher risk of being victims of fraud may be more likely to protect themselves, just as being such a victim may have incited some people to better protect themselves. That said, most of the differences observed remained even when having been a fraud victim or not was taken into account.
However, racialized people were the exception to this trend. On the whole, racialized people were as likely as non-racialized people to have been victims of fraud in the five years preceding the survey. However, they were generally a bit less likely to take steps to protect themselves from it, but they did change their passwords. The same trend was observed among immigrants (Table 7).
Few people considered their personal information very well protected against fraud
Although most people took steps to protect themselves from fraud, very few considered their personal information very well protected. In 2019, about 1 in 15 people (6.6%) considered their personal information very well protected from fraud. Nearly half (48%) of people aged 15 and older considered their personal information somewhat well protected. Conversely, about a third (34%) of survey respondents considered their personal information not very well protected, whereas another 10% considered it not at all well protected (Chart 9).
Chart 9 start

Data table for Chart 9
| Perceived level of protection of personal information | percent | 95% confidence interval | |
|---|---|---|---|
| lower | upper | ||
| Very secure | 7 | 6 | 7 |
| Somewhat secure | 48 | 47 | 50 |
| Not very secure | 34 | 33 | 35 |
| Not at all secure | 10 | 9 | 11 |
|
Note: The responses “Not stated” and “Don’t know” are included in the calculation of percentages, but are not presented unless they represent at least 5% of responses. The sum of the categories may not equal 100 due to rounding and the inclusion of the responses “Not stated” and “Don’t know” in the calculation of percentages. Error bars represent the 95% confidence intervals and can be interpreted as such: if the survey were repeated many times, then 95% of the time (or 19 times out of 20), the interval would cover the true population value. Source: Statistics Canada, General Social Survey on Canadians' safety, 2019. |
|||
Chart 9 end
People aged 35 to 54 years were least likely to consider their personal information well protected, with just under half considering their information very well protected or somewhat well protected (Table 7). The perception of the level of protection of personal information also went down with level of education: people with higher education were less likely to consider their information well protected. At the provincial level, Quebec residents were by far the most pessimistic about the level of protection of their personal information.
A number of factors may have an impact on perceptions about fraud and level of protection of personal information. On one hand, they can certainly be influenced by the actual prevalence of fraud. On the other, public discussion on this topic, including awareness campaigns and media coverage of major fraud cases or data leaks, may have an impact.
Nearly three-quarters of the population perceives an increase in fraud
The majority of Canadians aged 15 and older perceives an increase in fraud. When asked about their perception of how fraud cases have developed in Canada in the past five years, nearly three-quarters (73%) of survey respondents said they believe that fraud has increased, while just under a quarter (23%) believed that the prevalence of fraud has remained rather stable (Chart 10).
Chart 10 start

Data table for Chart 10
| Number of fraud incidents in Canada | Crime in the neighbourhoodData table for chart 10 Note 1 | |||||
|---|---|---|---|---|---|---|
| percent | 95% confidence interval | percent | 95% confidence interval | |||
| lower | upper | lower | upper | |||
| Higher | 73 | 72 | 74 | 19 | 18 | 20 |
| Same | 23 | 22 | 24 | 74 | 73 | 75 |
| Lower | 1 | 1 | 2 | 6 | 6 | 7 |
Source: Statistics Canada, General Social Survey on Canadians' safety, 2019. |
||||||
Chart 10 end
Canadians’ perception of how fraud has developed in Canada differs from their perception of criminal behaviour in general. When asked about criminal behaviour in general, the majority (74%) of the population believed that the number of crimes in their neighbourhood was stable in the five years preceding the survey, whereas just under one in five people (19%) thought that there was an increase.
Summary
Although the majority (74%) of the Canadian population considered criminal behaviour in general to have remained rather stable in the five years preceding the 2019 General Social Survey on Canadians’ Safety, about the same proportion (73%) considered fraud to be on the rise. This perception about fraud seems to correspond with reality. Of all the crimes measured by the GSS, fraud was the most frequently reported. In 2019, 2.5 million people, or 7.8% of the Canadian population, reported being a victim of fraud in the 12 months preceding the survey. Although fraud is rarely reported to police—1 in 10 victims of fraud reported the most serious fraud they had experienced in the five years preceding the survey—fraud saw the largest increase of all police-reported crimes. From 2011 to 2021, the number of fraud cases reported by police almost doubled, from 87,174 cases to 168,483 cases, making fraud the main factor that slowed the CSI’s decline during that period. The rate of extortion also quadrupled during the same period.
In the five years preceding the 2019 GSS, about one in six people (17%) were victims of at least one fraud in Canada. This proportion was highest in Alberta (22%), while people living in Nunavut (8.6 %), New Brunswick (13%), Newfoundland and Labrador (13%), Nova Scotia (14%) and Quebec (14%) were least likely to have experienced fraud.
Fraud cases in the five years preceding the GSS sometimes resulted in significant financial losses. About a quarter of victims reported a loss of at least $1,000 and 3.2% reported a loss of at least $10,000. The financial losses reported by all victims of fraud in the five years preceding the GSS were over $16 billion. Of this amount, victims were able to recover just over $6 billion (for example, after being reimbursed by the bank, the issuing credit card company, or insurance).
Some people were more likely to have experienced fraud in the five years preceding the survey. This was particularly the case with people with a physical or mental disability, people with high personal income or a high level of education, and people who were victims of violence recently or during their life, especially those who were victims of intimate partner violence. The risk of being victim of fraud grew as Internet use increased. However, some people were less likely to be victims of fraud, in particular First Nations people, Inuit, and francophones.
Detailed data tables
Start of text box 2
Text box 2
Other fraud information sources in Canada
Canadian Anti-Fraud Centre
The Canadian Anti-Fraud Centre (CAFC), formerly PhoneBusters, was the result of a partnership between the Royal Canadian Mounted Police, the Ontario Provincial Police, and Competition Bureau Canada. The CAFC’s responsibility consists in collecting data and information on fraud affecting individuals and businesses and in providing fraud awareness products and alerts. The CAFC is currently working on implementing a new system to facilitate the fraud reporting process; it should be launched in 2023/2024. Data on fraud cases reported to the CAFC are one of the main sources of fraud information in Canada.
In its latest annual report, covering the period from January 1 to December 31, 2021, the CAFC recorded 106,000 reports with losses totalling around $379 million. This amount rose sharply from the previous year ($165 million). The CAFC also mentioned that youth and seniors were increasingly affected by fraud.
The CAFC report highlights eight primary forms of fraud: investment, romance, merchandise and counterfeit merchandise, extortion, phishing, spear phishing, identity, and COVID-related fraud. Of these types of fraud, investment fraud saw the biggest increase in 2021, and resulted in the greatest losses. Use of cryptocurrency in investment fraud cases also increased significantly in 2021.
For more information, refer to the CAFC 2021 Annual Report (Canadian Anti-Fraud Centre, 2022)
2023 CPA Canada Annual Fraud Survey
Conducted from January 3 to 5, 2023 with a random sample of about 2,000 people, Chartered Professional Accountants (CPA) Canada’s fraud survey revealed that nearly two-thirds (63%) of people 18 to 34 years had already been victims of at least one financial fraud in their lifetime. This proportion fell to 39% for people aged 35 to 54, and to 31% for those 55 and older. As with the General Social Survey on Canadians’ Safety, the CPA Canada fraud survey notes that credit card fraud is still the most common form of fraud, with 21% of credit card users having already been victims. Nearly one in six victims (15%) apparently reported fraud to police and the same proportion reported it to the Canadian Anti-Fraud Centre (Chartered Professional Accountants Canada, 2023).
End of text box 2
Survey description
General Social Survey on Canadians’ Safety (Victimization)
The 2019 General Social Survey (GSS) on Canadians’ Safety target population was people aged 15 and older living in the provinces and territories, except for those living full time in an institution. Data collection took place between April 2019 and March 2020. Responses were obtained by computer-assisted telephone interviews (CATI), in-person interviews (in the territories only) and, for the first time, self-administered internet collection (for respondents in the provinces and the territorial capitals). Respondents could respond in the official language of their choice.
An individual aged 15 or older was randomly selected within each household to respond to the survey. In 2019, the final sample size was 22,412 respondents. In 2019, the overall response rate was 37.6%. Non-respondents included people who refused to participate, could not be reached, or could not speak English or French. Respondents in the sample were weighted so that their responses represented the non-institutionalized Canadian population aged 15 and older.
As with any household survey, there are some data limitations. The results are based on a sample and are therefore subject to sampling errors. Somewhat different results might have been obtained if the entire population had been surveyed. For the quality of estimates, the lower and upper bounds of the confidence intervals are presented in the tables and charts. Confidence intervals should be interpreted as follows: if the survey were repeated many times, then 95% of the time (or 19 times out of 20), the confidence interval would cover the true population value. In addition to the confidence intervals, estimates are categorized into quality categories based on unweighted sample size. Estimates falling below a certain threshold are marked with the letter F, and estimates marked with the letter E have been deemed to be of marginal quality and should be used with caution.
Uniform Crime Reporting Survey
The Uniform Crime Reporting (UCR) Survey was established in 1962 with the co-operation and assistance of the Canadian Association of Chiefs of Police. The UCR Survey measures criminal incidents that have been reported to federal, provincial or territorial, and municipal police services in Canada.
One incident can involve multiple offences. To ensure comparability, counts presented in this article are based on the most serious offence in the incident as determined by a standard classification rule used by all police services. Counts based on all violations are available upon request.
Data from the UCR are used to calculate both the traditional crime rate and the Crime Severity Index (CSI). The traditional crime rate and the CSI are based on the aggregate count of criminal incidents. A criminal incident involves one or more related offences that are committed during a single criminal event and have been reported to police. Where there are multiple victims within a single criminal event, a separate aggregate incident is counted for each victim. For example, a single incident involving an assault on three victims at the same time and location is counted in the aggregate statistics as three incidents of assault. For an incident to be counted in the crime statistics, it must be recorded as “founded” as opposed to “unfounded.” An incident is “founded” if, after police investigation, it has been determined that the reported offence did occur or was attempted or there is no credible evidence to confirm that the reported incident did not take place. This includes third-party reports that fit these criteria.
References
Anderson, K. B. (2019). Mass-market consumer fraud in the United States: A 2017 update. Federal Trade Commission. Washington, DC
Burgos, C. L. (2006). The effects of life events on telemarketing fraud vulnerability among older adults. California State University, Long Beach.
Canadian Anti-Fraud Centre. (2023). 2021 Annual Report. Government of Canada publication no. PS61-46-2021
Chartered Professional Accountant Canada (2023). CPA Canada 2023 Fraud Survey: backgrounder document.
Conroy, S. (2021). Spousal violence in Canada, 2019. Juristat. Statistics Canada Catalogue no. 85-002-X.
Cotter, A. (2021). Criminal victimization in Canada, 2019. Juristat. Statistics Canada Catalogue no. 85-002-X.
Cross, C., & Blackshaw, D. (2015). Improving the police response to online fraud. Policing: a journal of policy and practice, 9(2), 119-128.
Cross, C., Richards, K., & Smith, R. G. (2016). The reporting experiences and support needs of victims of online fraud.Trends and issues in crime and criminal justice, (518), 1-14.
Kemp, S., Miró-Llinares, F., & Moneva, A. (2020). The dark figure and the cyber fraud rise in Europe: Evidence from Spain.European Journal on Criminal Policy and Research, 26(3), 293-312.
Morgan, R. E. (2021). Financial fraud in the United States, 2017. US Department of Justice, Office of Justice Programs, Bureau of Justice Statistics.
Modic, D., & Anderson, R. (2015). It's all over but the crying: The emotional and financial impact of internet fraud. IEEE Security & Privacy, 13(5), 99-103.
Prates, F., Gaudreau, F. & Dupont, B. (2013). La cybercriminalité: état des lieux et perspectives d'avenir. Droits De La Personne: La Circulation Des Idées, Des Personnes Et Des Biens Et Capitaux, Institut canadien d'études juridiques supérieures (ed.), 415-42.
Ross, S., & Smith, R. G. (2011). Risk factors for advance fee fraud victimisation. Trends and Issues in Crime and Criminal Justice [electronic resource], (420), 1-6.
Lichtenberg, P. A., Stickney, L., & Paulson, D. (2013). Is psychological vulnerability related to the experience of fraud in older adults? Clinical gerontologist, 36(2), 132-146.
Lichtenberg, P. A., Sugarman, M. A., Paulson, D., Ficker, L. J., & Rahman-Filipiak, A. (2016). Psychological and functional vulnerability predicts fraud cases in older adults: Results of a longitudinal study. Clinical Gerontologist, 39(1), 48-63.
Perreault, S. (2011). Self-reported Internet victimization in Canada, 2009. Juristat. Statistics Canada Catalogue no. 85-002-X.
Sarriá, E., Recio, P., Rico, A., Díaz-Olalla, M., Sanz-Barbero, B., Ayala, A., & Zunzunegui, M. V. (2019). Financial fraud, mental health, and quality of life: a study on the population of the city of Madrid, Spain. International Journal of Environmental Research and Public Health, 16(18), 3276.
Smyth, S. M., & Carleton, R. (2011). Measuring the extent of cyber-fraud: A discussion paper on potential methods and data sources.
Trahan, A., Marquart, J. W., & Mullings, J. (2005). Fraud and the American dream: Toward an understanding of fraud victimization.Deviant Behavior, 26(6), 601-620.
- Date modified: