
Criminal victimization in Canada, 2019
by Adam Cotter, Canadian Centre for Justice and Community Safety Statistics
Highlights
- According to the General Social Survey (GSS) on Victimization, more than three-quarters (78%) of Canadians were very or somewhat satisfied with their personal safety from crime in 2019.
- One in five (19%) Canadians or their households were impacted by one of the eight crimes measured by the GSS in 2019. There were 8.3 million incidents of sexual assault, robbery, physical assault, break and enter, theft of motor vehicles (or parts), theft of household or personal property, or vandalism.
- Almost seven in ten (69%) self-reported incidents were non-violent in nature. Theft of personal property, the most common crime type, accounted for more than one-third (37%) of all criminal incidents.
- Women (106 incidents per 1,000 women) were violently victimized at a rate nearly double that of men (59 incidents per 1,000 men) in 2019. This gender difference is a result of the fact that women were five times more likely than men to be a victim of sexual assault (50 versus 9 per 1,000).
- When controlling for individual characteristics, women, lesbian, gay, or bisexual people, and younger people have a greater likelihood of being violently victimized.
- Higher violent victimization rates were observed among Indigenous people (177 incidents per 1,000 population), particularly among Métis (225) and Inuit (265E).
- After controlling for other factors such as age, gender, and other lifetime experiences, Indigenous identity on its own was not associated with increased likelihood of being a victim of violence.
- Childhood maltreatment, including physical or sexual abuse, witnessing violence in the home, or harsh parenting or neglect each increased the likelihood of experiencing violent victimization as an adult.
- Residential mobility and victimization were linked, with those who had changed residences more often in the past 5 years more likely to be victimized, both personally and their household.
- In 2019, about three in ten (29%) Canadians indicated that the victimization that they or their household experienced was reported to police. Reporting varied widely depending on the type of crime, from about half of all motor vehicle thefts, break and enters, and robberies, to 6% of sexual assaults.
- The most common reasons given by victims of crime for not reporting to police was that the crime was minor, the incident wasn’t important enough, or that nobody was harmed. For household victimization in particular, another common reason was a belief that the police would not have been able to recover what was stolen.
- More than any other incident characteristic, the presence of a weapon or an injury increased the odds of reporting a violent incident to police.
- One in six (16%) victims of violent crime reported three or more longer-term psychological consequences consistent with symptoms of post-traumatic stress disorder.
Crime, and the factors related to it, are complex and can be measured in a variety of ways. Official statistics, such as those collected by the police or courts, are a critical source of information. However, their main limitation is that they are unable to provide information on crime that does not come to the attention of police or other authorities. Crimes that are not reported or recorded, often referred to as the “dark figure of crime”, account for the majority of criminal incidents. For some types of crime, such as intimate partner violence or sexual assault, only a very small proportion are ever brought to the attention of police or other officials. Relying solely on official statistics for an understanding of these crime types could therefore result in a skewed understanding of the nature of crime and victimization in Canada, as those that come to the attention of police are not necessarily representative of all incidents of crime.
For this reason, in addition to collecting data on an annual basis from administrative sources such as police or courts, Statistics Canada conducts regular surveys asking Canadians 15 years of age and older about their experiences with criminal victimization, including incidents which were not reported to police. The 2019 General Social Survey (GSS) on Canadians’ Safety (Victimization) asked about experiences of eight offence types in the 12 months preceding the survey. This information is used not only to complement official data and provide a more fulsome view of crime in Canada, but is an important source of information used to plan and implement a variety of initiatives, such as crime prevention programs, family violence programs, and victims’ services.
This Juristat article presents findings from the 2019 GSS on Victimization, focusing on self-reported victimization and perceptions of safety in the provinces and territories. In particular, this article focuses on the prevalence of victimization, the characteristics of victims and incidents, and the impacts and consequences of victimization. In addition, levels of reporting to police and factors associated with the decision to report victimization to police are examined. This article aims to present a general overview of trends in victimization in Canada, and while information specific to particular groups or populations is presented, more in-depth and focused analysis of subpopulations in Canada is planned in future Juristat articles, to the extent that sample size allows for detailed disaggregation.
A dedicated article looking at self-reported spousal violence is forthcoming, and will be critical in examining this type of victimization in Canada. In this article, spousal violence is included in the overall victimization rates that are presented, but details of the incidents, such as emotional impacts or levels of reporting to police, were collected using a different methodology and are not included in this analysis.
As part of an ongoing effort to modernize data collection methods in order to reduce respondent burden and increase the timeliness of collection, data for the GSS was collected online as well as by phone in 2019. Due to changes in the way data for the GSS was collected during this cycle, this article does not include trend information on criminal victimization in Canada as direct comparisons between cycles where the method of collection changed are not recommended (see Text box 1). That said, the information on the broader context of crime that is provided by the GSS is still important when examining the nature and extent of crime and victimization in Canada in 2019.
Data collection ended in March 2020, just as the COVID-19 pandemic was beginning to have a major effect on the lives of Canadians. Though the data in this article do not reflect the circumstances of the pandemic and factors that may have increased levels of victimization or risk for some, they do present an important baseline for future comparisons. The patterns, impacts, and consequences uncovered in the 2019 GSS data can be compared with other data collection activities undertaken during and post-pandemic in order to examine the impacts that COVID-19 may have had on criminal victimization in Canada.
Start of text box 1
Text box 1
Comparability of the 2019 General Social Survey with previous cycles
As with many other telephone-based household surveys in Canada, the General Social Survey (GSS) on Canadians’ Safety (Victimization) has faced the issue of declining response rates for several recent cycles.
To modernize collection activities and give Canadians another means through which they could participate in the survey, the GSS included the option to respond to the survey online in 2019. In fact, in the 2019 cycle, roughly six in ten of those who completed the questionnaire did so online, as opposed to over the phone with a Statistics Canada interviewer.
Any significant change in survey methodology can affect the comparability of the data over time. It is impossible to determine with certainty whether, and to what extent, differences in a variable are attributable to an actual change in the population and the behaviours being examined or to changes in the survey methodology between the collection cycles––also referred to as a mode effect.
Due to this mode effect, comparisons of 2019 GSS results to previous GSS cycles conducted without the use of online questionnaires are not recommended, as any differences may be the result of a change in collection method rather than reflective of actual changes in victimization patterns. For that reason, this article focuses only on Canadians’ experiences of victimization in 2019 and does not make direct comparisons to previous cycles of the GSS.
Furthermore, mode effect may also impact comparisons between population groups within the 2019 cycle if there were differences in the way the survey was completed.
At every stage of processing, verification and dissemination of Statistics Canada data, considerable effort is made to produce data that are as precise in their level of detail, and to ensure that the published estimates are of good quality in keeping with Statistics Canada standards. Methodological analysis shows that the data are of good quality and present an accurate picture of criminal victimization in Canada in 2019.
End of text box 1
Majority of self-reported victimization is non-violent in nature
In 2019, one in five (19%) individuals––or almost 6 million people 15 years of age and older in Canada––indicated that they or their household had been a victim of one of the eight types of crime measured by the GSS in the past 12 months (see Text box 2). These individuals and their households could have experienced violent or non-violent crimes; through the GSS, information on the type and number of incidents was captured.
In total, there were 8.3 million criminal incidents in Canada in 2019 (Table 1). Most (69%) of these were non-violent in nature. About 3 million of these incidents were theft of personal property, the most common type of crime, which accounted for more than one-third (37%) of all criminal incidents reported to the GSS. Physical assault, the most common type of violent crime, followed at 17% of all incidents.
After these two crime types, which accounted for more than half of all incidents reported to the GSS, the next most frequent were theft of household property (12%), sexual assault (11%), vandalism (8%), and break and enter (8%). Motor vehicle theft (4%) and robbery (3%) were relatively less common.
Most (58%) of those who were victimized, whether personally or their household, experienced one victimization incident in the past 12 months. However, more than four in ten (42%) of those who were victimized reported two or more incidents.
Start of text box 2
Text box 2
Definition of criminal victimization in Canada
The General Social Survey on Victimization asked Canadians about their experiences with eight types of offences, which are:
Violent victimization: Sexual assault, robbery or physical assault.
- Sexual assault: Forced sexual activity, attempted forced sexual activity, unwanted sexual touching, grabbing, kissing or fondling, or sexual relations without being able to give consent.
- Robbery: Theft or attempted theft in which the offender had a weapon or there was violence or the threat of violence against the victim.
- Physical assault: An attack (victim hit, slapped, grabbed, knocked down, or beaten), a face-to-face threat of physical harm, or an incident with a weapon present.
Theft of personal property: Theft or attempted theft of personal property such as money, credit cards, clothing, jewellery, purse or wallet. Unlike robbery, the offender does not confront the victim.
Household victimization: Break and enter, theft of motor vehicle or parts, theft of household property or vandalism.
- Break and enter: Illegal entry or attempted entry into a residence or other building on the victim’s property.
- Theft of motor vehicle or parts: Theft or attempted theft of a car, truck, van, motorcycle, moped or other vehicle, or part of a motor vehicle.
- Theft of household property: Theft or attempted theft of household property such as liquor, bicycles, electronic equipment, tools or appliances.
- Vandalism: Wilful damage of personal or household property.
End of text box 2
Violent victimization
According to the GSS, there were just over 2.6 million incidents of violent victimization (sexual assault, robbery, and physical assault) in Canada in 2019, a rate of 83 incidents for every 1,000 Canadians 15 years of age and older (Table 1; Chart 1). More specifically, there were 46 incidents of physical assault, 30 sexual assaults, and 7 robberies for every 1,000 Canadians in 2019.
Chart 1 start

Data table for Chart 1
| Type of victimization | Rate per 1,000 population | Standard error |
|---|---|---|
| Sexual assaultData table for Chart 1 Note 1 | 30 | 4.7 |
| RobberyData table for Chart 1 Note 1 | 7 | 1.3 |
| Physical assaultData table for Chart 1 Note 1 | 46 | 3.6 |
| Total violent victimizationData table for Chart 1 Note 2 | 83 | 6.1 |
| Break and enterData table for Chart 1 Note 3 | 42 | 2.8 |
| Motor vehicle/parts theftData table for Chart 1 Note 3 | 20 | 1.9 |
| Theft of household propertyData table for Chart 1 Note 3 | 65 | 3.3 |
| VandalismData table for Chart 1 Note 3 | 45 | 3.0 |
| Total household victimizationData table for Chart 1 Note 4 | 172 | 6.2 |
| Theft of personal propertyData table for Chart 1 Note 1 | 98 | 4.9 |
Source: Statistics Canada, General Social Survey on Canadians’ Safety (Victimization). |
||
Chart 1 end
These findings are similar to police-reported data from the Uniform Crime Reporting (UCR) survey, which also show that physical assault is the most common type of violent crime and that sexual assault is more common than robbery (Moreau et al. 2020).Note
Household victimization
Household victimization––that is, theft of household property, vandalism, breaking and entering, and motor vehicle theft––accounted for about one in three (32%) criminal incidents reported to the GSS in 2019. In total, 2.6 million such incidents were reported, which translates to 172 incidents for every 1,000 households across the country (Table 1).
The most common type of household victimization in 2019 was theft of household property, with 984,000 incidents, or 65 for every 1,000 households. This was followed by vandalism (45 incidents per 1,000 households) and breaking and entering (42 per 1,000), while theft of a motor vehicle or parts was relatively less common (20 per 1,000).Note
Start of text box 3
Text box 3
Comparing self-reported victimization rates across Canada
Due to variations in mode of collection between individual provinces and territories, combined with a smaller sample size in the 2019 General Social Survey compared with past cycles, when looking at smaller levels of geography, many estimates and comparisons should be interpreted with caution.
There were relatively few significant differences in the prevalence of violent victimization across the provinces and territories in 2019 (Table 2). The rate of violent victimization was lower in Quebec (49 incidents per 1,000 population) and higher in Nunavut (290 per 1,000) and the Northwest Territories (187 per 1,000). Otherwise, no other provinces or territories had a violent victimization rate significantly different from the rest of Canada.Note
Likewise, in 2019, the violent victimization rate did not differ significantly between those living in census metropolitan areasNote (CMAs), census agglomerationsNote (CAs), or areas outside of CMAs or CAs (82, 92, and 82 per 1,000, respectively).
Compared to violent crime, there was much more variation in the rate of household victimization across the country (Table 2). The pattern in the provinces tended to follow that which is seen in police-reported data, where lower rates were found from Ontario to the east and higher rates from Manitoba to the west. New Brunswick, where the household victimization rate did not differ significantly from the rest of Canada, was the sole exception.
Among the territories, the rate of household victimization was higher in Nunavut (243 incidents per 1,000 households) relative to the rest of Canada. In contrast, the rates in Yukon and the Northwest Territories were not significantly different from the rest of Canada in 2019.
Trends in theft of personal property more closely resembled what was seen with household victimization (Table 2). Among the provinces, rates were higher in British Columbia (149 per 1,000 population), Alberta (133), and Saskatchewan (132), while they were lower than the national average in Quebec (68), Newfoundland and Labrador (66), and Nova Scotia (58).
In the territories, the rates of theft of personal property varied. The rate in Yukon was not significantly different from the rest of Canada, while it was higher in the Northwest Territories (204 per 1,000 population) and considerably lower in Nunavut (43).
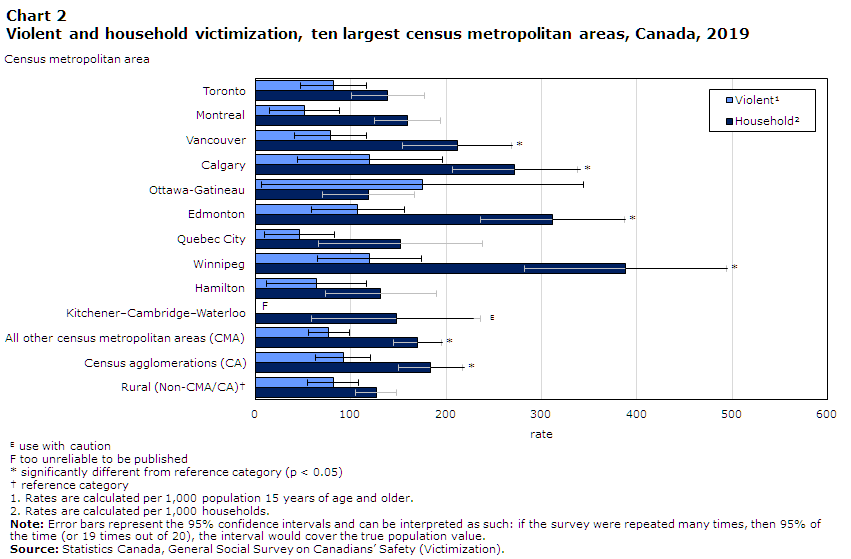
Few significant differences in violent victimization across 10 largest census metropolitan areas
In 2019, there was little variation in violent victimization rates across Canada’s largest CMAs. None of the ten largest CMAs in 2019 had violent victimization rates that significantly differed from rural areasNote (Chart 2). In fact, when comparing the ten largest CMAs to each other, rates in Québec (47 per 1,000) and Montréal (52 per 1,000) were significantly lower than the rate in Winnipeg (120 per 1,000). There were no other significant differences among these CMAs.
Chart 2 start
Data table for Chart 2
| Census metropolitan area | ViolentData table for Chart 2 Note 1 | HouseholdData table for Chart 2 Note 2 | ||
|---|---|---|---|---|
| rate | standard error | rate | standard error | |
| Toronto | 82 | 17.7 | 139 | 19.6 |
| Montréal | 52 | 18.8 | 160 | 17.7 |
| Vancouver | 79 | 19.2 | 212Note * | 29.1 |
| Calgary | 120 | 38.7 | 272Note * | 33.6 |
| Ottawa-Gatineau | 176 | 86.2 | 119 | 24.5 |
| Edmonton | 108 | 24.8 | 312Note * | 38.4 |
| Quebec City | 47 | 18.8 | 152 | 43.8 |
| Winnipeg | 120 | 27.7 | 388Note * | 54.0 |
| Hamilton | 64 | 26.7 | 132 | 29.7 |
| Kitchener–Cambridge–Waterloo | Note F: too unreliable to be published | Note F: too unreliable to be published | 148Note E: Use with caution | 45.0 |
| All other census metropolitan areas (CMA) | 77 | 11.0 | 170Note * | 13.0 |
| Census agglomerations (CA) | 92 | 14.7 | 183Note * | 17.1 |
| Rural (Non-CMA/CA)Data table for Chart 2 Note † | 82 | 13.6 | 127 | 11.1 |
|
E use with caution F too unreliable to be published
Source: Statistics Canada, General Social Survey on Canadians’ Safety (Victimization). |
||||
Chart 2 end
In contrast, there was once again more variation when it came to household victimization. Rates in Winnipeg (388 per 1,000 households), Edmonton (312), Calgary (272), and Vancouver (212) were all higher than the rates observed in rural areas across the country (127).
End of text box 3
Factors associated with victimization rates in Canada
In addition to asking about experiences of victimization, the GSS also includes a wide range of socio-demographic questions, questions about adverse experiences during childhood, and questions related to health and lifestyle. These questions allow for a more detailed examination of victimization rates by certain characteristics, and help identify certain populations where the prevalence or risk of victimization is elevated.
In the sections that follow, these characteristics are examined in two separate manners. First, victimization rates across certain groups are discussed to present the overall context of victimization rates in Canada in 2019. Second, recognizing that many of the characteristics related to victimization are intersectional and interrelated, a regression analysis was conducted to explore which factors influence the odds of victimization when other factors are held constant. Where relevant, both violent and household victimization are discussed.
Victimization rates higher among younger Canadians
As is consistently seen in victimization research, age is associated with the prevalence of violent victimization (Perreault 2015; Sidique 2016). GSS data show that rates consistently declined with age, with victimization rates considerably lower among those 35 years of age or older when compared to those who were 15 to 24 years of age (176 incidents per 1,000 population) or 25 to 34 years of age (135 per 1,000) (Table 3).Note Generally, it appeared that the decline in victimization began at the age of 35 (Chart 3).
Chart 3 start

Data table for Chart 3
| Age group (years) | Rate per 1,000 population | Standard error |
|---|---|---|
| 15 to 19Data table for Chart 3 Note † | 200 | 60.5 |
| 20 to 24 | 156 | 35.6 |
| 25 to 29 | 145 | 25.4 |
| 30 to 34 | 125 | 22.1 |
| 35 to 39 | 72Note * | 13.0 |
| 40 to 44 | 88 | 17.9 |
| 45 to 49 | 85 | 17.5 |
| 50 to 54 | 60Note * | 12.4 |
| 55 to 59 | 48Note * | 9.5 |
| 60 to 64 | 36Note * | 7.2 |
| 65 to 69 | 29Note * | 6.1 |
| 70 to 74 | 16Note * | 7.4 |
| 75 and older | 15Note * | 4.3 |
Source: Statistics Canada, General Social Survey on Canadians’ Safety (Victimization). |
||
Chart 3 end
Likewise, the odds of being a victim of violent crime decrease with age, even when holding other factors constant––with a 3% decline for each additional year of age (Model 1).Note
In particular, rates of sexual assault were higher among 15 to 24 year olds (103 per 1,000) and 25 to 34 year olds (50 per 1,000) than any other age group.Note Among Canadians 65 years of age and older, there were 2 incidents of sexual assault per 1,000 population.
Women violently victimized at a rate nearly double that of men
According to the GSS, the rate of violent victimization was nearly twice as high among women (106 incidents per 1,000 women) than men (59 incidents per 1,000 men) in 2019 (Table 3). This difference was driven entirely by sexual assault, the rate of which was more than five times higher among women (50 per 1,000) than men (9 per 1,000) (Chart 4). In contrast, the rates of physical assault and robbery experienced by women and men were similar. Even after controlling for other factors of interest, such as age and other individual characteristics and experiences, the odds of being victimized were 38% higher for women than men (Model 1).
Chart 4 start

Data table for Chart 4
| Type of victimization | WomenData table for Chart 4 Note † | Men | ||
|---|---|---|---|---|
| rate per 1,000 population | standard error | rate per 1,000 population | standard error | |
| Sexual assault | 50 | 8.9 | 9Note * | 2.2 |
| Robbery | 7 | 1.8 | 7 | 1.9 |
| Physical assault | 49 | 5.4 | 43 | 4.6 |
| Total violent victimization | 106 | 10.6 | 59Note * | 5.9 |
Source: Statistics Canada, General Social Survey on Canadians’ Safety (Victimization). |
||||
Chart 4 end
The finding that women are at a greater risk of being a victim of a violent crime is considerably different from what is seen in police-reported data, where the overall rate of violent crime is only slightly higher among women than men; in 2019, women accounted for 53% of victims of police-reported violent crime (Conroy 2021). This difference can be attributed to several factors. Police-reported data includes a broader range of types of violent crime than does the GSS, which asks only about sexual assault, robbery, and physical assault. In addition, sexual assault is vastly underreported to police, meaning that a large part of violent crime that disproportionately affects women is the least likely to be reflected in official data (see the section Reporting victimization to police). About three-quarters (72%) of all violent victimization incidents reported to the GSS by men in 2019 were physical assaults, while smaller proportions were sexual assaults (16%) or robberies (12%). In contrast, among women, sexual (47%) and physical assaults (46%) were about equally common, with robberies accounting for the remainder of violent incidents (7%).
Furthermore, looking at age in conjunction with gender reveals that most of the difference in victimization rates between women and men is found among those under the age of 35 (Chart 5). Once again, this difference was largely the result of the variation in rates of sexual assault between women and men. Among those who were 15 to 24, the rate of sexual assault was 7 times higher among women (187 per 1,000) than men (27 per 1,000), while it was 5 times higher among women who were 25 to 34 years of age (85 per 1,000) than men of the same age (16 per 1,000). These findings, and the different context about victimization that is apparent when including crimes that may not come to the attention of police, underscore the fact that self-reported data is critical when it comes to making sound prevention and programming decisions.
Chart 5 start

Data table for Chart 5
| Age group (years) | Women | Men | ||
|---|---|---|---|---|
| rate per 1,000 population | standard error | rate per 1,000 population | standard error | |
| 15 to 24Data table for Chart 5 Note † | 257 | 64 | 103Note ** | 28 |
| 25 to 34 | 179 | 29 | 91Note ** | 17 |
| 35 to 44 | 83Note * | 17 | 75 | 13 |
| 45 to 54 | 98Note * | 19 | 42Note *** | 8 |
| 55 to 64 | 45Note * | 8 | 39Note * | 9 |
| 65 and older | 24Note * | 5 | 15Note * | 3 |
Source: Statistics Canada, General Social Survey on Canadians’ Safety (Victimization). |
||||
Chart 5 end
Among the other age groups, the only other significant difference was seen among those 45 to 54 years of age, where the victimization rate was about twice as high among women than men.
Violent victimization rates far higher among bisexual Canadians
As other Canadian victimization surveys have found (Jaffray 2020; Simpson 2018), sexual orientation is a factor associated with violent victimization, with those who are not heterosexual at greater risk. More specifically, the odds of being a victim of violent crime were twice as high for those who were not heterosexual when controlling for other factors (Model 1).
Results from the 2019 GSS mirrored those found in other surveys which have shown that bisexual people in particular have elevated victimization rates. In 2019, the violent victimization rate among bisexual Canadians was 655 incidents per 1,000 population, over nine times higher than that of heterosexual Canadians (70 per 1,000) (Table 3). More than eight in ten (83%) of all incidents reported by those who were bisexual were sexual assaults, translating to a rate of 541 sexual assault incidents per 1,000 population––nearly 29 times higher than the rate among heterosexual Canadians (19 per 1,000). There were no statistically significant differences in victimization rates between heterosexual Canadians and those who were lesbian or gay.
These findings are similar to what was seen in the 2018 Survey of Safety in Public and Private Spaces, where bisexual women and men were more likely than heterosexual or lesbian or gay women and men to have been physically or sexually assaulted in the 12 months preceding the survey (Cotter and Savage 2019). However, both bisexual and lesbian or gay women and men were more likely to have been physically or sexually assaulted since age 15 when compared to their heterosexual counterparts.
On its own, being an Indigenous person did not increase risk of violent victimization
In 2019, the rate of violent victimization among First Nations, Métis, or Inuit (Indigenous) people (177 per 1,000) was more than double that among non-Indigenous people (80 per 1,000) (Table 3). More specifically, this difference was due to considerably higher rates among Métis (225 violent incidents per 1,000 population) and Inuit (265E per 1,000), while the violent victimization rate among First Nations people was not statistically different from that for non-Indigenous people.
Although the victimization rates among Indigenous people were considerably higher, after controlling for other characteristics, such as age, gender, and childhood maltreatment, Indigenous identity was not associated with a greater likelihood of violent victimization (Model 1).
This suggests that the higher victimization rates among these populations may be related to a higher prevalence of other risk factors among Indigenous people. For example, childhood maltreatment is a significant risk factor for future victimization, and Indigenous people experience higher rates of physical and sexual abuse during childhood, owing to historical and ongoing trauma and violence brought on by colonization, residential schools, the overrepresentation of Indigenous people in the child welfare system, disproportionate rates of child poverty, and higher rates of homelessness, among other factors (Gore 2013; Andersson and Nahwegahbown 2010; Missing and Murdered Indigenous Women and Girls 2019). It could also be the case that the factors related to the differences were not measured by the GSS.
Women with a disability experience particularly high rates of violent victimization
Rates of violent victimization were almost 3 times higher among those with a disability (141 incidents per 1,000) than among those without (53 per 1,000) (Table 3). More specifically, the rates of all three types of violent crime measured by the GSS––sexual assault, robbery, and physical assault––were higher among those with a disability.
Notably, when looking at those without a disability, there was no statistically significant difference between women (57 incidents per 1,000) and men (49 per 1,000). In other words, the elevated rates of violent victimization among women with a disability were a key reason for the overall higher victimization rate recorded among all women. There were 184 violent incidents for every 1,000 women with a disability in 2019, well above the rates recorded among men with a disability (84 per 1,000).
More specifically, women with a disability were sexually assaulted at a much higher rate. There were 94 incidents of sexual assault for every 1,000 women with a disability in 2019, a rate over four times higher than that among women without a disability (22), and well above the rates among men with (15) or without (7) a disability.Note
The violent victimization rate among those designated as belonging to a visible minority groupNote did not differ significantly from that among non-visible minorities (Table 3). That said, the rate of physical assault (30 per 1,000) was lower among the visible minority population than among the non-visible minority population (51 per 1,000).
The violent victimization rate was lower among those who identified as Chinese (32 per 1,000), whether compared to the total visible minority population or non-visible minorities. In contrast, the rate among those who were Filipino (73) was not statistically different from the overall visible minority or non-visible minority population.Note
Persons with a disability and visible minority groups did not have significantly different odds of victimization after controlling for other factors (Model 1). Similar to what was seen when looking at Indigenous identity as a risk factor, this suggests that the differing victimization rates among these populations may be related to the higher prevalence of other risk factors among these groups.
Childhood experiences of abuse, harsh parenting, neglect, or witnessing violence associated with higher rates of violent victimization
In addition to individual characteristics such as age, gender, identity, or disability, other experiences over the life course can influence the future likelihood of experiencing victimization. In particular, adverse childhood experiences such as physical abuse, sexual abuse, harsh parenting or neglect, or being exposed to violence in the home have all been consistently shown to be linked to subsequent experiences of victimization in adulthood (Burczycka 2017; Strom 2020; Widom et al. 2008). Findings from the 2019 GSS provide further support to these links.
About one in five (22%) Canadians reported experiencing physical abuse perpetrated by an adult before the age of 15. In 2019, those who were physically abused before the age of 15 were violently victimized at a rate of 170 incidents per 1,000 population, three times higher than the rates observed among those who were not physically abused as children (57 per 1,000) (Table 4).
Sexual abuse during childhood less common than physical abuse but has a greater impact on odds of future victimization
Relative to physical abuse, sexual abuse during childhood was less frequently reported by Canadians (6% in total; 10% of women versus 3% of men). However, it seems to have had an even larger impact on experiences of violent victimization in adulthood; the victimization rate was more than 3 times higher among those who were sexually abused as children (238 incidents per 1,000) than among those who were not (72 per 1,000) (Table 4). Those who were sexually abused as children reported both sexual assault (96 per 1,000) and physical assault (124 per 1,000) at rates three times higher than those who were not sexually abused (26 and 40, respectively).
Experiencing physical or sexual abuse during childhood was associated with higher rates of victimization in adulthood for both women and men. However, the impact was more notable among women––those who were physically or sexually abused during childhood had a victimization rate nearly four times higher than those who were not (227 per 1,000 versus 59 per 1,000). Among men, those who were abused as children had a victimization rate in 2019 that was double those who were not (98 versus 46).
Harsh parenting, witnessing violence also associated with higher victimization rates
In contrast to physical or sexual abuse, instances of harsh parenting or neglect––that is, being spanked, their parents saying hurtful things, being made to feel unloved or unwanted, or not having their basic needs met––were considerably more common among Canadians. More than six in ten (62%) reported experiencing at least one instance of harsh parenting before the age of 15 (Table 4). In addition to being more common than other adverse childhood experiences, it also had a large impact on victimization in adulthood. Those who experienced harsh parenting or neglect before the age of 15 had a victimization rate in 2019 that was nearly four times higher than those who did not (115 per 1,000 and 30 per 1,000, respectively).
Notably, it is not only direct experiences of violence during childhood that are linked with subsequent victimization in adulthood. One in five (21%) Canadians reported that they witnessed violence committed by a parent or guardian against another parent, guardian, caregiver, adult, or child, and the violent victimization rate among these individuals was nearly three times higher than among those who were not exposed to this type of violence (163 per 1,000 versus 61 per 1,000) (Table 4).
There was, however, considerable overlap between those who were abused and those who witnessed violence during their childhood; two-thirds (66%) of those who witnessed their parent or caregiver commit violence against another person also experienced violence during their childhood, compared with 15% of those who did not witness violence.Note Those who were both directly victimized as well as exposed to violence against another person were violently victimized at a rate of 204 incidents per 1,000 population, just over four times higher than the rate among those who never witnessed or experienced violence during their childhood (49 per 1,000), and also considerably higher than the rate among those who were abused but never witnessed violence (119 per 1,000). The violent victimization rate among those who were exposed to violence but did not experience it themselves was not statistically different from those who never witnessed or experienced violence.Note
Furthermore, while these three measures refer to somewhat similar experiences, a multivariate analysis of factors related to violent victimization showed that childhood abuse, harsh parenting, and witnessing violence between parents or caregivers each had an independent effect on the odds of being victimized (Model 1). After controlling for other variables of interest, the odds of being victimized were 2.0 times higher among those who experienced harsh parenting, 1.6 times higher among those who were physically or sexually abused, and 1.5 times higher among those who witnessed violence.
Looking at the clear relationship between adverse childhood experiences, both direct and indirect, and subsequent victimization in adulthood suggests that, when developing programs and policies to reduce crime and victimization, special attention should be devoted to children and youth in order to counter the cycle of victimization.
Start of text box 4
Text box 4
New data on child maltreatment in Canada
Retrospective questions on childhood experiences of physical and sexual abuse were first added to the 2014 General Social Survey (GSS) on Victimization to capture information on experiences of violence during childhood as well as the associations between these experiences and victimization in adulthood, among other adverse impacts. These questions were subsequently repeated in the 2018 Survey of Safety in Public and Private Spaces (SSPPS) and the 2019 GSS.
These surveys all showed similar results: a considerable proportion of Canadians had experienced physical or sexual abuse committed by an adult before they were 15; men were slightly more likely to experience physical abuse while women were far more likely to have been sexually abused; most victimization was not reported to police or other agencies (i.e., child protective services), and; that these experiences of violence during childhood were linked to subsequent victimization in adulthood and indeed, across the life course (Burczycka 2017; Cotter and Savage 2019; Cotter 2021).
While these questions provided critical information, some gaps remained and for that reason the 2019 GSS introduced more detailed questions asking about the gender of the perpetrator, the location of the incident, and age at the time of the incident. These questions were asked separately for physical abuse and sexual abuse; those who had been abused more than once were asked about the most serious instance they experienced.
Two-thirds (66%) of men who were physically abused during their childhood stated that a man was responsible, as did half of women (51%). The vast majority (85%) of incidents took place in a private residence, most commonly the victim’s own home (79%), the offender’s home (4%), or another private residence (1%). A further 8% of incidents took place at school, on school grounds, or on a school bus. Many of those who were physically abused said they did not remember how old they were at the time of the incident (39%), while about three in ten were under the age of 12 (30%) or between the ages of 12 and 14 (28%).
Sexual abuse was also more commonly perpetrated by a man, but to a much greater extent than physical abuse. In total, 93% of those who were sexually abused during childhood said a man was responsible––96% of women and 84% of men. As with physical abuse, most incidents (78%) took place in a private residence; compared to physical abuse, a relatively smaller proportion took place in the victim’s own home (40%) while more occurred in the offender’s home (28%) or another private residence (10%).
Compared with physical abuse, a smaller proportion (15%) of victims said they did not remember their age at the time of the incident. Almost half (48%) of those who were sexually abused before age 15 said that they were under 12 at the time of the incident, while one-third (34%) were between the ages of 12 and 14.
End of text box 4
Evening activities outside the home, marijuana use associated with victimization
Many lifestyle characteristics have been linked to victimization—both as risk factors and as consequences or ways to cope with having been victimized. For instance, binge drinking—defined as having had 5 or more drinks on one occasion—and use of non-prescribed drugs other than marijuana were both associated with higher violent victimization rates in 2019, when compared with those who did not engage in these activities (Table 4). However, after controlling for other relevant characteristics, neither of these remained significant factors in predicting victimization.
On the other hand, the violent victimization rate in 2019 was almost four times higher among those who had consumed marijuana in the past 30 days (217 per 1,000) than those who had not (58 per 1,000). Additionally, this remained significant even after taking other factors into account (Model 1).
An increased frequency of evening activities, which could include going to work, school, bars, clubs, restaurants, shops, or other similar activities, was also associated with elevated risk of violent victimization. Not only was the violent victimization rate much higher among those with 20 or more such activities per month (153 per 1,000) when compared to those with 0 to 9 (57 per 1,000) or 10 to 19 (77 per 1,000) activities,Note but after controlling for other factors, each additional evening activity increased the odds of victimization by 2% (Table 4, Model 1).
Experiences of homelessness associated with violent victimization
Almost one in ten (9%) Canadians indicated that, at some point in their life, they had been homeless––that is, they lived in a shelter, on the street, or had to stay with family or friends because they had nowhere else to go. In the 12 months preceding the survey, those who had been homeless reported violent victimization at a rate that was three times higher than those who had never been homeless (207 and 70 incidents per 1,000 population, respectively) (Table 4). Not only that, having been homeless increased the likelihood of being victimized after controlling for other factors (Model 1).
When experiences of homelessness were more recent, it had an even greater influence on violent victimization. In all, 3% of individuals said that they had been homeless at some point in the 5 years preceding the survey, and their violent victimization rate (311 incidents per 1,000) was nearly five times higher than among those who were never homeless.
Perceptions of social disorder in neighbourhood linked to higher victimization rates
Social disorder and crime are closely linked; they often appear to manifest in similar ways and can both influence perceptions of fear (Brunton-Smith 2011; Gau and Pratt 2008). Previous analysis has shown that perceptions of neighbourhood disorder are linked to elevated victimization rates, higher levels of fear when walking alone after dark, using or taking public transportation, or when home alone, and generally lower levels of life satisfaction (Perreault 2015; Cotter 2016).
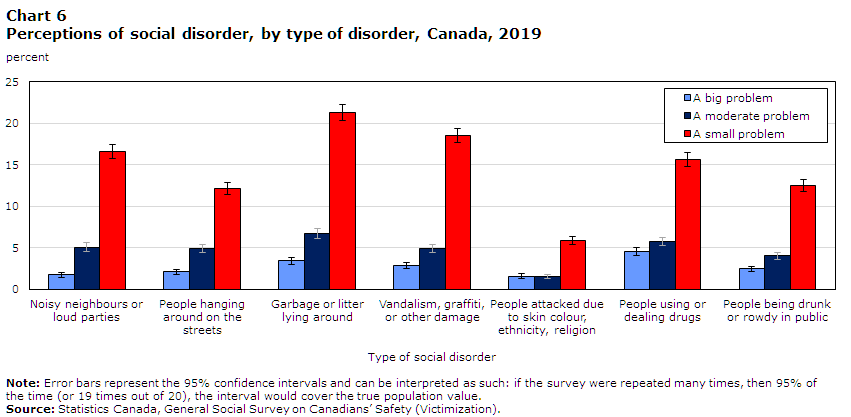
The GSS asked if certain signs of social or physical disorder were problems in their neighbourhood. In all, nearly six in ten (56%) Canadians perceived some type of disorder in their neighbourhood. More specifically, 9% perceived at least one big problem, 14% perceived no big problems but at least one moderate problem, and 34% at least one small problem.
Of the potential signs of disorder measured by the survey, the most common were garbage or litter lying around (31%), vandalism, graffiti, or other damage to property or vehicles (26%), and people using or dealing drugs (26%) (Chart 6). Most commonly, these––like the other types of disorder measured––were perceived to be small problems.
Chart 6 start
Data table for Chart 6
| Type of social disorder | A big problem | A moderate problem | A small problem | |||
|---|---|---|---|---|---|---|
| percent | standard error | percent | standard error | percent | standard error | |
| Noisy neighbours or loud parties | 1.8 | 0.2 | 5.1 | 0.3 | 16.6 | 0.4 |
| People hanging around on the streets | 2.1 | 0.2 | 4.9 | 0.3 | 12.2 | 0.4 |
| Garbage or litter lying around | 3.4 | 0.2 | 6.7 | 0.3 | 21.3 | 0.5 |
| Vandalism, graffiti, or other damage | 2.9 | 0.2 | 4.9 | 0.3 | 18.6 | 0.4 |
| People attacked due to skin colour, ethnicity, religion | 1.6 | 0.2 | 1.6 | 0.1 | 5.9 | 0.3 |
| People using or dealing drugs | 4.5 | 0.2 | 5.8 | 0.2 | 15.7 | 0.4 |
| People being drunk or rowdy in public | 2.5 | 0.2 | 4.1 | 0.2 | 12.5 | 0.4 |
|
Note: Error bars represent the 95% confidence intervals and can be interpreted as such: if the survey were repeated many times, then 95% of the time (or 19 times out of 20), the interval would cover the true population value. Source: Statistics Canada, General Social Survey on Canadians’ Safety (Victimization). |
||||||
Chart 6 end
Victimization rates, both violent and household, were higher among those who perceived at least one small problem in their neighbourhood in 2019. There were 112 violent incidents per 1,000 population among those who perceived at least a small problem, well above the 46 incidents per 1,000 among those who did not perceive any problems. More specifically, violent victimization rates were highest among those who perceived at least one big problem (273), followed by those who perceived a moderate problem (130), while those who perceived a small problem were victimized at a rate similar to those who perceived no disorder at all.
Likewise, household victimization rates were nearly three times higher among those perceiving social disorder (240 per 1,000 households) than those who perceived none (84).
Notably, perceiving social disorder in one’s neighbourhood was associated with higher odds of being a victim of both violent and household crime, even after controlling for other relevant factors. As with certain other characteristics, this could be a risk factor for victimization (i.e., living in an area with higher levels of social disorder) or a result of victimization (i.e., perceiving one’s neighbourhood or area more negatively after having been victimized).
One in ten Canadians felt that people being attacked or harassed due to their skin colour, ethnicity, or religion was a big (2%), moderate (2%), or small (6%) problem in their neighbourhood, lower than any other indicator of neighbourhood disorder However, those belonging to a visible minority group were more likely than those who did not belong to a visible minority group to perceive this to be a problem (13% versus 8%). This finding aligns with results from a crowdsourcing initiative conducted during the COVID-19 pandemic, where visible minority participants were more likely to believe these types of incident took place sometimes or often (Statistics Canada 2020).
Start of text box 5
Text box 5
Experiences of discrimination in Canada
Like victimization, experiences of discrimination are linked to perceptions of safety and overall well-being (Todorova et al. 2010). Based on the 2019 General Social Survey (GSS) on Victimization, one in five (20%) Canadians 15 years of age and older said that they had been discriminated against or treated unfairly at least once in the 5 years preceding the survey.
There are many reasons for which people may perceive discrimination or unfair treatment; according to the GSS, the most common were race or skin colour (8%), ethnicity or culture (6%), physical appearance (other than skin colour) (6%), sex (6%), or age (5%).Note Among those who perceived discrimination or unfair treatment, more than half (55%) cited more than one factor.
Not only were there a variety of grounds for discrimination, but different groups were more likely to experience discrimination or unfair treatment. For example, 44% of those who were gay, lesbian, or bisexual said they were discriminated against or treated unfairly, compared with 19% of heterosexual people. Approximately one in three Indigenous women (33%) and men (32%), visible minorities (29%), or people with disabilities (28%) experienced discrimination in the past 5 years, considerably higher proportions than what was seen among the population who were non-Indigenous (19%), non-visible minority (17%), or did not have disabilities (15%). More women (23%) than men (17%) reported experiencing discrimination.
Among those who were discriminated against, the most common situations were at work or when applying for a job (45%) or at a bank, store, or restaurant (35%). Discrimination in the school environment was less common, but still cited by one in five (19%) of those who experienced discrimination. Furthermore, some of those who experienced discrimination said it was when dealing with the police (6%), when crossing the border into Canada (5%), or when dealing with the courts (3%).
End of text box 5
Higher family income linked to lower violent, higher household victimization rates
Self-reported criminal victimization in Canada in 2019 was related to family income. The violent victimization rate was nearly twice as high among those with a family income of less than $40,000 (121 per 1,000) than those whose family income was $120,000 or more (67 per 1,000).
In contrast, higher income was associated with higher rates of household and property crime. Those with an income of $120,000 or more had higher levels of household victimization (194 per 1,000 households) and theft of personal property (116 per 1,000 population) than did those whose income was less than $40,000 (157 per 1,000 households and 77 per 1,000 population, respectively).
The GSS also included questions on economic well-being, in order to examine potential links between victimization and additional stressors or difficulties related to income. For example, in 2019, one in ten (10%) Canadians said that they or their household were unable to pay a bill or make another scheduled payment. The violent victimization rate among this group was 187 per 1,000 population, well above the rate among those who did not report such difficulties (71 per 1,000). Similarly, the household victimization rate was also close to twice as high among those who faced economic struggles (303 per 1,000 households) than among those who did not (157 per 1,000).
After controlling for other factors, however, economic hardship was not a significant predictor of violent victimization. It did, however, remain significant when it came to household victimization, with those who were unable to pay scheduled bills or payments having 1.7 times higher odds of victimization.
Economic hardship can be a risk factor for victimization, but also an impact or result of having been victimized. For that reason, those who were victimized and also reported economic difficulties were asked if the difficulties they faced were due to the victimization they experienced. A minority (9%) directly identified their victimization as the reason for their financial struggles.
Residential mobility linked to higher rates of household victimization
Other than perceptions of social disorder and economic hardship, both of which independently increased the odds of household victimization even after controlling for other household characteristics,Note many other household characteristics did not appear to have an impact on levels of household victimization.
Household victimization rates were, with few exceptions, largely similar regardless of household size, living arrangement, type of dwelling, ownership, or number of generations in a household (Table 5). Among the exceptions, rates were lower among those living with a partner compared to those living alone, while those with a weak sense of belonging to their local community had higher rates. However, these factors did not remain significant once other household or neighbourhood characteristics were taken into account.
One factor that did remain significantly related to victimization was residential mobility, or the number of times the respondent changed residences in the past 5 years. Those who moved once or not at all had both lower household victimization rates overall and lower odds of household victimization after controlling for other factors when compared to those who had moved twice or three or more times (Table 5).
On the other hand, living in a rural area of the provinces, as opposed to an urban area of the provinces or in the territories, resulted in lower odds of household victimization.
Start of text box 6
Text box 6
Other new content in the 2019 General Social Survey on Victimization
With each cycle of the General Social Survey (GSS) on Victimization, new content is incorporated in order to respond to new data needs or to improve the way in which data is collected. For the 2019 cycle, two key additions were the introduction of a series of questions on fraud and the expansion of questions measuring violence committed in the context of a dating relationship.
Self-reported data on fraud in Canada
With more and more financial transactions occurring online in recent years, concerns about fraud have been rising to the forefront among law enforcement and Canadians in general. Fraud is difficult to track and much of it is not brought to the attention of police. Despite that, over the past decade, police-reported incidents of fraud have increased 64% (Moreau et al. 2020). In 2019 the GSS on Victimization included, for the first time, a brief module on fraud to capture self-reported information on this emerging crime type.Note
Close to three quarters (73%) of Canadians felt that, compared to 5 years ago, fraud in Canada has increased. Furthermore, many did not feel that their personal information was secure from fraud––one in three (34%) felt their information was not very secure, and one in ten (10%) said it was not at all secure from fraud. Almost all (95%) Canadians had taken some sort of action to protect themselves from fraud in the past 12 months, such as shredding personal mail, bills or receipts, reviewing bank statements, screening telephone calls, or deleting suspicious emails.
About one in six Canadians reported being a victim of fraud
In the five years preceding the survey, more than 5 million Canadians—or 17% of the population 15 years of age and older—reported that they had been a victim of fraud.Note The most common type of self-reported fraud was having someone successfully use their personal information or account details to obtain money or buy goods and services (12%). The majority (61%) of those who reported that they were victims of fraud experienced some sort of monetary loss as a result. Most commonly, victims did not know how their personal information was obtained (41%), though a considerable proportion of fraud involved the copying or skimming of card details (19%).
The vast majority (89%) of those who were victims of fraud did not report to police. However, most incidents were reported in some manner—for example, two-thirds (65%) of victims said they reported the fraud to their bank or credit card company.
Dating violence
Information on violence committed by current and former legally married or common-law spouses has been part of the GSS on Victimization since 1999. More recently, the scope of spousal and ex-spousal violence has broadened to focus more generally on intimate partner violence to include, for example, violence committed by someone with whom the victim has a dating relationship. In 2014, information on dating violence was collected through two questions; in 2019, these questions were expanded to align with those used to measure spousal and ex-spousal violence to allow for better comparability as well as the calculation of an overall prevalence of intimate partner violence.
Results from the new questions on dating violence showed that 13% of women and 11% of men who had dated someone other than a current or former spouse or partner in the past 5 years experienced some form of physical or sexual violence committed by a dating partner over this period. These proportions were not statistically different. Similarly, women and men who had dated in the past 5 years were equally likely to have been emotionally or financially abused by someone they were dating (31% and 32%, respectively).
More detailed analysis of intimate partner violence based on data from the 2019 GSS will be available in future Juristat articles.
End of text box 6
Reporting victimization to police
Victims of crime may choose to report––or not report––an incident to police for a wide range of reasons. The GSS asked whether or not the incident was reported, as well as reasons for reporting or not reporting the incidents experienced. Of note, the information on reporting to police (and all other incident characteristics) that follows excludes incidents of spousal violence which were collected under a different methodology and will be analyzed in a future Juristat article.
In 2019, most incidents were not reported, with about three in ten (29%) coming to the attention of police. Most were reported directly by the respondent (22%) while some were reported in another way (7%).
Generally speaking, household victimization incidents were more likely than violent incidents to have been brought to the attention of the police (35% versus 24%) (Table 6). That said, the proportion of incidents that were reported to police varied widely depending on the specific type of crime (Chart 7). About half of motor vehicle thefts (52%), robberies (47%E), and break and enters (45%) were reported to police.
Chart 7 start

Data table for Chart 7
| Type of victimization | Percent reported to police | Standard error |
|---|---|---|
| Sexual assault | 6 | 2.0 |
| Robbery | 47Note E: Use with caution | 8.0 |
| Physical assault | 36 | 3.8 |
| Total violent victimizationData table for Chart 7 Note 1 | 24 | 2.5 |
| Break and enter | 45 | 3.4 |
| Motor vehicle/parts theft | 52 | 4.5 |
| Theft of household property | 20 | 1.8 |
| Vandalism | 37 | 3.3 |
| Total household victimizationData table for Chart 7 Note 2 | 35 | 1.5 |
| Theft of personal property | 28 | 2.2 |
| All crimes | 29 | 1.2 |
E use with caution
Source: Statistics Canada, General Social Survey on Canadians’ Safety (Victimization). |
||
Chart 7 end
Notably, sexual assault had the lowest rate of reporting of any crime measured by the GSS, with 6% of incidents in 2019 having come to the attention of police. This figure is consistent with results from other self-reported surveys conducted both before and after the #MeToo movement, which have found that sexual assault is much less likely than other types of crime to be reported to police, and that police-reported sexual assaults represent a fraction of all sexual assaults in Canada (Conroy and Cotter 2017; Cotter and Savage 2019; Rotenberg and Cotter 2018). When controlling for other incident characteristics, the odds of sexual assault being reported to police were about 80% lower than for other violent crimes (see Text box 8).
Unlike the other types of crime measured by the GSS, where most incidents that were reported to police were reported directly by the victim, sexual assaults were equally likely to come to the attention of police from the victim (2.4%) or some other way (3.3%).
Women were half as likely as men to have reported an incident of violent victimization to police (18% versus 36%). This difference was driven by sexual assault, where, as noted, the vast majority of victims were women and very few incidents were reported to police. When looking only at robbery and physical assault, the proportion of incidents brought to the attention of police were not significantly different between women and men (33% and 43%, respectively).
Younger victims of violent crime were less likely than their older counterparts to have reported the incident to police. Among those under 35 years of age, 16% indicated that the incident had been brought to the attention of police, compared to 38% among those 35 or older. These groups were equally likely to have reported household victimization to police, however.
Start of text box 7
Text box 7
Victimization and confidence in police
Recent analysis of the 2019 General Social Survey found that most Canadians had confidence in police; 41% had a great deal of confidence and 49% had some confidence (Ibrahim 2020). Many factors were associated with lower confidence in police, with the most influential factor being a previous negative encounter. Being a visible minority, an Indigenous person, or a person with a disability were also associated with lower levels of confidence in police.
In addition to these factors, experiences of victimization were also related to levels of confidence in police. Those who were victimized in 2019, whether personally or their household, had less confidence in police. More than one in five (22%) victims of violent crime had not very much or no confidence in the police, compared with 9% of those who were not violently victimized. Similarly, among those who reported household victimization, 18% had not very much or no confidence in the police, double the proportion among those who did not report household victimization.
Though experiences of victimization appear related to generally lower levels of confidence in police, they did not appear to be related to the decision to report an incident of victimization in 2019. Among those who had little or no confidence in police and were victims of violent or household crime, 31% said that the incident was reported to police, not statistically different from those who had a great deal (32%) or some (27%) confidence.
It is also possible that lower levels of confidence are due to a negative experience after having reported an incident to police. However, victims of crime who reported an incident were equally likely to have little or no confidence in police as those who were victimized but did not report (21% and 19%, respectively).
These patterns held consistent when looking specifically at violent incidents, household incidents, and only those incidents that were directly reported by the respondent.
Despite the majority of victims of crime choosing not to report to police, a large majority (91%) of Canadians felt that it was likely their neighbours would call the police if they witnessed what seemed like criminal behaviour. This was equally the case for victims (89%) and non-victims (92%) of crime.
Confidence in criminal courts, prisons, and the parole system
In addition to asking about confidence in police, the GSS also included questions about levels of confidence in other elements of the Canadian criminal justice system; namely, courts, prisons, and the parole system. Relative to levels of confidence in police, Canadians were less confident in the criminal courts, and markedly less so when it came to the prison and parole system (see Ibrahim 2020). Also of note, a large proportion––ranging from one-third to one-half––stated that they did not know whether the courts, prisons, or parole system were doing a good, average, or poor job for the key indicators measured in the GSS.
End of text box 7
Crime being perceived as minor or not important common reasons for not reporting to police
There are a wide variety of reasons for which a victim may choose not to report an incident to police. In 2019, about half of all victims of violent crime who did not report the incident to police said that they did not report because the crime was too minor (56%), the incident was not important enough (53%), they did not want the hassle of dealing with police (49%), the incident was private or personal (48%), or they felt no one was harmed (47%) (Table 6).
Many victims who did not report a violent incident to police cited concerns about the police or the criminal justice system as reasons why. For example, 37% of victims did not report the incident because they felt the offender would not be adequately punished, and 32% said that they feared or did not want the hassle of the court process. Some victims more specifically identified the police themselves as a reason, stating that they felt the police wouldn’t be able to find the offender (18%), would be biased (15%), or that they had received unsatisfactory service from police in the past (13%).
As with violent victimization, some of the most common reasons for not reporting household victimization were that the crime was too minor (71%) or that the incident wasn’t important enough (63%). Many of those who experienced household victimization did not report because they believed the police wouldn’t have been able to find the stolen property (57%) or because there was no financial loss (50%).
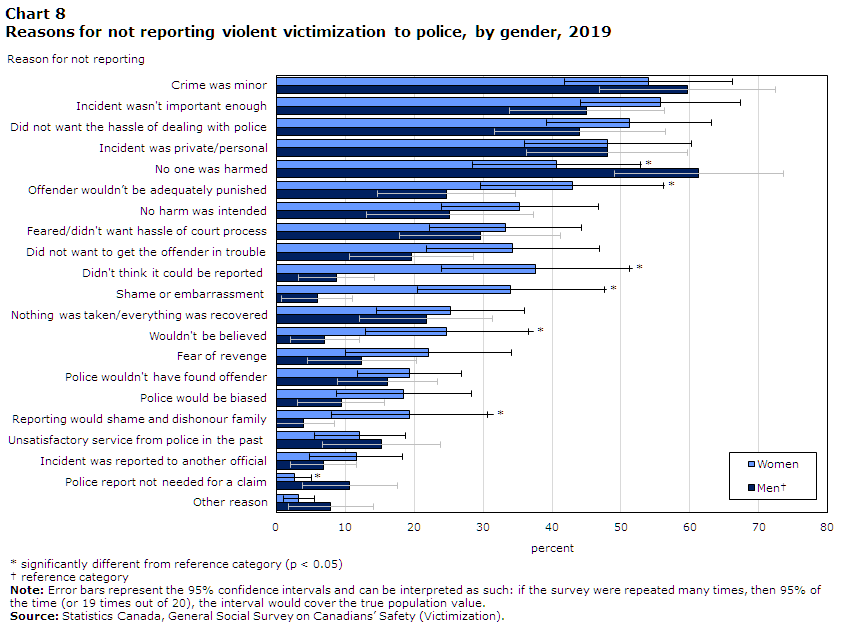
Women cite shame, not being believed as reasons for not reporting to police more than men
Women and men who were violently victimized often provided similar reasons for not reporting the incident to police, with the most common reasons being cited by similar proportions of women and men (Chart 8). That said, there were some key differences. Men were more likely to state that no one was harmed (61% versus 41% of women) and that a police report was not required for a claim (11% versus 3%). In contrast, women were more likely than men to cite a belief that the offender wouldn’t be adequately punished (43% versus 25%), that they didn’t think it could be reported to police (38% versus 9%), shame or embarrassment (34% versus 6%), feeling that they wouldn’t be believed (25% versus 7%), or that reporting would bring shame and dishonour to their family (19% versus 4%).
Chart 8 start
Data table for Chart 8
| Reason for not reporting | Women | MenData table for Chart 8 Note † | ||
|---|---|---|---|---|
| percent | standard error | percent | standard error | |
| Crime was minor | 54 | 6.2 | 60 | 6.5 |
| Incident wasn't important enough | 56 | 5.9 | 45 | 5.8 |
| Did not want the hassle of dealing with police | 51 | 6.1 | 44 | 6.3 |
| Incident was private/personal | 48 | 6.2 | 48 | 5.9 |
| No one was harmed | 41Note * | 6.2 | 61 | 6.3 |
| Offender wouldn’t be adequately punished | 43Note * | 6.8 | 25 | 5.1 |
| No harm was intended | 35 | 5.8 | 25 | 6.2 |
| Feared/didn't want hassle of court process | 33 | 5.6 | 30 | 5.9 |
| Did not want to get the offender in trouble | 34 | 6.4 | 20 | 4.6 |
| Didn't think it could be reported | 38Note * | 7.0 | 9 | 2.8 |
| Shame or embarrassment | 34Note * | 6.9 | 6 | 2.6 |
| Nothing was taken/everything was recovered | 25 | 5.5 | 22 | 4.9 |
| Wouldn't be believed | 25Note * | 6.1 | 7 | 2.5 |
| Fear of revenge | 22 | 6.2 | 12 | 4.1 |
| Police wouldn't have found offender | 19 | 3.9 | 16 | 3.7 |
| Police would be biased | 18 | 5.0 | 9 | 3.2 |
| Reporting would shame and dishonour family | 19Note * | 5.8 | 4 | 2.3 |
| Unsatisfactory service from police in the past | 12 | 3.4 | 15 | 4.4 |
| Incident was reported to another official | 12 | 3.4 | 7 | 2.4 |
| Police report not needed for a claim | 3Note * | 1.3 | 11 | 3.5 |
| Other reason | 3 | 1.1 | 8 | 3.1 |
Source: Statistics Canada, General Social Survey on Canadians’ Safety (Victimization). |
||||
Chart 8 end
The reasons more often cited by women than men are, by and large, reflective of the fact that women are far more likely to be sexually assaulted. Concerns about perpetrators not being held responsible, an understanding of what constitutes sexual assault, feelings of shame and embarrassment among victims, a perception that victims will not be believed, and concerns about shame and dishonour are often cited as barriers to reporting sexual assaults (Johnson 2012; Sable et al. 2006; Taylor and Gassner 2010; Venema 2014).
In fact, when comparing the reasons for not reporting sexual assault to those provided for not reporting physical assault or robbery, the results were similar to what was seen when comparing women and men. In addition, some other factors emerged. Most notably, not wanting the hassle of dealing with police (57%) or the court process (42%) were more commonly cited by victims of sexual assault than by those who experienced another type of violent victimization (40% and 21%, respectively). Hesitancy to engage with the formal criminal justice system, whether based on past experiences, the experiences of others, or fear that expectations will not be met, serves to deter reporting for many victims of sexual assault (Johnson 2017; Venema 2014).
Characteristics, impacts, and consequences of non-spousal violent victimization
In addition to measuring the prevalence of violent victimization, the General Social Survey on Canadians’ Safety includes questions on the characteristics of incidents, in addition to impacts, consequences, and actions taken by victims. This information is of critical importance to improve understanding of criminal victimization and the needs of victims, and much of it is generally not captured by official or administrative sources of data on crime. As with the information on reporting to police, the analysis of incident characteristics that follows excludes spousal violence.
In 2019, the most common location of violent incidents was a commercial or institutional establishment such as a bar or restaurant (43%), followed by the victim’s home or surrounding area (22%) or the street or another public place (19%) (Table 7). Incidents reported to police were more likely to have occurred in the victim’s home or surrounding area (36% versus 17% of those that were not reported), and less often took place in another private residence (6% versus 17%). For one in four (26%) victims of violent crime, the location of the incident was their workplace.
For both men and women, a commercial or institutional establishment was the most common location of their victimization. However, men were more likely to be victimized in a street or public place than were women (29% versus 14%). In contrast, women more often reported being victimized in a private residence other than their own when compared to men (20% versus 4%).
Most non-spousal incidents perpetrated by lone offender, usually a man
Most incidents (83%) were committed by a single perpetrator. This was more often the case for women (86%) than for men (76%). Multiple-offender incidents accounted for a larger proportion of incidents that were reported to police (22%) than among those that were not (6%) (Table 7).
Of all violent incidents with a single perpetrator in 2019, nine in ten (89%) were committed by a man. There were no significant differences in this proportion, regardless of whether the victim was a man (84%) or a woman (91%), if the incident was reported to police (86%) or not (89%), or if the incident was a sexual assault (93%) or a physical assault (87%).Note
Nearly half of all non-spousal violent incidents perpetrated by a stranger
Overall, close to half (48%) of all non-spousal violent victimization incidents in 2019 were committed by strangers, with a further four in ten (42%) perpetrated by a friend, neighbour, or acquaintance of the victim (Table 7). A small proportion (3%) were committed by a relative, with the remainder (7%) committed by someone with another type of relationship to the victim.
A friend, neighbour, or acquaintance was more likely to be the perpetrator of victimization against women (49% of incidents) than against men (30%). In contrast, nearly two-thirds (64%) of men were victimized by a stranger, compared with 39% of women.
Incidents committed by a stranger accounted for an even larger proportion of incidents that were reported to police. Of incidents that were reported to police, 60% were committed by a stranger, compared with 44% of incidents that were not reported. Incidents where the perpetrator was the victim’s friend, neighbour, or acquaintance accounted for 26% of incidents that came to the attention of police, but nearly half (47%) of incidents that did not.
Injury, presence of a weapon associated with greater likelihood of reporting to police
About one in seven (15%) victims of violent crime in 2019 stated that they were injured as a result of the incident, with most injuries not requiring medical attention (Table 7). That said, more than one-quarter (26%) of victims who reported the incident to the police were injured, compared with 11% of those who did not report the incident.
Weapons were present in one-quarter (25%) of violent incidents. Most commonly, the weapon was a bat, stick, rock, bottle, or other type of weapon (16%). Less often, victims reported that the perpetrator had a knife (8%) or a firearm (2%).Note
Similar to injuries, incidents where a weapon was present made up a larger proportion of incidents that were reported to police. Over half (52%) of incidents that were reported to police involved a weapon, compared with 16% of unreported incidents.
When controlling for key incident characteristics, injury and weapon emerged as factors that independently increased the likelihood of a non-spousal incident being reported to police (see Text box 8).
Most victims face emotional consequences of violent victimization; one in six report longer-term effects
Physical injury is not the only marker of the impact violence can have on victims; the emotional or psychological consequences of victimization are also of importance. The vast majority (87%) of those who were violently victimized in 2019 said that the incident had some emotional impact on them, a proportion that did not differ significantly between women and men.
Additionally, the GSS included questions on some longer-term consequences of violent victimization, based on symptoms that are consistent with post-traumatic stress disorder. More than one-quarter of victims felt constantly on guard, watchful, or easily startled (28%) or tried hard not to think about their victimization or avoided situations that reminded them of it (27%) (Chart 9). In all, about one in six (16%) victims reported three or more long-term psychological consequences.
Chart 9 start

Data table for Chart 9
| Longer-term impact | Percent | Standard error |
|---|---|---|
| Had nightmares about it or thought about it when you did not want to | 19 | 3.4 |
| Tried hard not to think about it or went out of your way to avoid situations that reminded you of it | 27 | 3.9 |
| Felt constantly on guard, watchful, or easily startled | 28 | 3.9 |
| Felt numb or detached from others, activities, or surroundings | 19 | 3.8 |
| Experienced three or more long-term effects | 16 | 3.7 |
|
Note: Error bars represent the 95% confidence intervals and can be interpreted as such: if the survey were repeated many times, then 95% of the time (or 19 times out of 20), the interval would cover the true population value. Source: Statistics Canada, General Social Survey on Canadians’ Safety (Victimization). |
||
Chart 9 end
Of these longer-term consequences of their victimization, women were more likely than men to report having had nightmares or unwanted thoughts about it (26% versus 7%). However, there were no other significant differences between women and men for the other longer-term impacts of victimization.Note
Few victims contact or use formal services
Consistent with findings from other recent Canadian victimization surveys (Perreault 2015; Cotter and Savage 2019; Cotter 2021), relatively few (14%) of those who were violently victimized in 2019 reached out to a service for victims of crime. Women (18%) were more likely than men (7%) to have contacted or use a formal service.
The reasons for not accessing services were largely similar to the reasons for not having reported the incident to police. Most commonly, victims said they did not contact or use a service because the incident was too minor (49%) or they did not want or need help (47%). Most of the other specific reasons for not accessing services measured by the GSS were reported by too few victims to produce reliable estimates; the exceptions were not knowing of any services (9%) or feeling too ashamed or embarrassed (8%).
Start of text box 8
Text box 8
Factors associated with likelihood of reporting violent victimization to
police
Many factors contribute to the decision to report an incident to police, but some may have a greater influence than others. To that end, three separate models were constructed in order to examine the factors associated with increased or decreased likelihood of reporting violent victimization to police. The first included factors related to the incident itself (i.e., location, relationship to offender, type of victimization); the second included factors related to the victim (i.e., their age, gender, ethno-cultural identity); the third combined incident and victim characteristics. In order to be consistent with the way information is collected by the General Social Survey on Victimization, these models exclude spousal violence and are based on incidents where there was a single offender.
After controlling for incident characteristics,Note three factors emerged as significantly associated with the likelihood of reporting to police: weapon, injury, and type of victimization. The odds of an incident being reported to police were 3.7 times higher if there was a weapon present during the incident, and 3.2 times higher if the victim was injured as a result. In terms of victimization, sexual assault was about 80% less likely to be reported to police than robbery or physical assault, even after controlling for other factors.
When looking solely at victim characteristics,Note age and gender of the victim were significantly associated with the likelihood of reporting to police. When controlling for several characteristics, the odds of a woman victim reporting an incident to police (0.33) were about two-thirds lower than that of men. The likelihood of reporting a violent incident to police increased with age, with the odds of reporting increasing 3% with each additional year of age. Notably, victims’ levels of confidence in police, as well as many factors linked to confidence in police, such as being an Indigenous person or a visible minority, did not appear to independently influence the likelihood of reporting an incident of violent victimization to the police in 2019.
The third model, combining significant incident and victim characteristics from the previous models, resulted in similar findings. In all, five characteristics remained significantly associated with the likelihood of reporting an incident of violent victimization to police. When an incident involved the presence of a weapon, the odds of it being reported to police were 5 times higher, and when the incident resulted in an injury to the victim, the odds of being reported were 4 times higher. Gender and type of victimization also remained significantly associated with reporting, with the odds of reporting 63% lower among women and also 63% lower among victims of sexual assault. Finally, age remained a significant predictor; while younger people are more likely to be victimized, older victims are more likely to report to police. The odds of reporting increasing 3% with each additional year of age, after controlling for victim and incident characteristics of interest.
End of text box 8
Perceptions of crime, safety, and their neighbourhoods
In addition to measuring experiences of victimization, the 2019 General Social Survey (GSS) on Victimization also collects important information about perceptions of a variety of factors related to crime. Some analysis of Canadians’ perceptions of police performance, confidence in police, and perceptions of the criminal justice system has already been published (Ibrahim 2020; see also Text box 7).
Three-quarters of Canadians are satisfied with their personal safety from crime
In 2019, more than three-quarters (78%) of Canadians were satisfied with their personal safety from crime, a small proportion (4%) were dissatisfied, and the remainder (18%) were neither satisfied nor dissatisfied or had no opinion. Those who were satisfied were less likely to have been a victim of violent or household crime in the past 12 months than those who were dissatisfied with their safety (Table 8).
Women more likely than men to feel unsafe in their neighbourhoods
Other factors beyond victimization influenced perceptions of safety. For example, women (74%) were less likely than men (82%) to be satisfied with their personal safety from crime. That said, equal proportions of women (4%) and men (4%) were dissatisfied, with a larger proportion of women being neither satisfied nor dissatisfied or having no opinion (21% versus 15% of men).
Notably, the gender difference is even more apparent when looking at perceptions of safety in specific situations rather than in a general, abstract sense. Nearly one in five (17%) women felt unsafe when walking alone in their neighbourhood after dark, more than double the proportion of men (8%). Not only that, women were far less likely to feel very safe when doing so (30% versus 50%). Of note, these proportions are based on those who engaged in this activity; more women (14%) than men (3%) said they do not walk alone after dark in their neighbourhood, a choice that may be due to concerns about safety.
Similar proportions of First Nations people, Metis, and Inuit (Indigenous) (76%) and non-Indigenous people (78%) were satisfied with their personal safety in 2019; Indigenous women (69%) were less likely than Indigenous men (82%) to be satisfied with their personal safety. In particular, 62%E of Inuit women were satisfied with their personal safety from crime. About seven in ten First Nations (68%) and Métis (71%) women were satisfied their safety, proportions that were not statistically different from First Nations and Métis men.
Though it represented a small proportion, Indigenous people were more likely than non-Indigenous people to be dissatisfied with their safety from crime (7% versus 4%).
Just under three-quarters (72%) of visible minority Canadians were satisfied with their personal safety from crime in 2019, lower than the proportion among non-visible minorities (80%). Notably, this aligns with results from a crowdsourcing initiative conducted in 2020, which found that visible minority participants were more likely to feel unsafe walking alone in their neighbourhood after dark during the first few months of the COVID-19 pandemic (Heidinger and Cotter 2020). In other words, the results found during the COVID-19 pandemic may be more of a reflection of the general sense of safety among visible minority groups rather than a consequence of the pandemic itself.
One in five Canadians took measures to protect themselves from crime in the past 12 months
In 2019, just over one in five (21%) Canadians indicated that they had taken a measure specifically to protect themselves from being a victim of crime in the past 12 months. The most common measures taken included the installation of burglar alarms, motion detector lights, or a video surveillance system, changing routines or avoiding certain people or places, or installing new locks. Women (23%) were slightly more likely than men (19%) to have taken a protective measure.
Those who were victims of a crime in 2019 were twice as likely to have done something to protect themselves from crime compared to those who were not victimized (36% versus 17%).
Most Canadians feel that crime levels in their neighbourhood are stable
At the national level, police-reported data indicate that crime rose during the five-year period leading up to the 2019 GSS. The Crime Severity Index, which measures both the volume and severity of crime, increased from 66.9 in 2014 to 79.5 in 2019 (Moreau et al. 2020). However, according to the 2019 GSS, most Canadians felt that, during the past 5 years, the level of crime in their neighbourhood had remained about the same (74%). One in five (19%) believed that crime in their neighbourhood has increased, while a smaller proportion (6%) felt that it had decreased.
On the whole, the large majority of Canadians believe that, compared to other Canadian neighbourhoods, their neighbourhood has a similar (23%) or lower (71%) amount of crime. Just 4% felt that they lived in an area with more crime than other areas in Canada, though as may be expected, these individuals were more likely to have been a victim of a violent or household crime in the past 12 months.
Those who felt their neighbourhood had more crime than elsewhere in Canada reported violent victimization and household victimization at rates more than twice as high as though who felt crime was similar, and four to five times higher than those who felt their neighbourhood had less crime relative to other areas in Canada (Table 8).
Summary
In 2019, according to data from the General Social Survey (GSS), most (78%) Canadians were satisfied with their personal safety from crime. Women, and those who were victims of crime, were less likely to be satisfied.
Canadians reported more than 8 million criminal incidents to the 2019 GSS, with the most common being theft of personal property. Among violent crimes measured by the survey, physical assault was most common, followed by sexual assault and robbery. About one in five (19%) Canadians or their households were victimized in 2019.
Based on the data reported to the GSS, there are certain characteristics that place an individual or a household at greater risk of victimization. In 2019, the key factors associated with higher odds of violent victimization were: being younger; being a woman; being a sexual minority; living in a neighbourhood where social disorder is perceived; having been homeless; having been abused, witnessed violence, or experienced harsh parenting or neglect during childhood, and; participating in a higher number of evening activities outside the home.
Though other groups, such as First Nations people, Métis, or Inuit (Indigenous) or people with disabilities also had relatively high victimization rates, these factors did not increase the odds of victimization on their own.
About three in ten (29%) incidents reported to the GSS subsequently came to the attention of police. In particular, only 6% of sexual assaults were reported to police, making it the most underreported crime among those measured in the survey.
When taking into account incident and individual characteristics, the presence of a weapon during the incident and whether it resulted in physical injury were the two most likely predictors of an incident being reported to police. Age, gender, and type of crime also remained significantly associated with reporting to police.
This report examined criminal victimization in Canada in 2019, providing an overall picture of experiences and impacts of violent and household victimization, as well as the main correlates of victimization, levels of reporting to police, and factors associated with the decision to report. Future analysis of the 2019 GSS data can focus more specifically on the experiences of certain populations or types of victimization.
Detailed data tables
Table 1 Victimization incidents reported by Canadians, by type of offence, 2019
Table 2 Victimization incidents reported by Canadians, by province and territory, 2019
Table 7 Characteristics of violent incidents, by reporting to police, Canada, 2019
Model 1 Logistic regression: odds of experiencing violent victimization, 2019
Survey description
This article uses data from the General Social Survey (GSS) on Canadians’ Safety (Victimization). In 2019, Statistics Canada conducted the GSS on Victimization for the seventh time. Previous cycles were conducted in 1988, 1993, 1999, 2004, 2009 and 2014. The main objective of the GSS on Victimization is to better understand issues related to the safety and security of Canadians, including perceptions of crime and the justice system, experiences of intimate partner violence, and how safe people feel in their communities.
The target population was persons aged 15 and older living in the provinces and territories, except for those living full-time in institutions.
Data collection took place between April 2019 and March 2020. Responses were obtained by computer-assisted telephone interviews (CATI), in-person interviews (in the territories only) and, for the first time, the GSS on Victimization offered a self-administered internet collection option to survey respondents in the provinces and in the territorial capitals. Respondents were able to respond in the official language of their choice.
An individual aged 15 or older was randomly selected within each household to respond to the survey. An oversample of Indigenous people was added to the 2019 GSS on Victimization to allow for a more detailed analysis of individuals belonging to this population group. In 2019, the final sample size was 22,412 respondents.
In 2019, the overall response rate was 37.6%. Non-respondents included people who refused to participate, could not be reached, or could not speak English or French. Respondents in the sample were weighted so that their responses represent the non-institutionalized Canadian population aged 15 and older.
Data limitations
As with any household survey, there are some data limitations. The results are based on a sample and are therefore subject to sampling errors. Somewhat different results might have been obtained if the entire population had been surveyed.
For the quality of estimates, the lower and upper bounds of the confidence intervals are presented in the tables and charts. Confidence intervals should be interpreted as follows: If the survey were repeated many times, then 95% of the time (or 19 times out of 20), the confidence interval would cover the true population value.
Throughout this article, unless otherwise specified, statistically significant differences were determined using 95% confidence intervals.
In addition to the confidence intervals, estimates are categorized into quality categories based on unweighted sample size. At the national level for the GSS, estimates were releasable if their minimum unweighted sample was 10 in the numerator and 100 in the denominator; estimates falling below these thresholds are marked with the letter F. Further, estimates marked with the letter E have been deemed to be of marginal quality and should be used with caution. For the GSS at the national level, this includes estimates based on an unweighted sample falling between 100 and 199 (inclusive) in the denominator.
Statistics Canada has confidence in the quality of the data disseminated from the 2019 GSS and assures that the data are fit for use for this analysis. It is important to point out that any significant change in survey methodology can affect the comparability of the data over time. It is impossible to determine with certainty whether, and to what extent, differences in a variable are attributable to an actual change in the population or to changes in the survey methodology. However, there are reasons to believe that the use of an electronic questionnaire might have an impact on the estimations. At every stage of processing, verification and dissemination, considerable effort was made to produce data that are as precise in their level of detail, and to ensure that the published estimates are of good quality in keeping with Statistics Canada standards. However, because of these changes, direct comparison of results from the 2019 GSS to previous iterations are not appropriate.
It should be noted that even when the proportion of respondents who completed the survey online is similar, it is possible that the mode effect is different across different populations.
References
Andersson, N. and A. Nahwegahbow. 2010. “Family violence and the need for prevention research in First Nations, Inuit, and Métis Communities.” Pimatisiwin. Vol. 8, no. 2. p. 9-33.
Brunton-Smith, I. 2011. “Untangling the relationship between fear of crime and perceptions of disorder: Evidence from a longitudinal study of young people in England and Wales.” British Journal of Criminology. Vol. 51. p. 885-899.
Burczycka, M. 2017. "Profile of Canadian adults who experienced childhood maltreatment." Family violence in Canada: A statistical profile, 2015. Juristat. Statistics Canada Catalogue no. 85-002-X.
Conroy, S. 2021. “Family violence in Canada: A statistical profile, 2019.” Juristat. Statistics Canada Catalogue no. 85-002-X.
Conroy, S. and Cotter, A. 2017. “Self-reported sexual assault in Canada, 2014.” Juristat. Statistics Canada Catalogue no. 85-002-X.
Cotter, A. 2016. “Canadians’ perceptions of neighbourhood disorder, 2014.” Spotlight on Canadians: Results from the General Social Survey. Statistics Canada Catalogue no. 89-652-X.
Cotter, A. 2021. “Intimate partner violence in Canada, 2018: An overview.” Juristat. Statistics Canada Catalogue no. 85-002-X.
Cotter, A. and Savage, L. 2019. “Gender-based violence and inappropriate sexual behaviour in Canada, 2018: Initial findings from the Survey of Safety in Public and Private Spaces.” Juristat. Statistics Canada Catalogue no. 85-002-X.
Gau, J.M. and Pratt, T.C. 2008. “Broken windows or window dressing? Citizens’ (in)ability to tell the difference between disorder and crime.” Criminology and Public Policy. Vol. 7, no. 2. p. 163-194.
Gore, J. 2013. “Redressing First Nations historical trauma: Theorizing mechanisms for Indigenous culture as mental health treatment.” Transcultural Psychiatry. Vol. 50, no. 5. p. 683-706.
Heidinger, L. and Cotter, A. 2020. “Perceptions of personal safety among population groups designated as visible minorities in Canada during the COVID-19 pandemic.” StatCan COVID-19: Data to Insights for a Better Canada. Statistics Canada Catalogue no. 45280001.
Ibrahim, D. 2020. “Public perceptions of the police in Canada’s provinces, 2019.” Juristat. Statistics Canada Catalogue no. 85-002-X.
Jaffray, B. 2020. “Experiences of violent victimization and unwanted sexual behaviours among gay, lesbian, bisexual and other sexual minority people, and the transgender population, in Canada, 2018.” Juristat. Statistics Canada Catalogue no. 85-002-X.
Johnson, H. 2017. “Why doesn’t she just report it? Apprehensions and contradictions for women who report sexual violence to the police.” Canadian Journal of Women and the Law. Vol. 29, no. 1. p. 36-59.
Johnson, H. 2012. “Limits of a criminal justice response: Trends in police and court processing of sexual assault.” In E. A. Sheehy (Ed.), Sexual Assault in Canada: Law, Legal Practice and Women’s Activism. p. 613-634. Ottawa, Ontario. University of Ottawa Press.
Missing and Murdered Indigenous Women and Girls. 2019. Reclaiming Power and Place: The Final Report of the National Inquiry into Missing and Murdered Indigenous Women and Girls.
Moreau, G., Jaffray, B. and Armstrong, A. 2020. “Police-reported crime statistics in Canada, 2019.” Juristat. Statistics Canada Catalogue no. 85-002-X.
Perreault, S. 2015. "Criminal victimization in Canada, 2014." Juristat. Statistics Canada Catalogue no. 85-002-X.
Rotenberg, C. and A. Cotter. 2018. “Police-reported sexual assaults in Canada before and after #MeToo, 2016 and 2017.” Juristat. Statistics Canada Catalogue no. 85-002-X.
Sable, M. R., Danis, F., Mauzy, D. L. and S. K. Gallagher. 2006. “Barriers to reporting sexual assault for women and men: Perspectives of college students.” Journal of American College Health. Vol. 55, no. 3. p. 157-162.
Sidique, J.A. 2016. “Age, marital status, and risk of sexual victimization: Similarities and differences across victim–offender relationships.” Journal of Interpersonal Violence. Vol. 31, no. 15. p. 2556-2575.
Simpson, L. 2018. “Violent victimization and discrimination among visible minority populations, Canada, 2014.” Juristat. Statistics Canada Catalogue no. 85-002-X.
Statistics Canada. 2020. “Canadians’ perceptions of personal safety since COVID-19.” The Daily, June 9.
Strom, I.F., Hjemdal, O.K., Myhre, M.C., Wentzel-Larsen, T. and Thoresen, S. 2020. “The social context of violence: A study of repeated victimization in adolescents and young adults.” Journal of Interpersonal Violence. Vol. 35, no. 11-12. p. 2210-2235.
Taylor, S.C. and Gassner, L. 2010. “Stemming the flow: Challenges for policing adult sexual assault with regard to attrition rates and under-reporting of sexual offences.” Police Practice and Research. Vol. 11, no. 3. p. 240-255.
Todorova, I.L., Falcón, L.M., Lincoln, A.K. and Price, L.L. 2010. "Perceived discrimination, psychological distress and health." Sociology of Health and Illness. Vol. 32, no. 6. p. 843-861.
Venema, R. M. 2014. “Police officer schema of sexual assault reports: Real rape, ambiguous cases, and false reports.” Journal of Interpersonal Violence. Vol. 35, no. 5. p. 1-28.
Widom, C. S., Czaja, S. J. and M. A. Dutton. 2008. “Childhood victimization and lifetime revictimization.” Child Abuse and Neglect. Vol. 32. p. 785-796.
- Date modified: