
Profile of Canadian graduates at the bachelor level belonging to a group designated as a visible minority, 2014 to 2017 cohorts
Skip to text
Text begins
Highlights
- Approximately 30% of graduates who earned a bachelor’s degree from a Canadian institution from 2014 to 2017 were members of a group designated as a visible minority. Chinese, South Asians and Blacks made up almost two-thirds of visible minority graduates.
- More than half (54%) of visible minority Canadian graduates were first-generation immigrants (born abroad); 43% were second-generation (born in Canada and with at least one parent born abroad) and less than 3% were third-generation (born in Canada with parents also born in Canada). In comparison, 77.1% of non-visible minority graduates were third generation.
- Among non-visible minority graduates, 6 in 10 were women. This proportion was almost 50% for most Asian groups, but close to 64% among Blacks.
- Graduates from most Asian groups were, on average, under 25 years of age when they graduated, compared with 26.2 years for those who did not belong to a visible minority group and 29.1 years for Black graduates.
- Just over 30% of Black graduates reported having one or more dependent children two years after earning their bachelor’s degree, compared with 15.7% of non-visible minority graduates and less than 10% of graduates in most Asian groups.
- Among men, the fields of science (science, technology, engineering, and mathematics [STEM]) and business, management and public administration were among the most common with many visible minority groups. These fields attracted close to three-quarters of South Asian male graduates and more than two-thirds of Chinese male graduates, compared with 56% of non-visible minority male graduates.
- Among women, business was the most popular field of study for several visible minority groups, followed by social and behavioural sciences and law, and health. Science is generally more popular among female visible minority graduates than among non-visible minority graduates, especially Chinese and South Asians, but also Arabs and Koreans.
- Graduates from most visible minority groups were largely overrepresented in Ontario and, to a lesser extent, in British Columbia. In contrast, they were less likely to live in the Prairies and in Quebec.
Introduction
According to the 2016 Census, people who identify with a group designated as a visible minority made up more than one-fifth of the Canadian population. If current trends continue, this proportion could reach between 31% and 36% in 2036 (Statistics Canada, 2017).Note Members of a group designated as a visible minority are part of the groups designated by the Employment Equity Act, which aims to rectify certain disadvantages that could affect these groups.Note While sometimes still considered as a whole, this group is far from homogeneous. In addition, significant differences are observed in the demographic and socioeconomic characteristics of graduates from each of the visible minority subgroups (Qiu and Schellenberg 2022).
Using a database that integrates anonymized data from the Postsecondary Student Information System (PSIS) with 2016 Census and tax data (see the Data sources and definitions box), this article compares, for the first time, the demographic characteristics of graduates at the bachelor level from each of the 10 population groups designated as visible minorities with graduates not belonging to these groups.Note
PSIS data on graduates for 2014 to 2017 were combined to examine each of the 10 visible minority groups separately.Note The graduates being studied here were Canadian citizens or landed immigrants at the start of their program and they earned their bachelor’s degree from a Canadian institution. Their demographic characteristics were mostly observed two years after graduation.Note A second article will follow that compares some labour market indicators between these groups.
Chinese and South Asians were overrepresented among bachelor’s degree graduates
From 2014 to 2017, just over 410,000 people graduated from a Canadian institution with a bachelor’s degree, or nearly 103,000 each year (Table 1). The three largest visible minority groups among graduates were the same as in the total Canadian population: Chinese, South AsiansNote and Blacks.
The first two groups, Chinese and South Asians, were overrepresented among graduates, accounting respectively for 8.4% and 7.5% of graduates, compared with 5.2% and 7.1% of the Canadian population aged 25 to 34. Conversely, Blacks were underrepresented, making up 3.6% of graduates versus 4.0% of the population aged 25 to 34. Moreover, in addition to making up the largest communities in Canada, on average, Chinese and South Asians were more likely to earn a university degree than their non-visible minority counterparts (Turcotte 2019).
| 2014 to 2017 cohorts |
Canadian population aged 25 to 34 (RC) | |
|---|---|---|
| number | ||
| Total | 410,010 | 4,576,575 |
| proportion (%) | ||
| South AsianTable 1 Note 1 | 7.5Note * | 7.1 |
| Chinese | 8.4Note * | 5.2 |
| Black | 3.6Note * | 4.0 |
| Filipino | 1.9Note * | 2.5 |
| Latin American | 1.1Note * | 1.8 |
| Arab | 1.8 | 1.9 |
| Southeast AsianTable 1 Note 2 | 1.1 | 1.1 |
| West AsianTable 1 Note 3 | 1.0Note * | 1.1 |
| Korean | 1.1Note * | 0.7 |
| Japanese | 0.3 | 0.3 |
| Other | 0.4 | 0.5 |
| Multiple | 1.0Note * | 0.7 |
| Not a visible minority | 70.8Note * | 73.2 |
Sources: Integrated PSIS–T1FF–2016 Census file and 2016 Census. |
||
Graduates from the other seven visible minority groups each made up between 0.3% and 1.9% of all graduates. Some of these groups, such as Filipinos and Latin Americans, were underrepresented among graduates, while Koreans were overrepresented. The proportion of the other four groups among graduates was similar to their proportion of the population aged 25 to 34.
Finally, the majority (70.8%) of graduates from the 2014 to 2017 cohorts did not belong to any visible minority group. This proportion was lower than that of the Canadian population aged 25 to 34 (73.2%), reflecting the lower probability of this group graduating from university (Picot and Hou 2011; Boyd 2008). According to the 2016 Census, 44.4% of Canadians aged 25 to 54 who were members of a visible minority group had a certificate, diploma or university degree at the bachelor level or higher, versus 27.0% of non-members.Note
A larger proportion of visible minority graduates are first-generation immigrants
Since many visible minorities are from immigrant backgrounds, we often distinguish first-generation (those born abroad and most of whom have immigrant status) from second-generation (those born in Canada but with at least one parent born abroad). Many studies have shown that immigrants and children of immigrants often tend to imitate the behaviour of their parents and their community with respect to their propensity to live as a couple and have children (Employment and Social Development Canada 2019.). They are also more likely to continue their studies at a university level, while those of the third generation and later (those born in Canada whose parents were also born in Canada) more broadly adopt the behaviour of the majority in the host country (Statistics Canada 2021; Picot and Hou 2011; Boyd 2008; Aydemir and Sweetman 2006.).
Contrary to what is often observed among immigrants, those examined in this article all did their bachelor’s degree at a Canadian institution. This particularity is often seen as an asset for graduates’ success in the labour market.Note
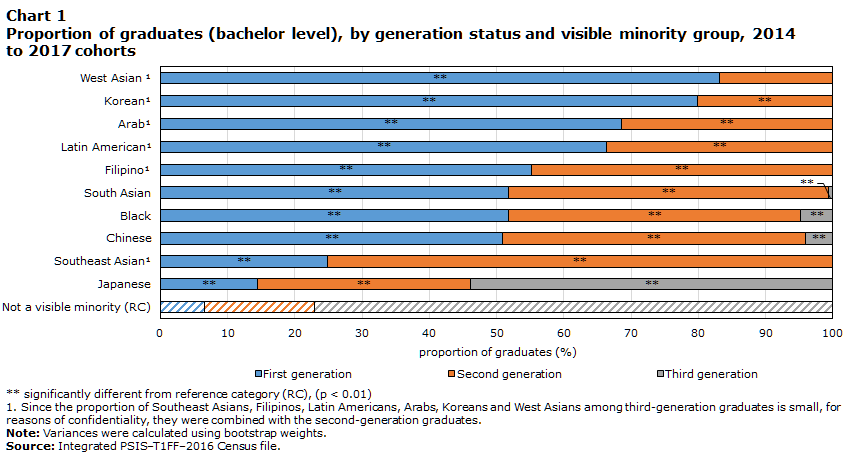
Among those who earned a bachelor’s degree between 2014 and 2017, 54% of those who belonged to a visible minority group were also first-generation immigrants, while 43% were second-generation immigrants. These proportions were similar to those observed for the three main visible minority groups: Chinese, South Asians and Blacks (Chart 1). A very small proportion (less than 3%) of all visible minority graduates were third generation. The only group where most of their graduates were third generation was Japanese (53.8%). In comparison, more than three-quarters of non-visible minority graduates were third generation.
Data table for Chart 1
| First generation | Second generation | Third generation | |
|---|---|---|---|
| proportion of graduates (%) | |||
| West Asian Data table for Chart 1 Note 1 | 83.1Note ** | 16.9 | Note ...: not applicable |
| KoreanData table for Chart 1 Note 1 | 79.9Note ** | 20.1Note ** | Note ...: not applicable |
| ArabData table for Chart 1 Note 1 | 68.6Note ** | 31.4Note ** | Note ...: not applicable |
| Latin AmericanData table for Chart 1 Note 1 | 66.4Note ** | 33.6Note ** | Note ...: not applicable |
| FilipinoData table for Chart 1 Note 1 | 55.2Note ** | 44.8Note ** | Note ...: not applicable |
| South Asian | 51.8Note ** | 47.5Note ** | 0.6Note ** |
| Black | 51.7Note ** | 43.5Note ** | 4.8Note ** |
| Chinese | 50.9Note ** | 44.9Note ** | 4.2Note ** |
| Southeast AsianData table for Chart 1 Note 1 | 24.9Note ** | 75.1Note ** | Note ...: not applicable |
| Japanese | 14.5Note ** | 31.6Note ** | 53.9Note ** |
| Not a visible minority (RC) | 6.6 | 16.3 | 77.1 |
... not applicable
Source: Integrated PSIS–T1FF–2016 Census file. |
|||
Graduates from several visible minority groups have a near-parity gender distribution
For several decades now, women have constituted the majority of graduates (bachelor level) at Canadian institutions. They represented 61.1% of non-visible minority graduates who earned their bachelor’s degree between 2014 and 2017 (Chart 2).
In contrast, the proportion of men and women with a bachelor’s degree was similar in many visible minority groups. This is the case for South Asian graduates, with the proportion of women being 50.8%. Arab, Korean and Chinese graduates also had a similar distribution by sex, with women representing between 52.3% and 53.4% of graduates. In contrast, among Blacks, the proportion of women is the highest (63.6%) and could reflect the lower propensity of Black men to earn a postsecondary degree.Note

Data table for Chart 2
| Proportion of women (%) | |
|---|---|
| Black | 63.6Note ** |
| Latin American | 63.0 |
| Not a visible minority (RC) | 61.1 |
| Filipino | 60.2 |
| Japanese | 57.7 |
| Southeast Asian | 56.3Note ** |
| West Asian | 55.8Note ** |
| Chinese | 53.4Note ** |
| Arab | 52.3Note ** |
| Korean | 52.3Note ** |
| South Asian | 50.8Note ** |
Source: Integrated PSIS–T1FF–2016 Census file. |
|
Graduates in most Asian groups graduated earlier in life
Graduating more or less early in life can affect many events marking the transition to adulthood, such as living in a couple, starting a family and buying a house. This may even have an impact on the age at which individuals will be able to retire. The distribution of graduates by ageNote and their average age at graduationNote are factors that could determine the age at which this transition to adulthood will occur.
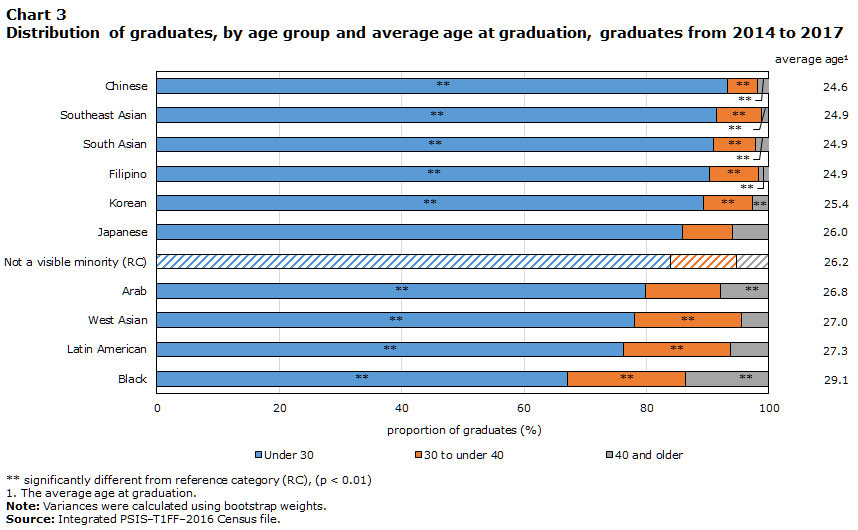
Among all those who graduated between 2014 and 2017, certain Asian groups (Chinese, Southeast Asians, South Asians and Filipinos) had the highest proportion of graduates under 30 years of age at graduation (more than 90%, Chart 3). This proportion was 84.0% for non-visible minority graduates and 67.1% for Blacks.
These same Asian groups are, on average, also the youngest when they earn their undergraduate degree (between 24.6 and 24.9 years old). Non-visible minority graduates earned their bachelor’s degree, on average, at the age of 26.2. At 29.1 years of age, Black graduates earned their bachelor’s degree the latest in life on average, with a difference of almost three years compared with non-visible minority graduates.
Data table for Chart 3
| Under 30 | 30 to under 40 | 40 and older | average ageData table for Chart 3 Note 1 | |
|---|---|---|---|---|
| proportion of graduates (%) | ||||
| Chinese | 93.3Note ** | 4.8Note ** | 2.0Note ** | 24.6 |
| Southeast Asian | 91.4Note ** | 7.4Note ** | 1.2Note ** | 24.9 |
| South Asian | 90.9Note ** | 7.0Note ** | 2.2Note ** | 24.9 |
| Filipino | 90.4Note ** | 7.9Note ** | 1.8Note ** | 24.9 |
| Korean | 89.3Note ** | 8.0Note ** | 2.6Note ** | 25.4 |
| Japanese | 85.9 | 8.1 | 6.0 | 26.0 |
| Not a visible minority (RC) | 84.0 | 10.7 | 5.3 | 26.2 |
| Arab | 79.9Note ** | 12.2 | 7.9Note ** | 26.8 |
| West Asian | 78.0Note ** | 17.6Note ** | 4.4 | 27.0 |
| Latin American | 76.2Note ** | 17.6Note ** | 6.2 | 27.3 |
| Black | 67.1Note ** | 19.3Note ** | 13.6Note ** | 29.1 |
Source: Integrated PSIS–T1FF–2016 Census file. |
||||
The higher proportion of individuals aged 30 years and older among non-visible minority groups and certain visible minority groups, such as Blacks, may in part be due to a greater propensity of these groups to earn multiple postsecondary diplomas. According to the 2015 National Graduates Survey (NGS), a higher proportion of non-visible minority (40%), Black (43%) and Arab (42%) graduates earned postsecondary diplomas before their bachelor’s degree, compared with South Asians (22%) or Chinese (21%). However, the average time to graduate was similar between the various visible minority groups according to the PSIS.Note Some of these graduates could also have changed programs more frequently along the way, pushing back the age at which they would have graduated.
The largest proportion of graduates aged 30 and older, and 40 and older in some groups, can also be explained by the fact that some graduates may have returned to school in the context of a career change or after a break from work or school for family or other reasons.Note Some graduates may also have earned an educational qualification abroad before arriving in Canada, which would account their older age upon graduation.
Given their younger age at graduation, several Asian groups had maintained a fiscal relationship with their parents
The fiscal relationship of graduates with their parent(s) is derived from the T1 Family File (T1FF),Note more specifically, from their family situation variable. The T1FF reproduces the family situation of tax filers from information contained in their tax return (Fecteau 2021) and from the Canada child benefit. Graduates considered to be “dependent children” are in this category because they reported the same mailing address as their parents, which would tend to show that they actually lived with their parents.Note However, some of them may have reported the same address as their parents for fiscal reasons when, in fact, they lived alone at another address or shared accommodations. This fiscal relationship may therefore reflect the fact that the graduates actually lived with their parents or that some of them may have received some form of financial aid from their parents. As graduates get older, they are more likely to lose this fiscal relationship with their parent(s).
This is reflected in the fact that the proportion of graduates considered “dependent children of their parents,” is higher among visible minority groups who are relatively young when they graduate. This is the case for several Asian groups (South Asians, Chinese, Filipinos, Koreans), with this proportion varying between 56.2% and 62.5% (Chart 4). In contrast, among Blacks, who on average earned their bachelor’s degree later in life, the fiscal relationship is weaker, with 26.8% being considered “dependent children.” By comparison, this was the case of 34.1% of non-visible minority graduates.
Also, the relationship between being a dependent child in the fiscal sense and visible minority group was measured for 2014 to 2017 graduates using a regression model (for more details on this model see Data sources and definitions). This relationship remained significant even after taking into account differences in demographic characteristics among graduates.Note The family situation of graduates would therefore be linked not only to age at graduation, it could also stem from other factors.

Data table for Chart 4
| Dependent child (for income tax purposes) | Couple | Not in family | Head of lone-parent family | |
|---|---|---|---|---|
| proportion of graduates (%) | ||||
| Filipino | 62.5Note ** | 21.8Note ** | 14.7Note ** | 0.9Note ** |
| South Asian | 57.4Note ** | 27.1Note ** | 15.0Note ** | 0.5Note ** |
| KoreanData table for Chart 4 Note 1 | 56.4Note ** | 22.0Note ** | 21.5 | Note ...: not applicable |
| Chinese | 56.2Note ** | 22.0Note ** | 21.4 | 0.5Note ** |
| Southeast AsianData table for Chart 4 Note 1 | 50.3Note ** | 25.9Note ** | 23.8 | Note ...: not applicable |
| JapaneseData table for Chart 4 Note 1 | 42.9Note ** | 31.6Note ** | 25.5 | Note ...: not applicable |
| West Asian | 41.1Note ** | 33.3Note ** | 24.3 | 1.3Note * |
| Arab | 38.9Note ** | 34.8Note ** | 25.1Note ** | 1.2Note ** |
| Latin American | 34.6 | 40.4 | 21.5 | 3.5Note * |
| Not a visible minority (RC) | 34.1 | 41.6 | 22.2 | 2.1 |
| Black | 26.8Note ** | 38.5Note ** | 27.3Note ** | 7.3Note ** |
... not applicable
Source: Integrated PSIS–T1FF–2016 Census file. |
||||
Non-visible minority graduates, Blacks and Latin Americans were the most likely to live as a couple in the fiscal sense, ranging from 38.5% to 41.6% for these groups. Also, Blacks had the highest proportion of persons not in families (27.3% versus 22.2% of non-visible minority graduates) and persons heading lone-parent familiesNote (7.3% versus 2.1% for non-visible minority graduates).
Black graduates were the most likely to have dependent children
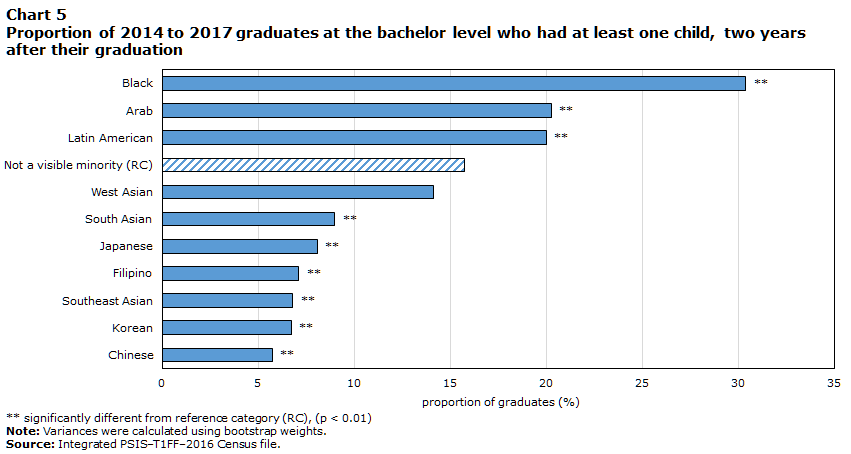
In Canada, the average age of mothers at the birth of their first child has continued to increase since the 1960s (Provencher et al. 2018) and was, on average, 29.2 years in 2016. This, in part, explains that a little less than 15% of graduates from 2014 to 2017, all groups combined, reported one or more dependent children two years after receiving their bachelor’s degree.Note Blacks had the highest proportion in this regard (30.4%) compared with 15.7% of non-visible minority graduates and less than 10% for most Asian groups (Chart 5).
Data table for Chart 5
| Had one or more children | |
|---|---|
| proportion of graduates (%) | |
| Black | 30.4Note ** |
| Arab | 20.2Note ** |
| Latin American | 20.0Note ** |
| Not a visible minority (RC) | 15.7 |
| West Asian | 14.1 |
| South Asian | 9.0Note ** |
| Japanese | 8.1Note ** |
| Filipino | 7.1Note ** |
| Southeast Asian | 6.8Note ** |
| Korean | 6.7Note ** |
| Chinese | 5.7Note ** |
Source: Integrated PSIS–T1FF–2016 Census file. |
|
Age remained a major factor in the probability of having a dependent child. However, differences remained among visible minority groups after controlling for age and a number of other demographic characteristics. The probability of having a child among Blacks remained significantly higher than among graduates not belonging to a visible minority group, their probability being 4.9 p.p. higher. Most Asian groups had a lower probability in this regard (between -4.2 p.p. and -6.1 p.p., see the results in Data sources and definitions).
Science and business fields were among the favourite fields of several visible minority groups
Certain members of visible minorities have less favourable labour market outcomes for various reasons (Houle, 2020; Turcotte, 2019; Pico and Hou, 2011; Boyd, 2008). The obtention of a university degree, as well as the chosen field of study, are likely to influence their labour market outcomes (Statistics Canada, 2018).
Nearly 55.7% of male non-visible minority graduates graduated in the scientific fields (also called the science, technology, engineering and mathematics, or STEM, fields) and in the fields of business, management and administration. This proportion was 74.4% among Arabs, 72.5% among South Asians and 68.2% among Chinese (Table 2). Arabs had the highest proportion in the STEM field (45.6%). Among Blacks, after businessNote (30.5%), the second largest field was social and behavioural sciences and law (22.5%).
In contrast, the health field had only 6.1% of non-visible minority men versus more than 18.3% of Filipinos and approximately 10% of Southeast Asians and Blacks. While the education field attracted only 8.4% of male non-visible minority graduates, this proportion was even lower for members of visible minorities, ranging between 1.7% to 3.3% from most groups. Only Blacks had a slightly higher proportion at 5.5%.
While women have long been concentrated in the health and education fields (Uppal and LaRochelle-Côté 2014), graduates who earned a bachelor’s degree between 2014 and 2017 are distributed over a greater number of fields. Among female non-visible minority graduates 38.6% had earned their bachelor’s degree in the fields of health and education, and 39.5% of them had graduated in the fields of business and social and behavioural sciences and law.
While the fields of health and business attracted many female visible minority group graduates, few of them chose the field of education (Table 2). The field of business was among the favourites of several female visible minority groups, including Chinese, South Asians and Southeast Asians graduates, while social and behavioural sciences and law were also among the most popular for several groups. Health was the first choice for Filipino and Japanese female graduates and the second choice for Black females. This sector also included a large number of Southeast Asians (20.0%), South Asians (17.9%) and Koreans (17.6%) females.
| Education | Social and behavioural science and law | Business, management and public adm. | STEM | Health | Other | |
|---|---|---|---|---|---|---|
| Men | ||||||
| South Asian | 1.7Note ** | 14.2 | 38.6Note ** | 33.9Note ** | 5.2Note * | 6.5Note ** |
| Chinese | 2.1Note ** | 14.4 | 30.9Note ** | 37.3Note ** | 5.7 | 9.6Note ** |
| Black | 5.5Note ** | 22.5Note ** | 30.5Note * | 21.5Note ** | 9.5Note ** | 10.6Note ** |
| Filipino | 2.6Note ** | 13.5 | 22.6Note ** | 31.2 | 18.3Note ** | 11.7Note * |
| Latin American | 2.6Note ** | 20.1Note * | 29.5 | 29.8 | 5.3 | 12.6 |
| Arab | 3.3Note ** | 13.2 | 28.8 | 45.6Note ** | 4.8 | 4.3Note ** |
| Southeast Asian | 2.8Note ** | 11.6Note * | 33.0Note * | 34.1Note ** | 10.0Note ** | 8.3Note ** |
| West Asian | Note x: suppressed to meet the confidentiality requirements of the Statistics Act | 20.1Note * | 30.9 | 39.7Note ** | 3.5Note ** | Note x: suppressed to meet the confidentiality requirements of the Statistics Act |
| Korean | 3.1Note ** | 19.4Note * | 25.8 | 36.1Note ** | 4.7 | 11.0Note * |
| Japanese | Note x: suppressed to meet the confidentiality requirements of the Statistics Act | 19.2 | 28.0 | 21.2 | Note x: suppressed to meet the confidentiality requirements of the Statistics Act | 19.3 |
| Not a visible minority (RC) | 8.4 | 15.3 | 27.2 | 28.4 | 6.1 | 14.5 |
| Women | ||||||
| South Asian | 7.4Note ** | 22.9Note ** | 29.1Note ** | 13.9Note ** | 17.9Note ** | 8.7Note ** |
| Chinese | 5.4Note ** | 20.1 | 31.3Note ** | 16.1Note ** | 13.3Note ** | 13.8 |
| Black | 8.6Note ** | 29.1Note ** | 21.1 | 6.8 | 24.2Note ** | 10.3Note ** |
| Filipino | 5.9Note ** | 18.3 | 18.5 | 10.9Note ** | 33.2Note ** | 13.1 |
| Latin American | 8.1Note ** | 26.9Note ** | 25.6Note ** | 8.5 | 16.9Note ** | 14.0 |
| Arab | 13.2Note ** | 22.5Note * | 28.2Note ** | 18.8Note ** | 9.0Note ** | 8.3Note ** |
| Southeast Asian | 6.4Note ** | 19.4 | 32.7Note ** | 11.8Note ** | 20.0 | 9.8Note ** |
| West Asian | 7.7Note ** | 24.5Note ** | 24.8Note * | 14.6Note ** | 15.7Note ** | 12.7 |
| Korean | 7.6Note ** | 22.5 | 16.6Note * | 16.1Note ** | 17.6 | 19.6Note ** |
| Japanese | 8.5Note ** | 21.0 | 18.8 | 11.2 | 24.4 | 16.1 |
| Not a visible minority (RC) | 17.7 | 19.0 | 20.4 | 7.2 | 20.9 | 14.8 |
x suppressed to meet the confidentiality requirements of the Statistics Act
Source: Integrated PSIS–T1FF–2016 Census file. |
||||||
The science fields attracted almost twice as many Chinese and South Asians as non-visible minority female graduates. These fields also attracted relatively large proportions of other, less numerous groups, such as Arabs (18.8%), who had the largest proportion of females in sciences. Black female graduates were the largest group to have chosen social and behavioural sciences and law (29.1%).
Graduates from most visible minority groups were overrepresented in Ontario
Several factors come into play when it comes time to decide to live in one region of the country versus another. Among these, the industrial structure of regions, employment prospects and the language of work are likely among the determining factors, as is the size of the communities already living in each of the provinces, as well as a desire to live in the same region as their loved ones.
Since Ontario is the province that generally attracts the largest proportion of visible minority communities, it is not surprising that it was also the province where the majority of graduates (bachelor level) from visible minority groups lived, two years after graduation (56.4%, Table 3). Visible minority graduates were largely overrepresented in Ontario, compared with the proportion of non-visible minority graduates who lived in this province (37%). This portion varied between 48.8% and 68.8% for graduates from each of the visible minority groups except Japanese (29.6%).
Visible minority graduates were also overrepresented in British Columbia with 19.5% of them living in this province compared with 11.8% of non-visible minority graduates. This province attracted the largest proportion of Japanese graduates (41.4%), and it was the second largest province for several Asian groups such as the Chinese (32.5%), Koreans (28.7%), South Asians (16.7%) and West Asians (19.1%).
In contrast, only 13% and 10% of visible minority graduates lived in the Prairies and Quebec, while 19.6% and 23.9% of non-visible minority graduates chose to live in these provinces. The Prairies attracted close to a quarter of Filipino graduates (24.0%) and between 10.5 and 17.4% of several groups of Asian graduates. Quebec was the province of residence of a relatively large proportion of Blacks (23.8%), Latin Americans (26.2%) and Arabs (33.9%).
The remaining regions of Canada, made up of the Maritime provinces and the northern territories, accounted for 7.7% of non-visible minority graduates but only between 0.6% and 2.8% of each visible minority group.
| Other regionsTable 3 Note 1 | Quebec | Ontario | Prairies | British Columbia | |
|---|---|---|---|---|---|
| South Asian | 0.6Note ** | 3.4Note ** | 68.8Note ** | 10.5Note ** | 16.7Note ** |
| Chinese | 0.9Note ** | 5.5Note ** | 49.6Note ** | 11.6Note ** | 32.5Note ** |
| Black | 2.2Note ** | 23.8 | 57.7Note ** | 13.1Note ** | 3.2Note ** |
| Filipino | Note x: suppressed to meet the confidentiality requirements of the Statistics Act | Note x: suppressed to meet the confidentiality requirements of the Statistics Act | 50.8Note ** | 24.0Note ** | 21.5Note ** |
| Latin American | Note x: suppressed to meet the confidentiality requirements of the Statistics Act | 26.2 | 50.0Note ** | 14.7Note ** | Note x: suppressed to meet the confidentiality requirements of the Statistics Act |
| Arab | 2.8Note ** | 33.9Note ** | 51.3Note ** | 9.0Note ** | 3.0Note ** |
| Southeast Asian | Note x: suppressed to meet the confidentiality requirements of the Statistics Act | Note x: suppressed to meet the confidentiality requirements of the Statistics Act | 48.8Note ** | 17.4 | 15.2Note ** |
| West Asian | 1.4Note ** | 9.3Note ** | 61.0Note ** | 9.2Note ** | 19.1Note ** |
| Korean | 1.5Note ** | 1.5Note ** | 55.0Note ** | 13.3Note ** | 28.7Note ** |
| Japanese | Note x: suppressed to meet the confidentiality requirements of the Statistics Act | Note x: suppressed to meet the confidentiality requirements of the Statistics Act | 29.6Note * | 22.6 | 41.4Note ** |
| Visible minority population | 1.2Note ** | 10.3Note ** | 56.4Note ** | 12.6Note ** | 19.5Note ** |
| Not a visible minority (RC) | 7.7 | 23.9 | 37.0 | 19.6 | 11.8 |
x suppressed to meet the confidentiality requirements of the Statistics Act
Source: Integrated PSIS–T1FF–2016 Census file. |
|||||
Conclusion
Using information on those who earned a bachelor’s degree between 2014 and 2017, along with tax data and the 2016 Census, this article, for the first time, compares the demographic characteristics of graduates at the bachelor level in each of the ten visible minority groups with those of non-visible minority graduates.
Approximately 30% of these graduates were members of a visible minority group. Chinese, South Asians and Blacks made up two-thirds of them.
It is important to understand how the characteristics of visible minority graduates differ from those of non-visible minority graduates in order to inform public policies to better support their integration in the labour market. Expanding on this current analysis, a future study will compare selected labour market indicators, such as the employment rate and the job quality, for these 10 visible minority groups and those who are not members of these groups.
Start of text box 1
Data sources and definitions
Data sources and weighting
The Education and Labour Market Longitudinal Platform (ELMLP) allows for the integration of anonymized data from the Postsecondary Student Information System (PSIS) administrative file with other data sources to enhance the PSIS socioeconomic information, as well as to provide insight on students’ paths and their labour market outcomes after graduation.
The results of this study are based on the PSIS file, integrated with the T1 Family File (T1FF) and 2016 Census data. The rate of integration between the PSIS–T1FF file and the 2016 Census was comparable to the proportion of the Canadian population required to complete the long-form questionnaire, which is 25%, or one in four households. To ensure that the population of interest was not significantly different in the integrated file versus the PSIS-T1FF file, characteristics of the graduates were studied for both files, and in general were very similar (within one percentage point). Although selection bias is always possible, this analysis showed that if there is a bias, it is weak.
This study is based on anonymized information for four cohorts of graduates at the bachelor levelNote (which include bachelor’s degrees earned at some colleges, but exclude graduates of medicine, veterinary medicine, optometry, dentistry, law and pharmacy) who finished between 2014 and 2017. To be able to extend the inference of the integrated population to the PSIS population, all data in this article were weighted. The weights are mainly based on the estimated probability of a successful PSIS to census linkage in relation to a PSIS record’s characteristics. Bootstrap weights, used in statistical tests in this study, were calculated by repeatedly resampling non-linkage weights.
Selection criteria
The Census file is used to identify visible minority groups and generation status. Full-time student status, province of residence, family situation and presence of children were extracted from the T1FF whereas age,Note sex, Canadian or international student status, and field of study come from the PSIS. Only graduates who did not return to full-time studies within two years after receiving their degree were retainedNote on the condition that they were matched to the T1FF and to the 2016 Census file. Two years after graduates received their degrees, their characteristics are studied.
Graduates who registered as international students were also excluded. The PSIS differentiates graduates by whether they registered in their program as international students (from abroad) or as Canadian students (Canadian citizens or permanent residents). The transition from school to the labour market is fundamentally different for these two groups because international students more often have the option of leaving Canada if they receive more attractive job offers from their country of origin—an option that is generally less available to Canadian students. Therefore, combining them comes back to neglecting this difference.
Definitions
Visible minorities: people belonging to a group designated as such. The Employment Equity Act defines visible minorities as “persons, other than Aboriginal peoples, who are non-Caucasian in race or non-white in colour.” The visible minority population consists mainly of the following groups: South Asian, Chinese, Black, Filipino, Arab, Latin American, Southeast Asian, West Asian, Korean and Japanese.
Generation status: whether the person or his or her parents were born in Canada.
- First-generation: includes people who were born outside Canada. For the most part, these are people who are now, or have ever been, landed immigrants in Canada.
- Second-generation: includes people born inside Canada with at least one parent born outside Canada. For the most part, these are the children of immigrants.
- Third-generation or more: includes people who were born inside Canada with both parents born inside Canada.
Family situation: derived from the T1 Family File (T1FF).
- The graduate is a “dependent child” (for income tax purposes) if he or she reports the same address of correspondence as his or her parent(s). Dependent children do not report living with a partner and do not have children themselves.
- Graduates who are “part of a couple” are not “dependent children” and are part of a couple living together at the same address (married or living common law, including same-sex couples), with their children (if they have any) living at the same address. The couple’s children do not live with their partner, do not have children themselves, and live with their parent(s).
- The graduate is at the head of a lone-parent family if he or she is the only parent with one or more children.
- The graduate is considered “not in family” if he or she does not fall under any of the previous three categories. This includes people living alone and people living in a household but not in a family with a couple or a lone-parent family. These people may live with their married children or with their children who have children of their own. They may live with a family to which they are related (e.g., a brother-in-law, a cousin) or not related (e.g., a tenant, a roommate).
Models
A logistical regression model was estimated to measure the probability of having dependent child status for income tax purposes. The variables in the model were as follows: sex, age, generation status, visible minority group, province of residence two years after receiving degree, year degree received, and field of study. The following table presents the results and shows that even after considering the previously mentioned characteristics, the gap between several visible minority groups was still significant.
| Proportion (%) | Unadjusted gap | Adjusted gap | |
|---|---|---|---|
| Black | 26.8 | -7.3 | -7.8Note ** |
| Not a visible minority (RC) | 34.1 | Note ...: not applicable | Note ...: not applicable |
| Latin American | 34.6 | 0.6 | 0.0 |
| Arab | 38.9 | 4.8 | 2.9Note * |
| West Asian | 41.1 | 7.0 | 4.8Note ** |
| Japanese | 42.9 | 8.9 | 6.0Note * |
| Southeast Asian | 50.3 | 16.2 | 5.3Note ** |
| Chinese | 56.2 | 22.1 | 11.7Note ** |
| Korean | 56.4 | 22.3 | 15.4Note ** |
| South Asian | 57.4 | 23.3 | 11.0Note ** |
| Filipino | 62.5 | 28.4 | 20.0Note ** |
... not applicable
Source: Integrated PSIS-T1FF – 2016 Census |
|||
A second model was estimated with probability of having a dependent child (or being a parent) as a dependent variable. The variables in the model were the same as in the previous model: sex, age, generation status, visible minority group, province of residence two years after receiving degree, year degree received, and field of study. The following table presents the results and shows that the gap between several visible minority groups was still significant even after the previously mentioned factors were considered.
| Proportion (%) | Unadjusted gap | Adjusted gap | |
|---|---|---|---|
| Chinese | 5.7 | -10.0 | -5.0Note ** |
| Southeast Asian | 6.8 | -8.9 | -4.2Note ** |
| Filipino | 7.1 | -8.6 | -5.4Note ** |
| Korean | 6.7 | -9.0 | -6.1Note ** |
| Japanese | 8.1 | -7.7 | -5.6Note ** |
| South Asian | 9.0 | -6.7 | -1.3Note ** |
| West Asian | 14.1 | -1.6 | -3.3Note ** |
| Not a visible minority (RC) | 15.7 | Note ...: not applicable | Note ...: not applicable |
| Latin American | 20.0 | 4.3 | 0.2 |
| Arab | 20.2 | 4.5 | 2.2Note * |
| Black | 30.4 | 14.7 | 4.9Note ** |
... not applicable
Source: Integrated PSIS–T1FF–2016 Census file |
|||
End of text box 1
References
Aydemir A. and Sweetman A. 2006. “First and Second Generation Immigrant Educational Attainment and Labor Market Outcomes: A Comparison of the United States and Canada," in IZA DP No. 2298.
Boyd M. 2008. “Variations in socioeconomic outcomes of second generation young adults,” in Canadian Diversity 6 (2) spring 2008. Pp. 20–24.
Brunet, S. 2018. “The transition from school to work: the NEET (not in employment, education or training) indicator for 25- to 29-year-old women and men in Canada.” Catalogue # 81-599.
Fecteau, E., 2021. “Analytical considerations for using the ELMLP databases for parent-child analysis” Canadian Centre for Education Statistics (CCES).
Houle, René. 2020. “Changes in the socioeconomic situation of Canada’s Black population, 2001 to 2016.” 89-657-X202001.
Employment and Social Development Canada. 2019. “2016 Employment Equity Data Report”.
Milan, A., 2016. “Diversity of young adults living with their parents,” in Insights on Canadian Society, 75-006-X.
Picot, G. and Hou F. 2011. “Preparing for Success in Canada and the United States: The Determinants of Educational Attainment Among the Children of Immigrants.”
Provencher, C. Milan, A. Hallman, S. and D’Aoust, C. 2018. “Fertility: Overview, 2012 to 2016”.
Qiu T. and Schellenberg G., 2022. “The relative earnings of individuals in designated visible minority categories in Canada across four workplace sectors,” in Economic and Social Reports.
Statistics Canada, 2017. The Daily. “Immigration and ethnocultural diversity: Key results from the 2016 Census”.
Statistics Canada, 2018. “Labour market outcomes for college and university graduates, class of 2010 to 2014,” in The Daily.
Statistics Canada, 2021. “Longitudinal Information Database (IMDB) Technical Report, 2020.” In Analytical Studies: Methods and References.
Turcotte, M. 2019. “Educational and labour market outcomes of children with an immigrant background by their region of origin.” Ethnicity, Language and Immigration Thematic Series.
Uppal, S and S. LaRochelle-Côté, 2014. “Changes in the occupational profile of young men and women in Canada,” in Insights on Canadian Society, catalogue number 75-006X.
- Date modified: