
Economic and Social Reports
The relative earnings of individuals in designated visible
minority categories in Canada across four workplace sectors
DOI: https://doi.org/10.25318/36280001202200200005-eng
Correction Notice
There was an error in Table 1 of the French version. The following correction has been made: in Table 1, the column heading « Secteur commercial » has been changed to « Secteur non commercial ».
Skip to text
Text begins
Abstract
Using data from the 2016 Census and administrative sources, this study estimates the differences in weekly earnings received by workers in designated visible minority and White categories, as defined by the Employment Equity Act, employed in four broad sectors of the Canadian workforce. Of central interest is whether differences in weekly earnings between these categories were larger in small and medium commercial enterprises than they were in large commercial enterprises and in organizations and enterprises in the non-commercial sector. In the small commercial firm sector, the weekly earnings of men in seven of the nine designated visible minority categories were significantly lower than those of White men, net of sociodemographic and employment characteristics. In the medium commercial firm sector, weekly earnings of men in five of the nine categories were significantly lower than that of White men, while in the large commercial firm sector, weekly earnings were lower in four of the nine categories. In all instances, the magnitude of the difference was largest among Black men. Among women, significantly lower weekly earnings relative to White women were consistently observed only among Black women. In the non-commercial sector, the weekly earnings of men and women in designated visible minority categories were either higher than, or not significantly different from, those of White men and women.
Authors
Theresa Qiu and Grant Schellenberg are with the Social Analysis and Modelling Division, Analytical Studies and Modelling Branch at Statistics Canada.
Introduction
Canada’s Anti-Racism Strategy highlights the importance of data and evidence as tools for identifying and addressing inequalities. In a previous paper requested and financially supported by Canadian Heritage, the weekly earnings received by workers across designated visible minority and White categories, as defined in the Employment Equity Act, were estimated using data from the 2016 Census (Qiu & Schellenberg, 2022). That paper found that, after taking into account sociodemographic and employment characteristics, the weekly earnings of men in 4 of 10 designated visible minority categories were significantly lower than those of White men, with the largest differences observed among Black and Latin American men. In contrast, women in most designated visible minority categories had earnings that were either higher than or not statistically different than the earnings of their White counterparts.
This paper extends the analysis by looking more closely at differences in weekly earnings among individuals employed in four broad sectors of the Canadian workforce. These include large commercial sector firms, medium commercial sector firms and small commercial sector firms, as well as firms and organizations of all sizes in the non-commercial sector, which includes health, education, social services and public administration. Of central interest is whether differences in weekly earnings between individuals in designated visible minority and White categories vary within these sectors.
The relationships between organizational characteristics and the employment outcomes of disadvantaged groups, including racialized communities, has long been a topic of research inquiry (see review in Dobbin et al., 2015). The role that firm size plays in this stem from several considerations. The use of formalized human resources management practices is more prevalent in large, complex organizations than in small ones, and larger firms typically expend more resources on human resources (HR) recruitment, formalized HR processes and professional HR staff (Banerjee et al., 2018). Unionization is also more prevalent in larger than smaller firms, with terms of employment negotiated through collective bargaining and maintained through formal processes (e.g., grievance systems).Note Larger firms may also be more experienced with and sensitive to issues of diversity and equity, assuming that workplace diversity increases with organizational size or that concerns about public image and public scrutiny are more prevalent among larger than smaller firms.
These are some of the factors that motivate Hou and Coulombe’s (2010) study of the relative earnings of Canadian workers in designated visible minority categories employed in the public and private sectors. Those in the public sector are expected to fare better, given requirements of employment equity regulations and policies, sensitivity of the public sector to its “…image as a non-discriminating employer,” high rates of unionization and other factors (p. 30). Using 2006 Census data, Hou and Coulombe (2010) find that “…visible minorities and Whites receive similar pay for similar jobs in the public sector. By contrast, in the private sector visible minority men earn significantly less than observationally comparable Whites” (p. 29).
Variation in employment outcomes across firm size is documented by Banerjee et al. (2018). Using evidence from the discrimination audit study by Oreopoulos (2011), they examined discrimination in hiring decisions across larger and smaller firms in Canada and found:
This current study adds to the Canadian research literature on the employment outcomes of individuals in designated visible minority categories. Information from administrative data sources is appended to the 2016 Census, and employed individuals are sorted into workplace sectors, defined in terms of industry and enterprise size. Weekly earnings differences within sectors are then estimated.
Data and methods
Data and sample selection
This study uses data from the 2016 Census file that was augmented with information on firm size, industry and union status drawn from the T4 Statement of Remuneration file and the Longitudinal Employment Analysis Program (LEAP). The linkage rate between 2016 Census respondents meeting the study selection criteria (see below) and the T4-LEAP file was 97.8% among men and 98.2% among women, meaning that the linkage process introduced little sample loss or selection bias.
The analysis is restricted to individuals who were born in Canada, were aged 25 to 44 at the time of the 2016 Census, had at least one week of paid employment and $500 in earnings in 2015, and were not self-employed in that year. Restricting the analysis to individuals born in Canada removes immigration-related factors associated with earnings, such as foreign credential recognition, foreign work experience and knowledge of official languages. Given that far larger shares of individuals in designated visible minority categories than the White category are immigrants, this provides a more even basis for comparison. Similarly, there are large differences in the age profiles of Canadian-born individuals in designated visible minority and White categories (Qiu & Schellenberg, 2022) and restricting the study population to individuals aged 25 to 44 reduces the confounding effects of this. Weeks of employment and minimum earnings criteria are imposed to limit the study to earnings conditional on employment, while self-employed individuals are excluded to avoid earnings-related issues pertaining to business operations, accounting conventions and taxation of business income. In addition to these selection criteria, those who responded “First Nation”, “Métis” and/or “Inuit” to the census question on the Indigenous group are excluded from this analysis. Specific histories and circumstances pertaining to Indigenous people and established working relationships between Statistics Canada and Indigenous and Northern Affairs Canada, Indigenous Services Canada, and national Indigenous organizations necessitate a separate analysis. Overall, the sample for the study population comprised approximately 538,000 men and 515,000 women.
Dependent variable
The outcome of interest in this study is the difference in average weekly earnings received by individuals in designated visible minority and White categories. Average weekly earnings are calculated as total wages and salaries received in 2015 divided by the number of weeks worked during that year. Both variables are from the 2016 Census. The measurement of earnings on a weekly basis, combined with a mostly full-time or part-time employment variable accounts for some, but not all, variation in labour supply. A limitation of the average weekly earnings measure is that it does not capture earnings differences attributable to differential access to full-year employment that individuals in some designated visible minority categories may experience.
Independent variables
Industry and enterprise size variables were used to group the study population into one of four broad workplace sectors. Those employed in the non-commercial sector, defined as health care and social assistance (industry codes = 62), education services (industry codes = 61) and public administration (industry codes = 91), were distinguished from those in the commercial sector, defined as all other industries. The label “non-commercial sector” rather than “public sector” is used, recognizing that some enterprises in health and education are privately owned and operated. Individuals employed in the commercial sector were further subdivided into those working in small, medium or large business enterprises. Large enterprises were those with 500 or more employees, medium enterprises were those with 25 to 499 employees, and small enterprises were those with 1 to 24 employees. Individuals who had more than one job during the year were allocated to the sector of their job with the highest T4 earnings.
A set of socioeconomic control variables, including age, age-squared, educational attainment, knowledge of official languages, census family status, province of residence and census metropolitan area (CMA) of residence are included in the analysis. Sex is taken into account by running separate models for men and women, consistent with a Gender-based Analysis Plus approach. And a set of employment characteristics, including full-time or part-employment status, union status, occupation,Note and industry,Note are also included. Overall, a broad set of characteristics capturing aspects of human capital, jobs and organizational contexts were taken into account.
Individuals in the study population were categorized on the basis of their response to the “designated visible minority question” on the 2016 Census. As stated in census documentation:
Twelve response categories are provided for this question. These include
- White
- South Asian (e.g., East Indian, Pakistani, Sri Lankan)
- Chinese
- Black
- Filipino
- Arab
- Latin American
- Southeast Asian (e.g., Vietnamese, Cambodian, Laotian, Thai)
- West Asian (e.g., Iranian, Afghan)
- Korean
- Japanese
- Other visible minorities.Note
While the total sample for the study was quite large, disaggregation by sex, designated visible minority categories and workplace sectors yielded some small within-cell samples. This necessitated some aggregation of the 12 response categories above to increase within-cell sample sizes and strengthen statistical estimates. Individuals in the Arab and West Asian categories were combined into a single category for this reason, as were individuals in the Korean and Japanese categories. In this paper, the term “categories of interest” refers to the 10 categories used, including “White,” while the term “designated visible minority categories” refers to individuals in the 9 categories aside from White.
Looking across workplace sectors
An overview of the distributions of individuals across the four workplace sectors provides context for the analysis of weekly earnings. Among all men in the study population, the shares employed in the non-commercial sector ranged from 17% to 21% across most categories of interest. Among all women in the study population, over 40% worked in the non-commercial sector—a share twice that of men. In part, this reflects the large shares of women in health and education occupations.Note The shares of women employed in the non-commercial sector ranged from 37% to 45% across most categories of interest. Sociodemographic characteristics that may be associated with employment in the non-commercial sector, such as age and education, are not taken into account in Table 1.
| Non-commercial sector | Large commercial sector firms | Medium commercial sector firms | Small commercial sector firms | Total | |
|---|---|---|---|---|---|
| percent | |||||
| Men | |||||
| Total | 17.5 | 32.0 | 29.9 | 20.6 | 100 |
| White | 17.4 | 31.3 | 30.2 | 21.1 | 100 |
| South Asian | 19.8 | 42.2 | 23.7 | 14.4 | 100 |
| Chinese | 19.9 | 41.6 | 24.5 | 14.0 | 100 |
| Black | 17.6 | 41.6 | 28.0 | 12.8 | 100 |
| Filipino | 21.0 | 41.8 | 25.8 | 11.4 | 100 |
| Latin American | 12.9 | 37.0 | 32.0 | 18.1 | 100 |
| Southeast Asian | 14.2 | 38.1 | 29.3 | 18.4 | 100 |
| Arab/West Asian | 17.7 | 37.4 | 25.3 | 19.6 | 100 |
| Korean/Japanese | 20.8 | 34.6 | 25.4 | 19.2 | 100 |
| Other | 17.7 | 39.2 | 28.3 | 14.8 | 100 |
| Women | |||||
| Total | 44.2 | 22.4 | 18.7 | 14.8 | 100 |
| White | 44.5 | 21.6 | 18.8 | 15.1 | 100 |
| South Asian | 44.3 | 29.8 | 15.9 | 10.0 | 100 |
| Chinese | 37.7 | 32.8 | 18.3 | 11.1 | 100 |
| Black | 41.6 | 32.1 | 17.2 | 9.1 | 100 |
| Filipino | 42.8 | 29.9 | 18.2 | 9.1 | 100 |
| Latin American | 34.1 | 33.8 | 19.4 | 12.7 | 100 |
| Southeast Asian | 30.1 | 32.5 | 22.5 | 14.9 | 100 |
| Arab/West Asian | 38.1 | 32.6 | 16.7 | 12.6 | 100 |
| Korean/Japanese | 40.2 | 26.6 | 19.9 | 13.3 | 100 |
| Other | 37.7 | 31.4 | 19.5 | 11.4 | 100 |
|
Notes: LEAP = Longitudinal Employment Analysis Program. Sample includes non-Indigenous persons aged 25 to 44, who were born in Canada, who had at least one week of paid employment and $500 in earnings in 2015, and were not self-employed that year. Sources Statistics Canada, 2016 Census and 2015 T4-LEAP file. |
|||||
Turning to other workplace sectors, 82% of men and 56% of women in the study population were employed in the commercial sector. Larger shares of individuals in designated visible minority categories than White individuals were employed in the large commercial firm sector. Around 42% of South Asian, Chinese, Black and Filipino men worked in this sector, compared with 31% of White men (Table 1). Similarly, larger shares of women in most designated visible minority categories than in the White category worked in the large commercial firm sector. This could reflect various factors, such as greater opportunity for employment in large commercial firms in the large CMAs where most individuals in designated visible minority categories live, or the industrial composition of those CMAs. In addition, some studies suggest that individuals in disadvantaged groups may self-select towards larger firms with expectations that formalized HR processes will improve their chances for employment (Barbulescu & Bidwell, 2013). The focus of this analysis is not on the overrepresentation or underrepresentation of individuals in workplace sectors, but rather on their relative earnings within those sectors.
Selected compositional characteristics of individuals in the four workplace sectors are shown for men and women in Appendix Tables 1 and 2, respectively. A few highlights are noted here. Rates of unionization are highest in the non-commercial sector, ranging from 60% to 70% among men and women in most categories of interest. Unionization rates are generally similar among men and women in this sector. Unionization rates are lower in the commercial sector, declining successively across large, medium and small firms. Considering other characteristics, average ages are oldest among men and women in the non-commercial sector and youngest among those in small commercial sector firms. Educational attainment follows the same pattern, with university degrees most prevalent among individuals in the non-commercial sector and least prevalent among those in the small commercial firm sector.
Results
Mean weekly earnings
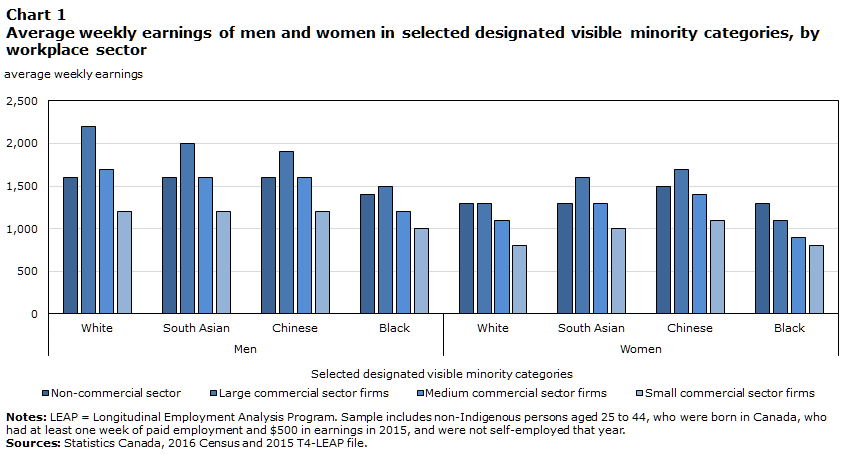
The analysis now turns to the weekly earnings received by men and women in the study population. Unadjusted averages are presented first, followed by a multivariate analysis that takes into account individuals’ sociodemographic and employment characteristics. Average weekly earnings within workplace sectors for men and women in designated visible minority and White categories are shown in Appendix Table 3; averages for White, South Asian, Chinese and Black individuals—the latter three being the numerically largest designated visible minority categories—are highlighted in Chart 1.
Among men, average weekly earnings were $1,600 in the non-commercial sector, and somewhat higher in the large commercial firm sector at $2,200. Within the commercial sectors, average weekly earnings declined successively across large, medium and small firms (Chart 1). Among women, average weekly earnings were $1,300 in the non-commercial sector, somewhat higher in the large commercial firm sector, at $1,300, and again successively lower in the medium and small commercial firm sectors.Note Average weekly earnings were lower among women than men in each of the four sectors.
Data table for Chart 1
| Selected designated visible minority categories | Non-commercial sector | Large commercial sector firms | Medium commercial sector firms | Small commercial sector firms | |
|---|---|---|---|---|---|
| average weekly earnings | |||||
| Men | White | 1,600 | 2,200 | 1,700 | 1,200 |
| South Asian | 1,600 | 2,000 | 1,600 | 1,200 | |
| Chinese | 1,600 | 1,900 | 1,600 | 1,200 | |
| Black | 1,400 | 1,500 | 1,200 | 1,000 | |
| Women | White | 1,300 | 1,300 | 1,100 | 800 |
| South Asian | 1,300 | 1,600 | 1,300 | 1,000 | |
| Chinese | 1,500 | 1,700 | 1,400 | 1,100 | |
| Black | 1,300 | 1,100 | 900 | 800 | |
|
Notes: LEAP = Longitudinal Employment Analysis Program. Sample includes non-Indigenous persons aged 25 to 44, who were born in Canada, who had at least one week of paid employment and $500 in earnings in 2015, and were not self-employed that year. Sources: Statistics Canada, 2016 Census and 2015 T4-LEAP file. |
|||||
Looking more closely across designated visible minority categories, Chinese, Korean/Japanese, and South Asian men generally had average weekly earnings that were among the highest within workplace sectors, while Black, Filipino and Latin American men generally had average weekly earnings that were among the lowest (Appendix Table 3). Among men, the range from lowest to highest average earnings across categories of interest was about $400 in the non-commercial sector and about $700 to $1,000 in the small, medium and large commercial firm sectors.
Among women, Chinese, Korean/Japanese, and South Asian women had average weekly earnings that were generally among the highest within sectors, while Latin American, Southeast Asian and Black women had average weekly earnings that were generally the lowest. Among women, the range from lowest to highest average earnings across categories of interest was about $300 in the non-commercial sector and about $400 to $700 in the small, medium and large commercial firm sectors.
Multivariate results
To refine these comparisons of weekly earnings, a set of multivariate regression models was run for men and women in each of the four workplace sectors. The natural log of weekly earnings was regressed against the sociodemographic and employment characteristics introduced above. Of central interest are the weekly earnings of individuals in each designated visible minority category relative to White individuals, after taking into account other observed characteristics. Two specifications of these ordinary least squares regression models are presented. The first specification (i.e., Model 1) includes only sociodemographic characteristics; the second specification, Model 2, additionally includes employment characteristics. This strategy provides some flexibility in the approach to earnings differentials. Model 1 removes the effects of age, family composition, place of residence, education, and bilingualism, with the intent of tightening the comparisons to “observationally equivalent” individuals. It allows scope for employment characteristics that may vary between individuals in designated visible minority and White categories to be reflected in relative earnings, recognizing that access to different types of jobs may itself be a dimension of inequality. Model 2 additionally removes the effects of some employment characteristics, specifically full-time or part-time employment status, unionization, occupation and industry. This compares observationally equivalent individuals in observationally equivalent jobs, as measured using the two sets of covariates. Overall, Model 1 compares people with the same personal characteristics who work within a sector and asks if their weekly earnings are significantly different, while Model 2 compares people with the same personal and employment characteristics who work within a sector and asks the same question. The assumption underlying Model 2 is that access to occupations, industries, unionized jobs and full-time employment are not differentially constrained across categories (Hou & Coulombe, 2010). The full set of regression coefficients are shown for men in Appendix Table 4 and for women in Appendix Table 5. In addition, Table 2 below shows the estimated percent difference in weekly earnings between individuals in designated visible minority categories relative to their White counterparts, calculated as the (Exponent(log coefficient)-1)*100.
The discussion begins with men. In the non-commercial sector, the weekly earnings of men in six of the nine designated visible minority categories did not differ significantly from those of White men, net of sociodemographic characteristics (Table 2, Model 1). Weekly earnings of South Asian and Chinese men were 6% to 9% higher than those of White men in the sector, while it was only the weekly earnings of Black men that were significantly lower (-8%). This latter difference in weekly earnings became non-significant when employment characteristics were added to the analysis (Table 2, Model 2), suggesting it was the types of jobs held by Black and White men in the non-commercial sector that accounted for much of the difference in weekly earnings. When employment characteristics were additionally taken into account, the weekly earnings of men in three of the nine designated visible minority categories (South Asian, Chinese and Latin American) were significantly higher than those of White men in the non-commercial sector, while the weekly earnings of men in the six other categories were not significantly different from those of White men.
In the large commercial firm sector, negative earnings differences between categories were more prevalent. Net of sociodemographic characteristics, the weekly earnings of Black, Latin American, Filipino, Korean and other visible minority men were significantly lower than those of White men, by 6% to 19% (Table 2, Model 1). When employment characteristics were additionally taken into account, earnings differences remained significantly lower among Black, Filipino, Latin American, and other visible minority men, by 8% to 11%.
Negative earnings differences were still more prevalent in medium commercial firm sector. The weekly earnings of men in seven of the nine designated visible minority were significantly lower than those of White men when sociodemographic characteristics were taken into account, with this difference ranging from -3% among South Asian men to -24% among Black men. When employment characteristics were additionally taken into account, weekly earnings remained significantly lower among men in five categories, with the largest difference observed among Black men (-16%).
In the small commercial firm sector, the weekly earnings of men in seven of the nine designated visible minority categories were significantly lower than those of White men, net of sociodemographic characteristics. These differences remained significant when employment characteristics were taken into account, at -18% among Black men and -15% among Latin American men and -5% to -10% percent among men in five other categories.Note Overall, the expectation that negative earnings differentials are less prevalent in larger than smaller enterprises is observed among the men in the study population.
The weekly earnings of women within sectors exhibited different patterns than observed among men. In the non-commercial sector, the weekly earnings of women in four of the nine designated visible minority categories were significantly higher than those of White women, net of sociodemographic characteristics, while the weekly earnings of women in the other five categories were not significantly different (Table 2). When employment characteristics were additionally taken into account, the weekly earnings of Chinese, Filipino and Southeast Asian women in the non-commercial sector were 6% to 9% higher than those of White women, while the weekly earnings of South Asian, Black, and other visible minority women were 2% to 4% higher.
Across large, medium and small commercial firm sectors, the most noticeable results were the high weekly earnings of Chinese women relative to White women and the consistently lower weekly earnings of Black women relative to White women. The differences between Black and White women ranged from -7% to -10%, net of sociodemographic and employment characteristics. Significant negative differences in weekly earnings in the commercial sectors were not observed among women in other designated visible minority categories.
| Non-commercial sector | Large commercial firm sector | Medium commercial firm sector | Small commercial firm sector | |||||
|---|---|---|---|---|---|---|---|---|
| Model 1 Sociodemographic characteristics only | Model 2 Sociodemographic and employment characteristics | Model 1 Sociodemographic characteristics only | Model 2 Sociodemographic and employment characteristics | Model 1 Sociodemographic characteristics only | Model 2 Sociodemographic and employment characteristics | Model 1 Sociodemographic characteristics only | Model 2 Sociodemographic and employment characteristics | |
| percent | ||||||||
| Men | ||||||||
| White (reference group) | Note ...: not applicable | Note ...: not applicable | Note ...: not applicable | Note ...: not applicable | Note ...: not applicable | Note ...: not applicable | Note ...: not applicable | Note ...: not applicable |
| South Asian | 9.4Note *** | 7.3Note *** | -1.0 | 0.0 | -3.0Note * | -1.0 | -4.9Note ** | -4.9Note ** |
| Chinese | 6.2Note *** | 5.1Note ** | -1.0 | -1.0 | -6.7Note *** | -3.9Note ** | -11.3Note *** | -6.8Note *** |
| Black | -7.7Note *** | -2.0 | -18.9Note *** | -11.3Note *** | -23.7Note *** | -15.6Note *** | -23.7Note *** | -18.1Note *** |
| Filipino | 0.0 | 3.0 | -14.8Note *** | -7.7Note *** | -11.3Note *** | -3.9Note * | -6.8 | 1.0 |
| Latin American | 7.3 | 7.3Note * | -15.6Note *** | -9.5Note *** | -12.2Note *** | -6.8Note ** | -19.7Note *** | -14.9Note *** |
| Southeast Asian | 2.0 | 3.0 | 0.0 | 2.0 | -8.6Note ** | -4.9 | -18.1Note *** | -7.7Note * |
| Arab/West Asian | 3.0 | 4.1 | 1.0 | 2.0 | 4.1 | 4.1 | -15.6Note *** | -9.5Note * |
| Korean/Japanese | -1.0 | -3.0 | -5.8Note ** | -2.0 | -2.0 | 0.0 | -3.0 | 1.0 |
| Other visible minority | 0.0 | 2.0 | -10.4Note *** | -7.7Note *** | -10.4Note *** | -3.9Note * | -13.1Note *** | -8.6Note ** |
| Women | ||||||||
| White (reference group) | Note ...: not applicable | Note ...: not applicable | Note ...: not applicable | Note ...: not applicable | Note ...: not applicable | Note ...: not applicable | Note ...: not applicable | Note ...: not applicable |
| South Asian | 4.1Note *** | 2.0Note * | 3.0Note * | 1.0 | 2.0 | 0.0 | 2.0 | -1.0 |
| Chinese | 8.3Note *** | 8.3Note *** | 11.6Note *** | 5.1Note *** | 11.6Note *** | 6.2Note *** | 8.3Note ** | 3.0 |
| Black | 0.0 | 2.0Note ** | -11.3Note *** | -6.8Note *** | -13.9Note *** | -10.4Note *** | -12.2Note *** | -7.7Note *** |
| Filipino | 12.7Note *** | 9.4Note *** | -1.0 | 0.0 | -3.0 | -1.0 | -2.0 | -2.0 |
| Latin American | -1.0 | -1.0 | -10.4Note *** | -4.9Note * | -5.8 | -3.0 | -2.0 | 1.0 |
| Southeast Asian | 5.1Note * | 6.2Note ** | 3.0 | 0.0 | 5.1 | 5.1 | 2.0 | 3.0 |
| Arab/West Asian | -3.0 | -1.0 | -3.9 | 0.0 | 1.0 | 3.0 | -5.8 | -4.9 |
| Korean/Japanese | -1.0 | 0.0 | 1.0 | 3.0 | 6.2 | 8.3Note ** | -3.9 | -2.0 |
| Other visible minority | 2.0 | 4.1Note * | -4.9Note ** | -3.9Note ** | -2.0 | -3.0 | -2.0 | -2.0 |
... not applicable
Sample includes non-Indigenous persons aged 25 to 44, who were born in Canada, who had at least one week of paid employment and $500 in earnings in 2015, and were not self-employed that year. Model 1 also includes age, age-squared, education, family composition, English/French bilingual status, province of residence, census metropolitan area of residence. Model 2 additionally includes occupation, industry, unionization, and full-time or part-time status. Sources: Statistics Canada, 2016 Census and 2015 T4-LEAP file. |
||||||||
Some comment is warranted on the correlations between weekly earnings and the sociodemographic and employment control variables used in the analysis. These correlations are shown for men in Appendix Table 4 and for women in Appendix Table 5. The correlation coefficients from Model 2, including both socioeconomic and employment characteristics, are shown. Given the large number of data points in these tables, results are discussed in fairly broad terms.
Across the eight models, weekly earnings were consistently and positively correlated with age, educational attainment and bilingualism, as expected. In addition, weekly earnings were generally higher in Toronto, Vancouver and Montréal than in areas outside of Canada’s 35 CMAs.Note And compared with Ontario, weekly earnings were generally higher in western Canada, particularly in the oil-producing provinces of Alberta and Saskatchewan, and in Newfoundland and Labrador—another oil-producing province. Compared with Ontario, weekly earnings were lower in Quebec and the Maritime provinces. Weekly earnings varied significantly across family composition in ways that differed between women and men. For example, among men who were married or in common-law relationships, weekly earnings were higher among those with children than those without, while among women who were married or in common-law relationships weekly earnings were lower among those with children than those without.
Considering employment characteristics, weekly earnings across occupational categories yielded expected results, such as significantly and substantially lower earnings in sales and personal and customer services occupations than in management occupations. Expected results are also observed across industries, such as significantly higher earnings in mining, oil and gas and utilities than in manufacturing. Similarly, the strong correlation expected between weekly earnings and mostly full-time or part-time status is observed and between union status and weekly earnings.
Discussion and conclusions
Overall, this study yields more disaggregated information on the relative weekly earnings of individuals in designated visible minority and White categories than has been available to date.
The results are partially consistent with expectations about how earnings differences between individuals in designated visible minority and White categories might vary across workplace sectors.
In the non-commercial sector, the relative weekly earnings of women and men in visible minority groups compared favourably with White women and men. Net of sociodemographic and employment characteristics, weekly earnings relative to White individuals were significantly higher among men in three of the nine designated visible minority categories and among women in six of the nine categories. Weekly earnings among men and women in other categories did not differ significantly from White men and women in this sector.
In the commercial sector, negative earnings differences relative to White men were observed among men in several designated visible minority categories. In the large commercial firm sector, weekly earnings relative to White men were significantly lower among men in four of the nine designated visible minority categories. In the medium commercial firm sector, weekly earnings were significantly lower among men in five of the nine categories, and in the small commercial firm sector, weekly earnings were significantly lower among men in seven of the nine categories. In all instances, the magnitude of the difference was largest among Black men. Overall, it was among men employed in the small commercial firm sector that differences in weekly earnings between designated visible minority and White categories were most prevalent.
Among women in the commercial firm sectors, weekly earnings between designated visible minority and White categories were not significantly different in most cases. This may reflect lower average weekly earnings among White women than White men and the lower benchmark against which women in designated visible minority categories are being compared with. The consistently low relative earnings among Black women in the commercial firm sectors is another result that stands out.
Looking ahead, the 2021 Census will soon provide the opportunity to update the analysis above. This will be informative given that the cohort of Canadian-born individuals included in this study will be five years older and further along their career and earnings trajectories in 2021 than they were in 2016.
Appendix tables
| Mean age | Percentage with bachelor's degree or higher | Percentage work mostly part-time | Percentage unionized | Percentage in sales or service occupations | |
|---|---|---|---|---|---|
| year | percent | ||||
| Non-commercial sector | |||||
| Total | 34.9 | 47.5 | 7.6 | 69.1 | 11.6 |
| White | 35.0 | 46.4 | 7.3 | 69.2 | 11.5 |
| South Asian | 33.7 | 68.2 | 9.0 | 67.3 | 10.7 |
| Chinese | 32.8 | 75.1 | 10.3 | 66.9 | 6.4 |
| Black | 34.1 | 37.1 | 15.6 | 70.5 | 23.8 |
| Filipino | 33.5 | 46.8 | 11.9 | 67.1 | 15.8 |
| Latin American | 32.1 | 36.5 | 11.8 | 67.7 | 16.7 |
| Southeast Asian | 30.8 | 59.5 | 16.0 | 64.8 | 9.5 |
| Arab/West Asian | 32.4 | 63.0 | 12.2 | 67.0 | 10.2 |
| Korean/Japanese | 34.8 | 73.2 | 8.4 | 67.6 | 5.0 |
| Other | 33.5 | 59.2 | 12.7 | 67.0 | 13.1 |
| Large commercial sector firms | |||||
| Total | 34.3 | 25.3 | 5.5 | 27.9 | 18.4 |
| White | 34.5 | 23.7 | 5.0 | 28.8 | 17.6 |
| South Asian | 32.3 | 48.2 | 9.2 | 16.2 | 24.2 |
| Chinese | 32.5 | 63.3 | 7.1 | 13.0 | 18.3 |
| Black | 33.1 | 19.8 | 14.3 | 28.0 | 32.6 |
| Filipino | 33.2 | 27.3 | 10.4 | 23.4 | 27.1 |
| Latin American | 31.3 | 16.9 | 13.2 | 27.2 | 29.7 |
| Southeast Asian | 30.0 | 37.4 | 11.5 | 20.2 | 26.1 |
| Arab/West Asian | 31.5 | 42.9 | 9.9 | 20.1 | 25.8 |
| Korean/Japanese | 33.5 | 50.7 | 8.4 | 15.9 | 22.3 |
| Other | 32.3 | 34.1 | 9.8 | 17.9 | 26.2 |
| Medium commercial sector firms | |||||
| Total | 33.8 | 18.0 | 4.9 | 14.6 | 17.3 |
| White | 33.9 | 17.0 | 4.6 | 15.1 | 16.8 |
| South Asian | 32.3 | 40.0 | 8.0 | 6.4 | 21.2 |
| Chinese | 32.1 | 51.9 | 6.5 | 3.7 | 20.3 |
| Black | 32.6 | 14.6 | 13.5 | 12.2 | 28.6 |
| Filipino | 32.2 | 19.4 | 9.4 | 6.9 | 28.4 |
| Latin American | 30.4 | 12.1 | 10.0 | 13.9 | 29.0 |
| Southeast Asian | 30.0 | 30.6 | 9.8 | 6.7 | 23.0 |
| Arab/West Asian | 31.4 | 34.7 | 5.5 | 6.9 | 21.6 |
| Korean/Japanese | 33.2 | 48.5 | 4.4 | 5.8 | 17.1 |
| Other | 31.8 | 27.5 | 9.5 | 7.4 | 23.8 |
| Small commercial sector firms | |||||
| Total | 33.3 | 14.6 | 7.5 | 8.6 | 15.1 |
| White | 33.4 | 13.7 | 7.1 | 9.0 | 14.7 |
| South Asian | 31.9 | 35.5 | 10.6 | 1.3 | 18.3 |
| Chinese | 31.2 | 48.8 | 15.5 | 0.4 | 22.3 |
| Black | 32.0 | 13.0 | 16.6 | 5.2 | 25.4 |
| Filipino | 31.7 | 20.3 | 15.2 | 1.1 | 26.7 |
| Latin American | 29.9 | 11.9 | 15.9 | 6.7 | 25.3 |
| Southeast Asian | 29.1 | 22.9 | 20.2 | 1.9 | 32.1 |
| Arab/West Asian | 31.5 | 29.8 | 14.0 | 3.2 | 28.0 |
| Korean/Japanese | 33.1 | 37.5 | 10.1 | 1.1 | 22.4 |
| Other | 31.1 | 24.0 | 12.3 | 2.4 | 23.9 |
|
Notes: LEAP = Longitudinal Employment Analysis Program. Sample includes non-Indigenous persons aged 25 to 44, who were born in Canada, who had at least one week of paid employment and $500 in earnings in 2015, and were not self-employed that year. Sources: Statistics Canada, 2016 Census and 2015 T4-LEAP file. |
|||||
| Mean age | Percentage with Bachelor's degree or higher | Percentage work mostly part-time | Percentage unionized | Percentage in sales or service occupations | |
|---|---|---|---|---|---|
| years | percent | ||||
| Non-commercial sector | |||||
| Total | 34.6 | 52.5 | 18.7 | 69.7 | 14.5 |
| White | 34.7 | 51.6 | 18.7 | 70.1 | 14.8 |
| South Asian | 32.8 | 70.0 | 17.1 | 65.1 | 8.8 |
| Chinese | 32.6 | 81.5 | 17.0 | 65.2 | 6.0 |
| Black | 33.6 | 46.5 | 20.4 | 65.7 | 18.5 |
| Filipino | 33.3 | 57.5 | 17.9 | 65.5 | 8.8 |
| Latin American | 31.6 | 38.8 | 18.4 | 59.2 | 15.9 |
| Southeast Asian | 30.1 | 63.2 | 18.9 | 62.6 | 11.7 |
| Arab/West Asian | 32.0 | 65.7 | 20.6 | 65.2 | 10.2 |
| Korean/Japanese | 34.1 | 78.0 | 19.2 | 62.4 | 5.6 |
| Other | 32.6 | 65.0 | 18.9 | 62.7 | 10.4 |
| Large commercial sector firms | |||||
| Total | 34.0 | 33.7 | 14.2 | 15.5 | 32.8 |
| White | 34.3 | 31.6 | 14.2 | 15.9 | 32.9 |
| South Asian | 32.1 | 58.7 | 14.2 | 10.0 | 28.7 |
| Chinese | 32.2 | 72.1 | 8.5 | 9.3 | 21.9 |
| Black | 32.8 | 29.6 | 19.5 | 17.0 | 41.6 |
| Filipino | 32.7 | 42.4 | 14.6 | 11.6 | 31.3 |
| Latin American | 31.6 | 24.1 | 22.9 | 19.2 | 42.8 |
| Southeast Asian | 29.9 | 46.8 | 14.2 | 9.5 | 31.4 |
| Arab/West Asian | 31.2 | 50.6 | 20.0 | 11.3 | 39.0 |
| Korean/Japanese | 33.9 | 59.5 | 11.0 | 11.9 | 23.9 |
| Other | 32.1 | 46.6 | 14.9 | 10.9 | 32.7 |
| Medium commercial sector firms | |||||
| Total | 33.5 | 27.5 | 14.9 | 6.5 | 34.0 |
| White | 33.7 | 26.1 | 14.8 | 6.7 | 34.3 |
| South Asian | 31.9 | 54.0 | 14.3 | 3.9 | 26.6 |
| Chinese | 31.8 | 63.4 | 11.3 | 2.9 | 20.9 |
| Black | 32.0 | 27.8 | 19.4 | 6.1 | 37.5 |
| Filipino | 31.9 | 36.6 | 18.0 | 2.5 | 31.2 |
| Latin American | 30.1 | 23.5 | 21.9 | 6.0 | 39.1 |
| Southeast Asian | 29.2 | 38.2 | 19.6 | 2.8 | 32.8 |
| Arab/West Asian | 30.7 | 44.9 | 20.8 | 3.2 | 35.6 |
| Korean/Japanese | 32.1 | 51.9 | 15.8 | 3.2 | 28.3 |
| Other | 31.1 | 40.2 | 15.3 | 3.6 | 28.6 |
| Small commercial sector firms | |||||
| Total | 33.6 | 23.2 | 25.3 | 1.0 | 35.0 |
| White | 33.7 | 22.0 | 25.3 | 1.0 | 35.4 |
| South Asian | 31.4 | 52.4 | 25.6 | 0.3 | 22.1 |
| Chinese | 31.3 | 61.5 | 20.4 | 0.6 | 21.4 |
| Black | 31.8 | 25.7 | 29.7 | 0.7 | 39.8 |
| Filipino | 31.8 | 31.8 | 24.1Appendix Table 2 Note ‡ | Appendix Table 2 Note ‡ | 34.2 |
| Latin American | 30.6 | 16.9 | 29.9 | 1.2 | 33.6 |
| Southeast Asian | 28.9 | 32.1 | 21.6 | 0.4 | 43.5 |
| Arab/West Asian | 31.9 | 39.0 | 30.0 | 0.6 | 28.4 |
| Korean/Japanese | 33.1 | 47.2 | 28.8Appendix Table 2 Note ‡ | Appendix Table 2 Note ‡ | 24.8 |
| Other | 30.6 | 38.8 | 23.3 | 0.3 | 30.7 |
Sample includes non-Indigenous persons aged 25 to 44, who were born in Canada, who had at least one week of paid employment and $500 in earnings in 2015, and were not self-employed that year. Sources: Statistcs Canada, 2016 Census and 2015 T4-LEAP file. |
|||||
| Non-commercial sector | Large commercial sector firms | Medium commercial sector firms | Small commercial sector firms | |
|---|---|---|---|---|
| dollars | ||||
| Men | ||||
| Total | 1,600 | 2,200 | 1,700 | 1,200 |
| White | 1,600 | 2,200 | 1,700 | 1,200 |
| South Asian | 1,600 | 2,000 | 1,600 | 1,200 |
| Chinese | 1,600 | 1,900 | 1,600 | 1,200 |
| Black | 1,400 | 1,500 | 1,200 | 1000 |
| Filipino | 1,300 | 1,400 | 1,300 | 1,000 |
| Latin American | 1,500 | 1,300 | 1,200 | 800 |
| Southeast Asian | 1,400 | 1,500 | 1,300 | 900 |
| Arab/West Asian | 1,500 | 1,800 | 1,600 | 1,300 |
| Korean/Japanese | 1,800 | 2,200 | 2,200 | 1,500 |
| Other visible minorities | 1,400 | 1,500 | 1,400 | 1,000 |
| Women | ||||
| Total | 1,300 | 1,300 | 1,100 | 800 |
| White | 1,300 | 1,300 | 1,100 | 800 |
| South Asian | 1,300 | 1,600 | 1,300 | 1000 |
| Chinese | 1,500 | 1,700 | 1,400 | 1,100 |
| Black | 1,300 | 1,100 | 900 | 800 |
| Filipino | 1,400 | 1,300 | 1,100 | 900 |
| Latin American | 1,200 | 1,000 | 800 | 700 |
| Southeast Asian | 1,200 | 1,200 | 1,100 | 700 |
| Arab/West Asian | 1,400 | 1,200 | 1,100 | 900 |
| Korean/Japanese | 1,400 | 1,700 | 1,300 | 1000 |
| Other visible minorities | 1,300 | 1,200 | 1,100 | 1000 |
|
Notes: LEAP = Longitudinal Employment Analysis Program. Sample includes non-Indigenous persons aged 25 to 44, who were born in Canada, who had at least one week of paid employment and $500 in earnings in 2015, and were not self-employed that year. Results are rounded to the nearest 100. Sources: Statistics Canada, 2016 Census and 2015 T4-LEAP file. |
||||
| Non-commercial sector | Large commercial sector firms | Medium commercial sector firms | Small commercial sector firms | |
|---|---|---|---|---|
| coefficient | ||||
| Men | ||||
| Visible minority status | ||||
| White (reference group) | Note ...: not applicable | Note ...: not applicable | Note ...: not applicable | Note ...: not applicable |
| South Asian | 0.07Note *** | 0.00 | -0.01 | -0.05Note ** |
| Chinese | 0.05Note ** | -0.01 | -0.04Note ** | -0.07Note *** |
| Black | -0.02 | -0.12Note *** | -0.17Note *** | -0.20Note *** |
| Filipino | 0.03 | -0.08Note *** | -0.04Note * | 0.01 |
| Latin American | 0.07Note * | -0.10Note *** | -0.07Note ** | -0.16Note *** |
| Southeast Asian | 0.03 | 0.02 | -0.05 | -0.08Note * |
| Arab/West Asian | 0.04 | 0.02 | 0.04 | -0.10Note * |
| Korean/Japanese | -0.03 | -0.02 | 0.00 | 0.01 |
| Other | 0.02 | -0.08Note *** | -0.04Note * | -0.09Note ** |
| Age | 0.08Note *** | 0.05Note *** | 0.04Note *** | 0.04Note *** |
| Age square /100 | -0.09Note *** | -0.05Note *** | -0.04Note *** | -0.03Note *** |
| Education attainment | ||||
| No degree, certificate or diploma | -0.15Note *** | -0.12Note *** | -0.06Note *** | -0.05Note *** |
| High school (reference group) | Note ...: not applicable | Note ...: not applicable | Note ...: not applicable | Note ...: not applicable |
| Postsecondary education below bachelor's degree / Trade | 0.05Note *** | 0.11Note *** | 0.11Note *** | 0.10Note *** |
| Bachelor's degree | 0.07Note *** | 0.23Note *** | 0.21Note *** | 0.17Note *** |
| Above bachelor's degree | 0.06Note *** | 0.38Note *** | 0.33Note *** | 0.26Note *** |
| Official language | ||||
| English (reference group) | Note ...: not applicable | Note ...: not applicable | Note ...: not applicable | Note ...: not applicable |
| French | -0.03Note ** | -0.01Note * | -0.05Note *** | 0.00 |
| English and French | 0.04Note *** | 0.03Note *** | 0.01Note * | 0.02Note * |
| Neither English nor French | -0.65Note * | -0.05 | -0.35Note *** | 0.00 |
| Census family status | ||||
| Married or common-law without children | -0.09Note *** | -0.11Note *** | -0.12Note *** | -0.09Note *** |
| Married or common-law with children (reference group) | Note ...: not applicable | Note ...: not applicable | Note ...: not applicable | Note ...: not applicable |
| Lone parent | -0.07Note *** | -0.10Note *** | -0.15Note *** | -0.12Note *** |
| Child in a census family | -0.26Note *** | -0.33Note *** | -0.31Note *** | -0.27Note *** |
| Person living alone | -0.08Note *** | -0.13Note *** | -0.14Note *** | -0.11Note *** |
| Person not in a census family but live with others | -0.23Note *** | -0.28Note *** | -0.29Note *** | -0.25Note *** |
| Province of residence | ||||
| Newfoundland and Labrador | -0.05Note *** | 0.19Note *** | 0.14Note *** | 0.03Note * |
| Prince Edward Island | -0.18Note *** | -0.28Note *** | -0.16Note *** | -0.10Note *** |
| Nova Scotia | -0.06Note *** | -0.09Note *** | -0.12Note *** | -0.10Note *** |
| New Brunswick | -0.12Note *** | -0.12Note *** | -0.09Note *** | -0.07Note *** |
| Quebec | -0.15Note *** | -0.09Note *** | -0.13Note *** | -0.15Note *** |
| Ontario (reference group) | Note ...: not applicable | Note ...: not applicable | Note ...: not applicable | Note ...: not applicable |
| Manitoba | -0.06Note *** | 0.02Note * | 0.00 | 0.06Note *** |
| Saskatchewan | 0.04Note *** | 0.18Note *** | 0.21Note *** | 0.21Note *** |
| Alberta | 0.13Note *** | 0.31Note *** | 0.29Note *** | 0.27Note *** |
| British Columbia | -0.01 | 0.14Note *** | 0.12Note *** | 0.09Note *** |
| Territories | 0.32Note *** | 0.26Note *** | 0.18Note *** | 0.23Note *** |
| Census metropolitan area of residence | ||||
| Montréal | 0.00 | 0.01 | 0.04Note *** | 0.05Note *** |
| Toronto | 0.04Note *** | 0.08Note *** | 0.06Note *** | 0.09Note *** |
| Vancouver | -0.02Note * | -0.02Note ** | -0.05Note *** | 0.00 |
| Medium-size census metropolitian area | 0.03Note *** | -0.07Note *** | -0.03Note *** | 0.00 |
| Small size census metropolitan area | -0.02Note *** | -0.08Note *** | -0.05Note *** | -0.02Note *** |
| Not in a census metropolitan area (reference group) | Note ...: not applicable | Note ...: not applicable | Note ...: not applicable | Note ...: not applicable |
| Occupations | ||||
| Management (reference group) | Note ...: not applicable | Note ...: not applicable | Note ...: not applicable | Note ...: not applicable |
| Professional occupations | -0.23Note *** | -0.13Note *** | -0.16Note *** | -0.02Note * |
| Technical and paraprofessional occupations | -0.08Note *** | -0.21Note *** | -0.29Note *** | -0.16Note *** |
| Administration and administrative support | -0.33Note *** | -0.37Note *** | -0.41Note *** | -0.21Note *** |
| Sales | -0.47Note *** | -0.33Note *** | -0.28Note *** | -0.16Note *** |
| Personal and customer information services | -0.42Note *** | -0.48Note *** | -0.54Note *** | -0.39Note *** |
| Industrial, construction and equipment operation trades | -0.22Note *** | -0.12Note *** | -0.22Note *** | -0.09Note *** |
| Workers and labourers in transport and construction | -0.34Note *** | -0.28Note *** | -0.35Note *** | -0.17Note *** |
| Natural resources, agriculture and related production occupations | -0.39Note *** | -0.06Note *** | -0.22Note *** | -0.14Note *** |
| Occupations in manufacturing and utilities | -0.30Note *** | -0.21Note *** | -0.40Note *** | -0.26Note *** |
| Full-time part-time status | 0.76Note *** | 0.64Note *** | 0.62Note *** | 0.59Note *** |
| Industry groupsAppendix Table 4 Note 1 | ||||
| Mining, oil and gas and utilities | Note ...: not applicable | 0.40Note *** | 0.55Note *** | 0.37Note *** |
| Construction | Note ...: not applicable | 0.21Note *** | 0.21Note *** | 0.03Note *** |
| Manufacturing (reference group) | Note ...: not applicable | Note ...: not applicable | Note ...: not applicable | Note ...: not applicable |
| Transport, warehousing, wholesale, and other | Note ...: not applicable | -0.06Note *** | 0.02Note *** | 0.02Note ** |
| Business services | Note ...: not applicable | 0.00 | 0.13Note *** | 0.10Note *** |
| Consumer services | Note ...: not applicable | -0.29Note *** | -0.19Note *** | -0.15Note *** |
| Unknown | Note ...: not applicable | 0.02 | 0.07Note *** | -0.11Note *** |
| Unionization | 0.12Note *** | 0.01Note *** | 0.11Note *** | 0.23Note *** |
| Constant | 4.80Note *** | 5.55Note *** | 5.62Note *** | 5.52Note *** |
| R-squared | 0.32 | 0.43 | 0.38 | 0.25 |
... not applicable
Sample includes non-Indigenous persons aged 25 to 44, who were born in Canada, who had at least one week of paid employment and $500 in earnings in 2015, and were not self-employed that year. Sources: Statistics Canada, 2016 Census and 2015 T4-LEAP file. |
||||
| Non-commercial sector | Large commercial sector firms | Medium commercial sector firms | Small commercial sector firms | |
|---|---|---|---|---|
| coefficient | ||||
| Women | ||||
| Visible minority status | ||||
| White (reference group) | Note ...: not applicable | Note ...: not applicable | Note ...: not applicable | Note ...: not applicable |
| South Asian | 0.02Note * | 0.01 | 0.00 | -0.01 |
| Chinese | 0.08Note *** | 0.05Note *** | 0.06Note *** | 0.03 |
| Black | 0.02Note ** | -0.07Note *** | -0.11Note *** | -0.08Note *** |
| Filipino | 0.09Note *** | 0.00 | -0.01 | -0.02 |
| Latin American | -0.01 | -0.05Note * | -0.03 | 0.01 |
| Southeast Asian | 0.06Note ** | 0.00 | 0.05 | 0.03 |
| Arab/West Asian | -0.01 | 0.00 | 0.03 | -0.05 |
| Korean/Japanese | 0.00 | 0.03 | 0.08Note ** | -0.02 |
| Other | 0.04Note * | -0.04Note ** | -0.03 | -0.02 |
| Age | 0.08Note *** | 0.08Note *** | 0.06Note *** | 0.04Note *** |
| Age square /100 | -0.09Note *** | -0.08Note *** | -0.05Note *** | -0.03Note *** |
| Education attainment | ||||
| No degree, certificate or diploma | -0.15Note *** | -0.16Note *** | -0.09Note *** | -0.08Note *** |
| High school (reference group) | Note ...: not applicable | Note ...: not applicable | Note ...: not applicable | Note ...: not applicable |
| Postsecondary education below bachelor's degree / Trade | 0.10Note *** | 0.05Note *** | 0.07Note *** | 0.07Note *** |
| Bachelor's degree | 0.22Note *** | 0.24Note *** | 0.22Note *** | 0.18Note *** |
| Above bachelor's degree | 0.24Note *** | 0.34Note *** | 0.31Note *** | 0.26Note *** |
| Official language | ||||
| English (reference group) | Note ...: not applicable | Note ...: not applicable | Note ...: not applicable | Note ...: not applicable |
| French | -0.03Note *** | -0.04Note *** | -0.06Note *** | -0.02 |
| English and French | 0.02Note *** | 0.05Note *** | 0.03Note *** | 0.02 |
| Neither English nor French | -0.41 | 0.02 | -0.18 | -0.93 |
| Census family status | ||||
| Married or common-law without children | 0.05Note *** | 0.04Note *** | 0.06Note *** | 0.05Note *** |
| Married or common-law with children (reference group) | Note ...: not applicable | Note ...: not applicable | Note ...: not applicable | Note ...: not applicable |
| Lone parent | -0.03Note *** | -0.07Note *** | -0.07Note *** | -0.07Note *** |
| Child in a census family | -0.06Note *** | -0.07Note *** | -0.04Note *** | -0.05Note *** |
| Person living alone | 0.08Note *** | 0.06Note *** | 0.09Note *** | 0.07Note *** |
| Person not in a census family but live with others | -0.04Note *** | -0.05Note *** | -0.05Note *** | -0.03Note *** |
| Province of residence | ||||
| Newfoundland and Labrador | -0.05Note *** | 0.04Note ** | 0.03Note * | 0.01 |
| Prince Edward Island | -0.14Note *** | -0.18Note *** | -0.12Note *** | -0.07Note ** |
| Nova Scotia | -0.12Note *** | -0.08Note *** | -0.08Note *** | -0.08Note *** |
| New Brunswick | -0.13Note *** | -0.11Note *** | -0.08Note *** | -0.04Note ** |
| Quebec | -0.14Note *** | -0.07Note *** | -0.03Note *** | -0.06Note *** |
| Ontario (reference group) | Note ...: not applicable | Note ...: not applicable | Note ...: not applicable | Note ...: not applicable |
| Manitoba | -0.04Note *** | 0.01 | 0.00 | 0.06Note *** |
| Saskatchewan | 0.08Note *** | 0.12Note *** | 0.16Note *** | 0.15Note *** |
| Alberta | 0.12Note *** | 0.22Note *** | 0.21Note *** | 0.18Note *** |
| British Columbia | -0.04Note *** | 0.08Note *** | 0.07Note *** | 0.04Note *** |
| Territories | 0.34Note *** | 0.30Note *** | 0.33Note *** | 0.28Note *** |
| Census metropolitan area of residence | ||||
| Montréal | 0.00 | 0.11Note *** | 0.08Note *** | 0.08Note *** |
| Toronto | 0.02Note *** | 0.19Note *** | 0.16Note *** | 0.13Note *** |
| Vancouver | 0.01 | 0.11Note *** | 0.08Note *** | 0.07Note *** |
| Medium-size census metropolitan area | 0.04Note *** | 0.07Note *** | 0.05Note *** | 0.06Note *** |
| Smalll-size census metropolitan area | 0.00 | 0.02Note ** | 0.00 | 0.02Note ** |
| Not in a census metropolitan area (reference group) | Note ...: not applicable | Note ...: not applicable | Note ...: not applicable | Note ...: not applicable |
| Occupations | ||||
| Management (reference group) | Note ...: not applicable | Note ...: not applicable | Note ...: not applicable | Note ...: not applicable |
| Professional occupations | -0.14Note *** | -0.09Note *** | -0.08Note *** | 0.04Note ** |
| Technical and paraprofessional occupations | -0.26Note *** | -0.23Note *** | -0.27Note *** | -0.13Note *** |
| Administration and administrative support | -0.36Note *** | -0.32Note *** | -0.31Note *** | -0.15Note *** |
| Sales | -0.52Note *** | -0.34Note *** | -0.35Note *** | -0.27Note *** |
| Personal and customer information services | -0.52Note *** | -0.44Note *** | -0.47Note *** | -0.34Note *** |
| Industrial, construction and equipment operation trades | -0.24Note *** | -0.10Note *** | -0.23Note *** | -0.13Note *** |
| Workers and labourers in transport and construction | -0.42Note *** | -0.31Note *** | -0.37Note *** | -0.28Note *** |
| Natural resources, agriculture and related production occupations | -0.48Note *** | -0.23Note *** | -0.34Note *** | -0.31Note *** |
| Occupations in manufacturing and utilities | -0.34Note *** | -0.31Note *** | -0.43Note *** | -0.28Note *** |
| Full-time part-time status | 0.53Note *** | 0.65Note *** | 0.59Note *** | 0.55Note *** |
| Industry groupsAppendix Table 5 Note 1 | ||||
| Mining, oil and gas and utilities | Note ...: not applicable | 0.35Note *** | 0.43Note *** | 0.42Note *** |
| Construction | Note ...: not applicable | 0.08Note *** | 0.12Note *** | 0.11Note *** |
| Manufacturing (reference group) | Note ...: not applicable | Note ...: not applicable | Note ...: not applicable | Note ...: not applicable |
| Transport, warehousing, wholesale, and other | Note ...: not applicable | -0.12Note *** | -0.04Note *** | 0.04Note ** |
| Business services | Note ...: not applicable | -0.06Note *** | 0.04Note *** | 0.09Note *** |
| Consumer services | Note ...: not applicable | -0.37Note *** | -0.24Note *** | -0.14Note *** |
| Unknown | Note ...: not applicable | -0.15Note *** | -0.04Note * | -0.08Note *** |
| Unionization | 0.22Note *** | 0.08Note *** | 0.05Note *** | 0.13Note *** |
| Constant | 4.69Note *** | 4.75Note *** | 4.97Note *** | 5.15Note *** |
| R-squared | 0.31 | 0.44 | 0.38 | 0.29 |
... not applicable
Notes: LEAP = Longitudinal Employment Analysis Program. |
||||
References
Banerjee, R., Reitz, J.G., & Oreopoulos, P. (2018). Do Large Employers Treat Racial Minorities More Fairly? An Analysis of Canadian Field Experiment Data. Canadian Public Policy. (March), 1–12.
Barbulescu, R., & Bidwell, M. 2013. Do Women Choose Different Jobs from Men? Mechanisms of Application Segregation in the Market for Managerial Workers. Organization Science, 24(3): 737–756.
Dobbin, F., Schrage, D., & Kalev, A. (2015). Rage against the Iron Cage: The Varied Effects of Bureaucratic Personnel Reforms on Diversity. American Sociological Review, 80(5), 1014–1044
Hou, F., & Coulombe, S. (2010). Earnings gaps for Canadian-born visible minority groups in the public and private sectors. Canadian Public Policy, 36(1), 29–43.
Oreopoulos, P. (2011). Why Do Skilled Immigrants Struggle in the Labor Market? A Field Experiment with Thirteen Thousand Resumes. American Economic Journal: Economic Policy, 3(4), 148–171.
Qiu, H. & Schellenberg, G. (2022). The weekly earnings of Canadian-born individuals in designated visible minority and White categories in the mid-2010s. Economic and Social Reports.
Statistics Canada. (2017). Census of Population Reference Guide: Visible Minority and Population Group Reference Guide. Statistics Canada catalogue no. 98-500-X2016006.
Statistics Canada. (2021a). Table 14-10-0335-01 Labour force characteristics by occupation, annual [Data table]. https://doi.org/10.25318/1410033501-eng.
Statistics Canada. (2021b). Table 14-10-0133-01 Union status by establishment size [Data table]. https://doi.org/10.25318/1410013301-eng.
- Date modified: