
The transition from school to work - the NEET (not in employment, education or training) indicator for 25- to 29-year-old women and men in Canada

Archived Content
Information identified as archived is provided for reference, research or recordkeeping purposes. It is not subject to the Government of Canada Web Standards and has not been altered or updated since it was archived. Please "contact us" to request a format other than those available.
by Sylvie Brunet
Start of text box
Highlights
- In 2017/2018, 73% of young Canadians aged 25 to 29 were out of school and employed, 12% were still in school and 15%, or 376,000 individuals, were not in employment, education or training (NEET). Two-thirds of the 376,000 NEET youth were inactive (not looking for work) while one-third were unemployed.
- NEET rates increase with age. Young Canadians aged 25 to 29 years had a higher NEET rate (15%) than 15- to 19-year-olds (5%) and 20- to 24-year-olds (13%); the age groups traditionally used to study the transition of young adults from education to the labour market. The higher rate observed for this age group is also observed for the Organisation for Economic Co-operation and Development (OECD) average.
- As observed in all OECD countries, with the exception of Portugal, women are more likely than men to belong to the inactive NEET category (also referred to as 'not in the labour force'). The highest NEET rate for the 25-to-29 age group is due to a high proportion of inactive NEET women. This higher inactive rate appears to be related to motherhood.
- The presence of children in the household is associated with a considerably higher NEET rate for women aged 25 to 29 years but the same is not true for men in the same age group.
- In 2017/2018, 72% of the 246,700 inactive NEET individuals aged 25 to 29 said they did not want a job.
- The higher the education level, the lower the NEET rate among 25- to 29-year-olds. NEET rates are especially high for women with a high school diploma or less. However, once postsecondary education is attained, there is little variation in the NEET rate amongst individuals with various levels of postsecondary education.
- Among Canadians between 25 and 29 years of age, it was observed that young NEETs were more likely than young employed people or students to have a partner who was also in NEET. This could lead to a precarious income situation for households in which there are no employed adults.
End of text box
Introduction
Young people who are not studying, in training or working make up what is known as the 'NEET' group (not in education, employment or training). The NEET indicator has been regularly published by the Organisation for Economic Co-operation and Development (OECD) since the late 1990s, as NEET youth are considered to be potentially at risk for economic and social difficulties (Statistics Canada and CMEC 2016).
This fact sheet focuses on young NEET Canadians aged 25 to 29 years old. It is the second of three fact sheets that examines the three traditional age groups that are usually considered for studying the transition from school to work (15- to 19-year-olds, 20- to 24-year-olds, and 25- to 29-year-olds).Note 1 The relationships of these three age groups with the labour market and education are very different: most 15- to 19-year-olds are still in school, 20- to 24-year-olds have begun their transition from school to the labour force while those aged 25 to 29 are mainly employed. As a result, the reasons for young people to be in the NEET population will partly depend on their age group.
There are two sub-categories within the NEET population. The unemployed sub-category includes those who are actively seeking work. Unemployment may be the result of difficult economic conditions or related to inadequate training to meet labour market needs. The second sub-category comprises young adults not in the labour force (also known as inactive adults) and who are not seeking employment for various reasons. This can include young people who are discouraged because they have not been able to find work and have dropped out of the labour force. It can also include individuals permanently unable to work, looking after family, travelling, volunteering or who have arrangements to start a job sometime in the future.Note 2
Understanding and monitoring the NEET rate of young adults is important as it may be an indicator of potential problems in certain systems (education, labour market) or social trends among young adults, such as a change in the relative importance of work compared with time devoted to the family, travel, volunteering, or other activities.
Young NEET adults have been the subject of significant study (Statistics Canada and CMEC, 2018; Marshall, 2012; OECD, 2017; The Institut de la statistique du Québec, 2013). This fact sheet, which uses recent 2017/2018 data from the Labour Force SurveyNote 3 (LFS), is different due to the specific age group it is studying—25 to 29 years—and to its interprovincial comparisons. It explores in-depth gender-based differences, the effect of young Canadians' highest level of education, as well as the impact of children in households.
In 2017/2018, 15% of 25- to 29-year-old Canadians were NEET
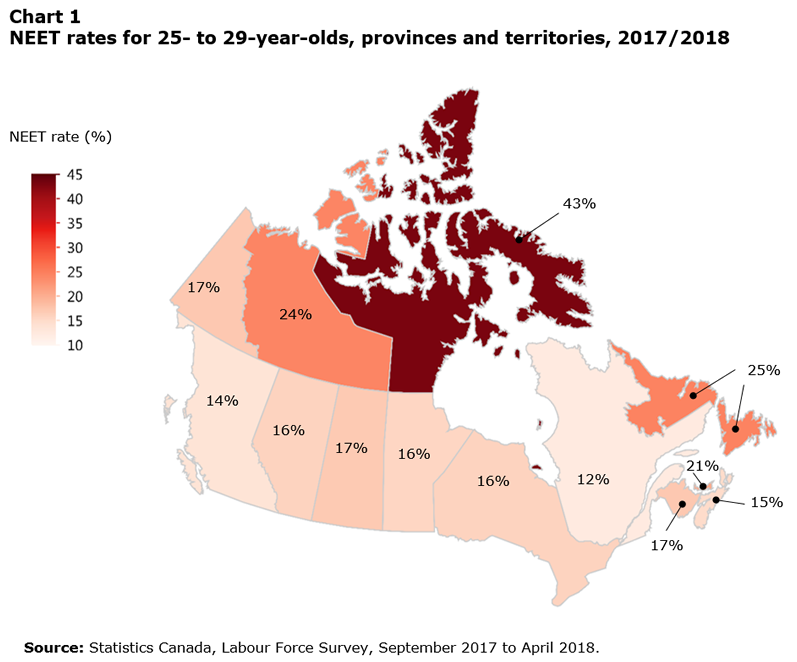
Data table for Chart 1
| NEET rate (%) | |
|---|---|
| N.L. | 25 |
| P.E.I. | 21 |
| N.S. | 15 |
| N.B. | 17 |
| Que. | 12 |
| Ont. | 16 |
| Man. | 16 |
| Sask. | 17 |
| Alta. | 16 |
| B.C. | 14 |
| Y.T. | 17 |
| N.W.T. | 24 |
| Nvt. | 43 |
| Source: Statistics Canada, Labour Force Survey, September 2017 to April 2018. | |
In 2017/2018, 73% of young Canadians aged 25 to 29 years were no longer in school and were working, while only 12% were still in school. The remaining 15%, representing 376,000 Canadians, were young NEET adults. The NEET rates in most provinces (Chart 1) were similar to the Canadian average (15%) except for Newfoundland and Labrador and Prince Edward Island,Note 4 where they were significantly higher (25% and 21%) and for QuebecNote 5 where it was significantly lower (12 %). In the territories,Note 6 NEET rates were higher than the Canadian average in Nunavut (43%) and the Northwest Territories (24%). It should be noted that in Canada, few young adults tend to remain in a NEET situation for long (LaRochelle-Côté, 2013).Note 7
In Canada and for the OECD average, 25- to 29-year-olds have the highest NEET rates
Data table for Chart 2
| Year | Canada, 15- to 19-year-olds | Canada, 20- to 24-year-olds | Canada, 25- to 29-year-olds | OECD, 15- to 19-year-olds | OECD, 20- to 24-year-olds | OECD, 25- to 29-year-olds |
|---|---|---|---|---|---|---|
| percent | ||||||
| 1998 | 9 | 18 | 19 | 10 | 19 | 20 |
| 1999 | 8 | 16 | 18 | 9 | 17 | 19 |
| 2000 | 8 | 16 | 17 | 9 | 18 | 19 |
| 2001 | 7 | 16 | 16 | 9 | 16 | 18 |
| 2002 | 8 | 15 | 18 | 8 | 17 | 19 |
| 2003 | 8 | 14 | 16 | 8 | 17 | 19 |
| 2004 | 9 | 14 | 16 | 8 | 17 | 19 |
| 2005 | 7 | 14 | 16 | 8 | 17 | 19 |
| 2006 | 7 | 13 | 16 | 8 | 17 | 18 |
| 2007 | 7 | 14 | 15 | 7 | 15 | 17 |
| 2008 | 7 | 13 | 15 | 8 | 16 | 17 |
| 2009 | 8 | 16 | 16 | 8 | 18 | 20 |
| 2010 | 8 | 16 | 17 | 8 | 19 | 20 |
| 2011 | 8 | 15 | 17 | 8 | 18 | 20 |
| 2012 | 7 | 15 | 17 | 7 | 18 | 19 |
| 2013 | 7 | 14 | 16 | 7 | 18 | 20 |
| 2014 | 7 | 15 | 18 | 7 | 17 | 20 |
| 2015 | 7 | 14 | 18 | 6 | 17 | 19 |
| 2016 | 6 | 15 | 17 | 6 | 16 | 19 |
| 2017 | 6 | 13 | 16 | 6 | 15 | 18 |
| 2018 | 6 | 13 | 15 | Note ..: not available for a specific reference period | Note ..: not available for a specific reference period | Note ..: not available for a specific reference period |
|
.. not available for a specific reference period Notes: OECD data for 2018 were not available when this document was published. Labour Force Survey (LFS) estimates for Canada are derived using the results of the LFS in the provinces; the territories are not included. NEET rates were calculated using the average of the first three months of the calendar year. Sources: Statistics Canada, Labour Force Survey, OECD, Education at a Glance, 1998/2018. |
||||||
The trend for 25- to 29-year-olds having a higher NEET rate than the other age groups is observed year after year in Canada as well as for the average NEET rates of OECD countries (Chart 2). Since NEET rates are in part tied to the economic situation in countries, an increase in these rates can be observed after the 2008 recession, particularly for the 20-to-24 and 25-to-29 age groups, who for the most part had completed their studies and made their transition to the labour force. OECD average NEET rates are higher than Canadian averages, with the exception of the 15-to-19 age group for which the Canadian and OECD average are similar.
Among NEET young adults 25 to 29 years, women are more likely to be inactive than men, while men are more likely to be unemployed than women
Data table for Chart 3
| Women - NEET inactive | Women - NEET unemployed | Men - NEET inactive | Men - NEET unemployed | |||||||||
|---|---|---|---|---|---|---|---|---|---|---|---|---|
| percent | confidence interval down | confidence interval up | percent | confidence interval down | confidence interval up | percent | confidence interval down | confidence interval up | percent | confidence interval down | confidence interval up | |
| Canada | 12 | 1 | 1 | 4 | 1 | 1 | 7 | 1 | 1 | 6 | 1 | 1 |
| N.L. | 16 | 4 | 5 | 7 | 2 | 3 | 11 | 3 | 4 | 16 | 4 | 5 |
| P.E.I. | 12 | 4 | 5 | 11 | 4 | 6 | 7 | 3 | 4 | 11 | 4 | 5 |
| N.S. | 11 | 3 | 4 | 3 | 1 | 2 | 7 | 2 | 3 | 9 | 2 | 3 |
| N.B. | 14 | 3 | 4 | 5 | 2 | 3 | 6 | 2 | 3 | 9 | 3 | 3 |
| Que. | 9 | 2 | 2 | 4 | 1 | 1 | 6 | 2 | 2 | 5 | 1 | 1 |
| Ont. | 13 | 2 | 2 | 4 | 1 | 1 | 8 | 1 | 1 | 6 | 1 | 1 |
| Man. | 15 | 2 | 2 | 4 | 1 | 1 | 7 | 2 | 2 | 5 | 1 | 1 |
| Sask. | 15 | 3 | 3 | 5 | 1 | 2 | 7 | 2 | 2 | 8 | 2 | 2 |
| Alta. | 15 | 3 | 3 | 5 | 1 | 1 | 6 | 2 | 2 | 6 | 1 | 2 |
| B.C. | 12 | 2 | 2 | 3 | 1 | 1 | 7 | 2 | 2 | 5 | 1 | 2 |
|
Notes: Labour Force Survey (LFS) estimates for Canada are derived using the results of the LFS in the provinces; the territories are not included. Source: Statistics Canada, Labour Force Survey, September 2017 to April 2018. |
||||||||||||
It is informative to study the gender differences of NEET youth aged 25 to 29 and to study, whenever possible, two subgroups within each gender: the inactive (those who are not looking for work) and the unemployed (those who are actively seeking work).Note 8 As shown in Chart 3, in Canada, women are more likely to be inactive NEETs than men (12% compared to 7%) while men are more likely to be unemployed NEETs than women (6% compared to 4%).Note 9
In Canada and in all provinces, there is not a significant difference between the unemployed and inactive NEET rates for men. Conversely, in all provinces except Prince Edward Island, where the difference is not significant, women have higher inactive NEET rates than unemployed NEET rates.
Start of text box
How do the NEET rates of 25- to 29-year-olds compare between Canada and other OECD countries?
In 2017, the NEET rate of 25- to 29-year-olds in Canada (16%)Note 10 ranked 15th out of the 32 countriesNote 11 that reported data to the OECD that year. The countries with the lowest NEET rates were Iceland and Sweden (5% and 9% respectively), while the countries with the highest NEET rates were Spain, Mexico, Italy, Turkey and Greece, with rates ranging from 27% to 35%.
Furthermore, in the 25-to-29 age group, all OECD countries, with the exception of Portugal, reported higher inactive NEET rates for women than for men in 2017. In Canada, the inactive NEET rate for women (13%) was considerably higher than that of men (8%). Although this gap between women and men is notable, Canada ranked 3rd out of 32 countries for the smallest gender gap. The two countries with smaller gender gaps than Canada were Portugal and Norway. The countries with the greatest gender gaps in inactive NEET rates were the Czech Republic, the Slovak Republic, Turkey and Mexico, where the rates were between 9 to 11 times higher for women than men. The Canadian inactive NEET rate for women (13%) was slightly lower than the OECD country average (16%). Conversely, Canada's inactive NEET rate for men (8%) was the fourth highest of OECD countries (where the average was 5%), after Italy (13%) as well as Belgium and the United States which had rates slightly above 8%. The relatively small gender gap in Canada was therefore not due to a particularly low inactive NEET rate for Canadian women, but rather a high inactive NEET rate for men.
As for unemployed NEET rates for 25- to 29-year-olds in 2017, Canada had the second largest gender gap of all OECD countries, with a rate twice as high for men (8%) as for women (4%). Among other OECD countries, the male-female ratio for the unemployed NEET rate ranged from 0.5 in Slovenia to 2.2 in Lithuania.
End of text box
In 2017/2018, more than 7 out of 10 inactive NEETs said they did not want to work
As a general rule, unemployed NEET rates are connected to the economic situation of a province or a country. However, inactive NEET rates can be linked to social conditions and some individuals in this category could be stigmatized or discouraged if their inactivity is not completely of their choice. Thus, it is interesting to understand why these 246,700 inactive NEET individuals, who represent 10% of Canadians aged 25 to 29, are not in school, not working and are not looking for work. LFS data do provide some insights on this.
In 2017/2018, there were more women than men who were inactive NEETs (Table A3.1). Almost one in 10 inactive NEET individuals was permanently unable to work, with a higher proportion among men (16%) than women (5%).
There were more than 7 out of 10 inactive NEET young people who said that they did not want work and this proportion was higher among women (81%) than men (56%). However, LFS data do not provide detailed reasons for the inactivity of these inactive NEET young people who do not want a job.
On the other hand, 14% of inactive NEET individuals said they wanted a job, with a higher proportion for men than women. The reasons given for not looking for work were the following: discouragement (1%), illness (3%), caring for children, the elderly or other personal or family responsibilities (4%), waiting for a call-back from an employer (2%) and another reason/no reason given (4%).
The high NEET rate for 25- to 29-year-olds is due to a high proportion of inactive NEET women
Data table for Chart 4
| Age | Women - NEET inactive | Women - NEET unemployed | Men - NEET inactive | Men - NEET unemployed | ||||||||
|---|---|---|---|---|---|---|---|---|---|---|---|---|
| percent | confidence interval down | confidence interval up | percent | confidence interval down | confidence interval up | percent | confidence interval down | confidence interval up | percent | confidence interval down | confidence interval up | |
| 15 | 2 | 1 | 1 | Note x: suppressed to meet the confidentiality requirements of the Statistics Act | Note x: suppressed to meet the confidentiality requirements of the Statistics Act | Note x: suppressed to meet the confidentiality requirements of the Statistics Act | 3 | 1 | 1 | Note x: suppressed to meet the confidentiality requirements of the Statistics Act | Note x: suppressed to meet the confidentiality requirements of the Statistics Act | Note x: suppressed to meet the confidentiality requirements of the Statistics Act |
| 16 | 2 | 1 | 1 | Note x: suppressed to meet the confidentiality requirements of the Statistics Act | Note x: suppressed to meet the confidentiality requirements of the Statistics Act | Note x: suppressed to meet the confidentiality requirements of the Statistics Act | 2 | 1 | 1 | Note x: suppressed to meet the confidentiality requirements of the Statistics Act | Note x: suppressed to meet the confidentiality requirements of the Statistics Act | Note x: suppressed to meet the confidentiality requirements of the Statistics Act |
| 17 | 3 | 1 | 1 | Note x: suppressed to meet the confidentiality requirements of the Statistics Act | Note x: suppressed to meet the confidentiality requirements of the Statistics Act | Note x: suppressed to meet the confidentiality requirements of the Statistics Act | 3 | 1 | 1 | 1 | 1 | 1 |
| 18 | 4 | 1 | 1 | 3 | 1 | 1 | 6 | 1 | 1 | 5 | 1 | 1 |
| 19 | 5 | 1 | 1 | 3 | 1 | 1 | 6 | 1 | 1 | 5 | 1 | 1 |
| 20 | 7 | 2 | 2 | 3 | 1 | 1 | 7 | 1 | 2 | 6 | 1 | 1 |
| 21 | 7 | 1 | 2 | 3 | 1 | 1 | 6 | 1 | 1 | 6 | 1 | 1 |
| 22 | 10 | 2 | 2 | 3 | 1 | 1 | 7 | 1 | 1 | 6 | 1 | 1 |
| 23 | 8 | 1 | 2 | 4 | 1 | 1 | 6 | 1 | 2 | 7 | 1 | 2 |
| 24 | 9 | 2 | 2 | 5 | 1 | 1 | 7 | 1 | 2 | 6 | 1 | 2 |
| 25 | 11 | 2 | 2 | 4 | 1 | 1 | 8 | 1 | 2 | 8 | 1 | 1 |
| 26 | 11 | 2 | 2 | 4 | 1 | 1 | 9 | 2 | 2 | 7 | 1 | 1 |
| 27 | 13 | 2 | 2 | 4 | 1 | 1 | 6 | 1 | 2 | 7 | 1 | 2 |
| 28 | 12 | 2 | 2 | 5 | 1 | 1 | 6 | 1 | 2 | 5 | 1 | 1 |
| 29 | 14 | 2 | 2 | 4 | 1 | 1 | 7 | 1 | 2 | 4 | 1 | 1 |
| 30 | 15 | 2 | 2 | 4 | 1 | 1 | 6 | 1 | 2 | 6 | 1 | 2 |
| 31 | 17 | 2 | 2 | 3 | 1 | 1 | 7 | 1 | 2 | 5 | 1 | 1 |
| 32 | 15 | 2 | 2 | 3 | 1 | 1 | 5 | 1 | 1 | 4 | 1 | 1 |
| 33 | 16 | 2 | 2 | 4 | 1 | 1 | 7 | 1 | 2 | 4 | 1 | 1 |
| 34 | 18 | 2 | 2 | 4 | 1 | 1 | 8 | 2 | 2 | 5 | 1 | 1 |
| 35 | 17 | 2 | 2 | 4 | 1 | 1 | 7 | 1 | 2 | 4 | 1 | 1 |
| 36 | 15 | 2 | 2 | 4 | 1 | 1 | 5 | 1 | 1 | 4 | 1 | 1 |
| 37 | 16 | 2 | 2 | 3 | 1 | 1 | 7 | 1 | 2 | 4 | 1 | 1 |
| 38 | 17 | 2 | 2 | 4 | 1 | 1 | 7 | 2 | 2 | 5 | 1 | 1 |
| 39 | 16 | 2 | 2 | 3 | 1 | 1 | 7 | 2 | 2 | 4 | 1 | 1 |
| 40 | 13 | 2 | 2 | 3 | 1 | 1 | 5 | 1 | 1 | 4 | 1 | 1 |
| 41 | 14 | 2 | 2 | 4 | 1 | 1 | 6 | 1 | 2 | 4 | 1 | 1 |
| 42 | 16 | 2 | 2 | 4 | 1 | 1 | 6 | 1 | 2 | 4 | 1 | 1 |
| 43 | 14 | 2 | 2 | 5 | 1 | 2 | 8 | 1 | 2 | 4 | 1 | 1 |
| 44 | 15 | 2 | 2 | 3 | 1 | 1 | 8 | 2 | 2 | 4 | 1 | 1 |
| 45 | 15 | 2 | 2 | 4 | 1 | 1 | 8 | 2 | 2 | 5 | 1 | 1 |
| 46 | 16 | 2 | 2 | 4 | 1 | 1 | 8 | 2 | 2 | 4 | 1 | 1 |
| 47 | 14 | 2 | 2 | 4 | 1 | 1 | 9 | 2 | 2 | 5 | 1 | 1 |
| 48 | 14 | 2 | 2 | 4 | 1 | 1 | 9 | 2 | 2 | 5 | 1 | 1 |
| 49 | 14 | 2 | 2 | 4 | 1 | 1 | 11 | 2 | 2 | 4 | 1 | 1 |
| 50 | 17 | 2 | 2 | 3 | 1 | 1 | 10 | 2 | 2 | 3 | 1 | 1 |
| 51 | 16 | 2 | 2 | 3 | 1 | 1 | 9 | 1 | 2 | 5 | 1 | 1 |
| 52 | 17 | 2 | 2 | 3 | 1 | 1 | 10 | 2 | 2 | 4 | 1 | 1 |
| 53 | 18 | 2 | 2 | 3 | 1 | 1 | 11 | 2 | 2 | 4 | 1 | 1 |
| 54 | 18 | 2 | 2 | 3 | 1 | 1 | 12 | 2 | 2 | 4 | 1 | 1 |
| 55 | 24 | 2 | 2 | 4 | 1 | 1 | 16 | 2 | 2 | 5 | 1 | 1 |
| 56 | 25 | 2 | 3 | 3 | 1 | 1 | 16 | 2 | 2 | 4 | 1 | 1 |
| 57 | 26 | 3 | 3 | 3 | 1 | 1 | 20 | 2 | 3 | 5 | 1 | 1 |
| 58 | 29 | 3 | 3 | 3 | 1 | 1 | 22 | 2 | 2 | 5 | 1 | 1 |
| 59 | 35 | 3 | 3 | 3 | 1 | 1 | 27 | 3 | 3 | 6 | 1 | 1 |
| 60 | 42 | 3 | 3 | 3 | 1 | 1 | 31 | 3 | 3 | 5 | 1 | 1 |
|
x suppressed to meet the confidentiality requirements of the Statistics Act Notes: Vertical lines at 25 and 29 years old have been added to highlight the age group of interest for this factsheet. Labour Force Survey (LFS) estimates for Canada are derived using the results of the LFS in the provinces; the territories are not included. Unemployed NEET rates for women aged 15, 16 and 17, as well as for men aged 15 and 16 were suppressed to meet the confidentiality requirements of the Statistics Act. Source: Statistics Canada, Labour Force Survey, September 2017 to April 2018. |
||||||||||||
Chart 4 shows that the high NEET rate in the 25-to-29 age group is due to a higher proportion of inactive NEET women compared with the younger age groups, while the rates for three other categories (unemployed NEET women, unemployed or inactive NEET men) remain comparable. Starting at age 27, inactive NEET rates for women are significantly higher than those for men; and these differences tend to continue for older individuals.
The high rate of inactive NEET women between 25 and 29 years is associated with motherhood
Data table for Chart 5
| Women with children - NEET inactive | Women without children - NEET inactive | |||||
|---|---|---|---|---|---|---|
| percent | confidence interval down | confidence interval up | percent | confidence interval down | confidence interval up | |
| Canada | 28 | 2 | 2 | 7 | 1 | 1 |
| N.L. | 33 | 10 | 11 | 8 | 3 | 6 |
| P.E.I. | 28 | 11 | 14 | 7 | 3 | 5 |
| N.S. | 28 | 9 | 12 | 5 | 2 | 3 |
| N.B. | 24 | 6 | 8 | 6 | 2 | 4 |
| Que. | 17 | 4 | 5 | 6 | 2 | 2 |
| Ont. | 31 | 4 | 5 | 8 | 1 | 2 |
| Man. | 33 | 5 | 6 | 6 | 1 | 2 |
| Sask. | 25 | 5 | 5 | 9 | 3 | 4 |
| Alta. | 33 | 6 | 6 | 7 | 2 | 2 |
| B.C. | 33 | 7 | 8 | 7 | 2 | 2 |
|
Notes: Labour Force Survey (LFS) estimates for Canada are derived using the results of the LFS in the provinces; the territories are not included. Source: Statistics Canada, Labour Force Survey, September 2017 to April 2018. |
||||||
There appears to be a link between the high proportion of inactive NEET women between the ages of 25 and 29 and motherhood,Note 12 as having children in the household has a significant impact on inactive NEET rates of women in this age group (Chart 5). The differences observed between women with children and women without children were significant regardless of education level with the exception of women who did not have a high school diploma, where the difference seen is not statistically significant (Chart 6).
Data table for Chart 6
| Highest level of education attained | Women with children - NEET inactive | Women without children - NEET inactive | ||||
|---|---|---|---|---|---|---|
| percent | confidence interval down | confidence interval up | percent | confidence interval down | confidence interval up | |
| All levels of education | 28 | 2 | 2 | 7 | 1 | 1 |
| Less than high school diploma | 53 | 8 | 8 | 42 | 9 | 9 |
| High school diploma | 35 | 4 | 4 | 14 | 2 | 3 |
| Trades diploma | 20 | 5 | 7 | 6 | 2 | 4 |
| College or CEGEP diploma | 20 | 4 | 4 | 5 | 1 | 1 |
| Bachelor's degree | 20 | 5 | 6 | 4 | 1 | 1 |
| Master's or doctoral degree | 22 | 9 | 13 | 5 | 2 | 2 |
|
Notes: Labour Force Survey (LFS) estimates for Canada are derived using the results of the LFS in the provinces; the territories are not included. Source: Statistics Canada, Labour Force Survey, September 2017 to April 2018. |
||||||
Canadian women who have children have an inactive NEET rate nearly four times higher than women without children, a difference of 21 percentage points. A similar situation is observed in each province, with the smallest gap observed in Quebec (11 percentage points) and the largest ones in Manitoba, Alberta and British Columbia (26 percentage points). Quebec's beneficial family policies (Sinha, 2014; Ministère de la Famille et des Aînés, 2011; Findlay and Kohen, 2012) may explain why a smaller gap is observed between these two groups of women in this province.Note 13 More affordable daycare and greater involvement of fathers with their children are likely to encourage young mothers to enter the job market.
Moreover, a large proportion of women between the ages of 25 and 29 start a family. In 2014, 33% of first live births were to mothers between 25 and 29 years, compared with 18% for 20- to 24-year-olds and 5% of 15- to 19-years-olds (Statistics Canada, 2018a). For all live births, 29% were to mothers between 25 and 29. This proportion was half for those in the 20-to-24 age group and one-tenth for 15- to 19-year-olds (Statistics Canada, 2018b).
Children in the household do not affect the inactive NEET rate for men
Contrary to what is observed for women, children in the household do not significantly impact men's inactive NEET rates. Therefore, a significant gender-based difference is observed in inactive NEET rates when there are children in the household. In Ontario and for the national average, the unemployed NEET rate is lower for men with children than for men without children. It is also interesting to note that men and women without children have similar inactive NEET rates and that the presence of children in the household does not change the unemployed NEET rate for women.
Young women between 25 and 29 years with low levels of education have particularly high inactive NEET rates
The 25-to-29 age group makes it possible to study the effect of the highest level of education completed on NEET rates as most of these young people (88%) are no longer in school. The distribution of the highest level of education completed among this group is provided in Table A2.1.

Data table for Chart 7
| Highest level of education attained | Women - NEET unemployed | Women - NEET inactive | Men - NEET unemployed | Men - NEET inactive | ||||||||
|---|---|---|---|---|---|---|---|---|---|---|---|---|
| percent | confidence interval down | confidence interval up | percent | confidence interval down | confidence interval up | percent | confidence interval down | confidence interval up | percent | confidence interval down | confidence interval up | |
| All levels of education | 4 | 1 | 1 | 12 | 1 | 1 | 6 | 1 | 1 | 7 | 1 | 1 |
| Less than high school diploma | 6 | 2 | 2 | 49 | 6 | 6 | 9 | 2 | 3 | 26 | 4 | 5 |
| High school diploma | 5 | 1 | 1 | 21 | 2 | 2 | 8 | 1 | 1 | 10 | 1 | 2 |
| Trades diploma | 6 | 3 | 4 | 12 | 3 | 4 | 9 | 2 | 2 | 4 | 1 | 1 |
| College or CEGEP diploma | 4 | 1 | 1 | 10 | 1 | 2 | 5 | 1 | 1 | 4 | 1 | 1 |
| Bachelor's degree | 4 | 1 | 1 | 6 | 1 | 1 | 4 | 1 | 1 | 3 | 1 | 1 |
| Master's or doctoral degree | 5 | 2 | 2 | 6 | 2 | 2 | 3 | 1 | 2 | 3 | 1 | 2 |
|
Notes: Labour Force Survey (LFS) estimates for Canada are derived using the results of the LFS in the provinces; the territories are not included. Source: Statistics Canada, Labour Force Survey, September 2017 to April 2018. |
||||||||||||
Generally speaking, NEET rates decrease as the highest level of education increases (Chart 7). Women and men with a high school diploma have much lower NEET rates than those who do not. The same holds true if we compare young adults with postsecondary education with those whose highest level of education is high school. This is especially noticeable among inactive NEET individuals whose rates decrease by at least half between each of these levels. However, little variation is observed among the four levels of postsecondary education.
We also observe that for all levels of education, with the exception of master's degrees and doctorates, women have significantly higher inactive NEET rates than men. Inactive NEET rates are especially high for women with a high school diploma or less.
At the provincial level, young adults 25 to 29 years without a postsecondary qualification have high NEET rates
Data table for Chart 8
| High school or less | Trades, college or CEGEP | Bachelor's, master's or doctoral degree | |||||||
|---|---|---|---|---|---|---|---|---|---|
| percent | confidence interval down | confidence interval up | percent | confidence interval down | confidence interval up | percent | confidence interval down | confidence interval up | |
| Canada | 26 | 2 | 2 | 12 | 1 | 1 | 9 | 1 | 1 |
| N.L. | 44 | 8 | 9 | 23 | 5 | 6 | Note x: suppressed to meet the confidentiality requirements of the Statistics Act | Note x: suppressed to meet the confidentiality requirements of the Statistics Act | Note x: suppressed to meet the confidentiality requirements of the Statistics Act |
| P.E.I. | 36 | 8 | 9 | 16 | 5 | 7 | 11 | 4 | 6 |
| N.S. | 27 | 5 | 5 | 9 | 3 | 4 | 9 | 3 | 4 |
| N.B. | 29 | 6 | 6 | 12 | 3 | 4 | 10 | 4 | 6 |
| Que. | 27 | 4 | 5 | 11 | 2 | 2 | 5 | 2 | 2 |
| Ont. | 28 | 3 | 3 | 13 | 2 | 2 | 10 | 2 | 2 |
| Man. | 24 | 3 | 4 | 9 | 2 | 3 | 9 | 2 | 3 |
| Sask. | 27 | 4 | 4 | 11 | 3 | 3 | 8 | 2 | 3 |
| Alta. | 22 | 3 | 4 | 14 | 3 | 3 | 10 | 3 | 4 |
| B.C. | 21 | 3 | 4 | 10 | 2 | 3 | 11 | 2 | 3 |
|
x suppressed to meet the confidentiality requirements of the Statistics Act Notes: Labour Force Survey (LFS) estimates for Canada are derived using the results of the LFS in the provinces; the territories are not included. Data for NEET youth holding a Bachelor's, master's or doctoral degree in N.L. were suppressed to meet the confidentiality requirements of the Statistics Act. Source: Statistics Canada, Labour Force Survey, September 2017 to April 2018. |
|||||||||
At the provincial level, having more than a high school diplomaNote 14 has a significant impact on NEET rates for 25- to 29-year-olds (Chart 8). The difference between those who have and have not completed postsecondary education ranges from 8 percentage points in Alberta to 20 percentage points in Prince Edward Island, while the difference for the Canadian average is 14 percentage points. For all provinces except Quebec, there is no significant difference between the education levels "trade school, college or CEGEP" and "bachelor's degree, master's degree or doctorate".
Birds of a feather flock together
Among young adults between 25 and 29 years of age, it was observed (Chart 9) that a respondent in the NEET category is more likely to have a NEET spouseNote 15 (18%) than a respondent who is not in school and is working (9%) or who is in school (7%).
Data table for Chart 9
| Respondents in education | Respondents not in education, employed | Respondents not in education, unemployed or inactive (NEET) | |||||||
|---|---|---|---|---|---|---|---|---|---|
| percent | confidence interval down | confidence interval up | percent | confidence interval down | confidence interval up | percent | confidence interval down | confidence interval up | |
| Partner in education | 20 | 5 | 6 | 8 | 1 | 1 | 8 | 2 | 2 |
| Partner not in education, employed | 73 | 6 | 5 | 82 | 1 | 1 | 74 | 4 | 3 |
| Partner not in education, unemployed or inactive (NEET) | 7 | 2 | 3 | 9 | 1 | 1 | 18 | 3 | 3 |
|
Notes: Labour Force Survey (LFS) estimates for Canada are derived using the results of the LFS in the provinces; the territories are not included. Numbers may not add up to 100% due to rounding. Source: Statistics Canada, Labour Force Survey, September 2017 to April 2018. |
|||||||||
Similarly, a respondent who is in school is more likely to have a spouse who is also in school (20%) than a respondent who is not in school and is working (8%) or who is in the NEET category (8%).
By the same token, a respondent who is not in school and is working is more likely to have a spouse who also is not in school and is working (82%) than a respondent who is in school (73%) or in the NEET category (74%).
Therefore, although the majority of their spouses are employed, young NEETs are more likely than young working people not in education or students to have a partner who is also in NEET. The effect of these pairings are households that could be at risk as they contain no working adults.
Conclusion
This fact sheet helps us to better understand the situation of young NEET adults aged 25 to 29 in Canada. In 2017/2018, 376,000 or approximately 15% of Canadians aged 25 to 29 were in NEET. The Canadian NEET rate for this age group was slightly below that of the most recent comparable OECD average, which was 18% in 2017. This fact sheet found that young 25- to 29-year-old NEETs are a heterogeneous group which should be studied whenever possible by sex and for the inactive and unemployed sub-groups.
This study indicates that the presence of children in a household considerably increases the inactive NEET rate for women in all provinces. The presence of children does not, however, affect inactive NEET rates for men. In 2017, for 25- to 29-year-olds, in all OECD countries with the exception of Portugal, inactive NEET rates were higher for women than they were for men. It is because of the high inactive NEET rate for women that the NEET rate for Canadians aged 25 to 29 is the highest among the three age groups generally used to study NEETs.
In terms of international comparisons, in 2017, Canadian men had the fourth highest inactive NEET rate compared to men of the same age group in other OECD countries. As well, the unemployed NEET rate for Canadian men was twice that of Canadian women. This difference in unemployment NEET rates between Canadian men and women was the second largest observed among OECD countries.
This report also shows a clear link between education level and NEET rates. NEET rates for men and women aged 25 to 29 drop considerably if they have attained a high school diploma and even more if they have attained postsecondary education. However, there is little variation among NEET rates for young people who have attained different levels of postsecondary education. We also observed that young NEETs were more likely than young working people not in education or students to have a partner who was also in NEET. The effect of these pairings are households that could be at risk as they contain no working adults.
In terms of future work, it would be interesting to better understand the reasons behind the inactivity of young NEETs: is their situation the result of personal choice or are they involuntarily in this situation? The association between the inactivity of young women having children in the household and family-related policies could also be explored further. Another avenue of research could be to study the relationship between the NEET rates and incentives for youth to graduate from high school and pursue postsecondary education. Finally, further research could explore why young men in Canada have a relatively high inactive rate compared with similarly-aged men in other OECD countries.
Annexes
Annex A1 - Definitions and methodology
The data used in this fact sheet are from the Labour Force Survey (LFS). The sample is representative of Canada's population aged 15 years and older, and each respondent aged 15 and over is classified as employed, unemployed or not in the labour force (inactive).
- Employed persons (who have a job) are "those who, during the reference week, did any work for pay or profit, or had a job and were absent from work" (Statistics Canada, 2016), including women on maternity leave. It should be noted that the months from May to August are not used in this fact sheet to exclude summer jobs.
- Unemployed persons "are those who, during reference week, were without work, were available for work and were either on temporary layoff, had looked for work in the past four weeks or had a job to start within the next four weeks." (Statistics Canada, 2016).
- Not in the labour force (inactive) are "Persons who were neither employed nor unemployed during the reference period. This includes persons who, during the reference period, were either unable to work or unavailable for work. It also includes persons who were without work and who had neither looked for work in the past four weeks nor had a job to start within four weeks of the reference period." (Statistics Canada, 2016). Those not in the labour force include persons who are permanently unable to work, which is approximately 1% of the 25-to-29 age group.
- A respondent is deemed to be in school if they attend an educational institution (primary, secondary, college or university) full- or part-time. Based on OECD methodology, a respondent who attends an "other" school is not deemed to be in school in this fact sheet.
Therefore, NEET individuals are those who are not in school and not employed (either inactive or unemployed).
In international comparisons, NEET rates are calculated using only the first three months of the reference year, in accordance with OECD methodology. For national and interprovincial studies, NEET rates are calculated using the months from September to April in order to maximize the sample size.
A respondent with a child is a respondent who is either designated as the household reference person or one whose spouse is the household reference person and there is a child between the ages of 0 and 24 years living in the household. The household reference person is "normally an adult with responsibility for the care or support of the family" (Statistics Canada, 2016).
The bootstrap method is used to calculate uncertainties and includes sampling uncertainties. Uncertainty bars on the percentages in this document correspond to the 95% confidence interval. The gap between two percentages is deemed significant if both intervals are distinct from one another and do not overlap.
The level of education corresponds to the highest level of schooling completed by a person. These levels are based on the International Standard Classification of Education ISCED-2011 (UNESCO Institute of Statistics, 2013). Table A1.1 shows the link between the terms used in this fact sheet, the Labour Force Survey terminology, and the ISCED-2011.
| In this document | Labour Force Survey | International Standard Classification of Education (ISCED-2011) |
|---|---|---|
| Below a high school diploma | Grade 8 or lower (Quebec: Secondary II or lower) Grade 9 to 10 (Quebec: Secondary III or IV, Newfoundland and Labrador: 1st year of secondary) Grade 11 to 13 (Quebec: Secondary V, Newfoundland and Labrador: 2nd to 4th year of secondary) (non-graduate) |
ISCED 0: Early childhood education/Pre-primary education; ISCED 1: Primary education; ISCED 2: Lower secondary education |
| High school diploma | Grade 11 to 13 (Quebec: Secondary V, Newfoundland and Labrador: 2nd to 4th year of secondary) (graduate) Some postsecondary education (non-graduate) |
ISCED 3: Upper secondary education |
| Trades diploma | Trade certificate or diploma from a vocational school or apprenticeship training | ISCED 4: Postsecondary non-tertiary education |
| College or CEGEP diploma | Non-university certificate or diploma from a community college, CEGEP, school of nursing, etc. University certificate below bachelor's level |
ISCED 5: Short-cycle tertiary education |
| Bachelor's degree | Bachelor's degree | ISCED 6: Bachelor's or equivalent level |
| Master's or doctoral degree | University degree or certificate above bachelor's degree | ISCED 7: Master's or equivalent level; ISCED 8: Doctoral or equivalent level. |
| Sources: UNESCO Institute for Statistics, International Standard Classification of Education (ISCED) 2011, 2013; Statistics Canada, Guide to the Labour Force Survey, Catalogue no. 71-543-G, 2016. | ||
Annex A2 - NEET youth aged 25 to 29 in Canada: distribution and rates by sex, level of education attained and the presence or not of children in the household, 2017/2018
| Total (with or without children) | With children | Without children | |||||||
|---|---|---|---|---|---|---|---|---|---|
| Distribution of 25- to 29-year-oldsTable A2.1 Note 1 | Distribution of 25- to 29-year-old NEETsTable A2.1 Note 2 | Distribution of 25- to 29-year-oldsTable A2.1 Note 1 | Distribution of 25- to 29-year-old NEETsTable A2.1 Note 2 | Distribution of 25- to 29-year-oldsTable A2.1 Note 1 | Distribution of 25- to 29-year-old NEETsTable A2.1 Note 2 | ||||
| Unemployed NEETs | Inactive NEETs | Unemployed NEETs | Inactive NEETs | Unemployed NEETs | Inactive NEETs | ||||
| percent | |||||||||
| Men and women | |||||||||
| All levels of education | 100 | 34 | 66 | 19 | 5 | 26 | 81 | 29 | 40 |
| Less than high school | 6 | 3 | 14 | 2 | 1 | 6 | 4 | 2 | 9 |
| High school | 23 | 10 | 24 | 5 | 2 | 9 | 18 | 8 | 15 |
| Trades | 9 | 5 | 4 | 3 | 1 | 2 | 7 | 4 | 2 |
| College, CEGEP | 24 | 7 | 11 | 5 | 1 | 5 | 19 | 6 | 6 |
| Bachelor's | 28 | 7 | 9 | 3 | 0 | 3 | 25 | 7 | 6 |
| Master's or doctoral | 9 | 2 | 3 | 1 | Note x: suppressed to meet the confidentiality requirements of the Statistics Act | 1 | 9 | 2 | 2 |
| Men | |||||||||
| All levels of education | 50 | 20 | 24 | 6 | 1 | 2 | 44 | 19 | 22 |
| Less than high school | 4 | 2 | 7 | 1 | Note x: suppressed to meet the confidentiality requirements of the Statistics Act | 1 | 3 | 2 | 6 |
| High school | 13 | 7 | 9 | 2 | 1 | 1 | 12 | 6 | 9 |
| Trades | 6 | 4 | 2 | 1 | Note x: suppressed to meet the confidentiality requirements of the Statistics Act | Note x: suppressed to meet the confidentiality requirements of the Statistics Act | 5 | 3 | 1 |
| College, CEGEP | 11 | 4 | 3 | 1 | Note x: suppressed to meet the confidentiality requirements of the Statistics Act | Note x: suppressed to meet the confidentiality requirements of the Statistics Act | 10 | 3 | 3 |
| Bachelor's | 12 | 3 | 2 | 1 | Note x: suppressed to meet the confidentiality requirements of the Statistics Act | Note x: suppressed to meet the confidentiality requirements of the Statistics Act | 11 | 3 | 2 |
| Master's or doctoral | 4 | 1 | 1 | 0 | Note x: suppressed to meet the confidentiality requirements of the Statistics Act | Note x: suppressed to meet the confidentiality requirements of the Statistics Act | 4 | 1 | 1 |
| Women | |||||||||
| All levels of education | 50 | 14 | 42 | 13 | 4 | 24 | 37 | 10 | 18 |
| Less than high school | 2 | 1 | 8 | 1 | 0 | 5 | 1 | 0 | 3 |
| High school | 10 | 3 | 14 | 4 | 2 | 8 | 6 | 2 | 6 |
| Trades | 3 | 1 | 2 | 1 | Note x: suppressed to meet the confidentiality requirements of the Statistics Act | 2 | 2 | 1 | 1 |
| College, CEGEP | 13 | 3 | 8 | 4 | 1 | 5 | 9 | 2 | 3 |
| Bachelor's | 16 | 4 | 7 | 2 | 0 | 3 | 14 | 3 | 4 |
| Master's or doctoral | 5 | 2 | 2 | 1 | Note x: suppressed to meet the confidentiality requirements of the Statistics Act | 1 | 5 | 2 | 2 |
x suppressed to meet the confidentiality requirements of the Statistics Act
Source: Statistics Canada, Labour Force Survey, September 2017 to April 2018. |
|||||||||
| Total (with and without children) | With children | Without children | |||||||
|---|---|---|---|---|---|---|---|---|---|
| Distribution of 25- to 29-year-oldsTable A2.2 Note 2 | Unemployed NEET rate | Inactive NEET rate | Distribution of 25- to 29-year-oldsTable A2.2 Note 2 | Unemployed NEET rate | Inactive NEET rate | Distribution of 25- to 29-year-oldsTable A2.2 Note 2 | Unemployed NEET rate | Inactive NEET rate | |
| percent | |||||||||
| Men and women | |||||||||
| All levels of education | 100 | 5 | 10 | 19 | 4 | 21 | 81 | 5 | 7 |
| Less than high school | 6 | 8 | 35 | 2 | 6 | 42 | 4 | 9 | 31 |
| High school | 23 | 6 | 15 | 5 | 6 | 25 | 18 | 6 | 12 |
| Trades | 9 | 8 | 6 | 3 | 5 | 11 | 7 | 9 | 5 |
| College, CEGEP | 24 | 4 | 7 | 5 | 3 | 15 | 19 | 4 | 5 |
| Bachelor's | 28 | 4 | 5 | 3 | 2 | 15 | 25 | 4 | 4 |
| Master's or doctoral | 9 | 4 | 5 | 1 | Note x: suppressed to meet the confidentiality requirements of the Statistics Act | 18 | 9 | 4 | 4 |
| Men | |||||||||
| All levels of education | 50 | 6 | 7 | 6 | 4 | 5 | 44 | 6 | 7 |
| Less than high school | 4 | 9 | 26 | 1 | Note x: suppressed to meet the confidentiality requirements of the Statistics Act | 18 | 3 | 10 | 28 |
| High school | 13 | 8 | 10 | 2 | 5 | 6 | 12 | 8 | 11 |
| Trades | 6 | 9 | 4 | 1 | Note x: suppressed to meet the confidentiality requirements of the Statistics Act | Note x: suppressed to meet the confidentiality requirements of the Statistics Act | 5 | 10 | 4 |
| College, CEGEP | 11 | 5 | 4 | 1 | Note x: suppressed to meet the confidentiality requirements of the Statistics Act | Note x: suppressed to meet the confidentiality requirements of the Statistics Act | 10 | 5 | 4 |
| Bachelor's | 12 | 4 | 3 | 1 | Note x: suppressed to meet the confidentiality requirements of the Statistics Act | Note x: suppressed to meet the confidentiality requirements of the Statistics Act | 11 | 5 | 3 |
| Master's or doctoral | 4 | 3 | 3 | 0 | Note x: suppressed to meet the confidentiality requirements of the Statistics Act | Note x: suppressed to meet the confidentiality requirements of the Statistics Act | 4 | 3 | 3 |
| Women | |||||||||
| All levels of education | 50 | 4 | 12 | 13 | 4 | 28 | 37 | 4 | 7 |
| Less than high school | 2 | 6 | 49 | 1 | 5 | 53 | 1 | 6 | 42 |
| High school | 10 | 5 | 21 | 4 | 7 | 35 | 6 | 4 | 14 |
| Trades | 3 | 6 | 12 | 1 | Note x: suppressed to meet the confidentiality requirements of the Statistics Act | 20 | 2 | 8 | 6 |
| College, CEGEP | 13 | 4 | 10 | 4 | 3 | 20 | 9 | 4 | 5 |
| Bachelor's | 16 | 4 | 6 | 2 | 3 | 20 | 14 | 4 | 4 |
| Master's or doctoral | 5 | 5 | 6 | 1 | Note x: suppressed to meet the confidentiality requirements of the Statistics Act | 22 | 5 | 5 | 5 |
x suppressed to meet the confidentiality requirements of the Statistics Act
Source: Statistics Canada, Labour Force Survey, September 2017 to April 2018. |
|||||||||
Annex A3 - Further information about inactive 25- to 29-year-old NEETs, Canada, 2017/2018
| Men | Women | Men and Women | |
|---|---|---|---|
| number | |||
| All inactive NEETs aged 25 to 29 | 90,000 | 156,700 | 246,700 |
| percent | |||
| All inactive NEETs aged 25 to 29 | 100 | 100 | 100 |
| Have a permanent disability to work | 16 | 5 | 9 |
| Say they do not want to work | 56 | 81 | 72 |
| Say they do want work (but have not looked for it) | 20 | 11 | 14 |
| Discouraged | Note x: suppressed to meet the confidentiality requirements of the Statistics Act | Note x: suppressed to meet the confidentiality requirements of the Statistics Act | 1 |
| Illness | 6 | 2 | 3 |
| Personal or family responsibilities | 2 | 5 | 4 |
| Going to school (other school) | Note x: suppressed to meet the confidentiality requirements of the Statistics Act | Note x: suppressed to meet the confidentiality requirements of the Statistics Act | Note x: suppressed to meet the confidentiality requirements of the Statistics Act |
| Waiting for a recall / replies from employers | 3 | Note x: suppressed to meet the confidentiality requirements of the Statistics Act | 2 |
| Other/No reason given | 7 | 2 | 4 |
| Other | 8 | 4 | 5 |
|
x suppressed to meet the confidentiality requirements of the Statistics Act Notes: Labour Force Survey (LFS) estimates for Canada are derived using the results of the LFS in the provinces; the territories are not included. Estimates are rounded to the nearest hundred. Totals may not add up due to rounding. Source: Statistics Canada, Labour Force Survey, September 2017 to April 2018. |
|||
References
Findlay, L. C., and Kohen, D. E. 2012. Leave practices of parents after the birth or adoption of young children, Canadian Social Trends, Statistics Canada Catalogue no. 11-008-X.
LaRochelle-Côté, S. 2013. Employment Instability Among Younger Workers, Labour Statistics: Research Papers, Statistics Canada Catalogue no. 75-004-M.
Marshall, K. 2012. Youth neither enrolled nor employed, Perspectives on Labour and Income, Statistics Canada Catalogue no. 75-001-X.
Ministère de la Famille et des Aînés. 2011. Analyse comparative des politiques en matière familiale dans les provinces canadiennes. Available in French only.
Organisation for Economic Co-operation and Development (OECD). 2017. Society at a Glance 2016 OECD Social Indicators, Chapter 1 - The NEET challenge: What can be done for jobless and disengaged youth?
Sinha, M. 2014. Child care in Canada, Spotlight on Canadians: Results from the General Social Survey, Statistics Canada Catalogue no. 89-652-X.
Statistics Canada. 2016. Guide to the Labour Force Survey, Statistics Canada Catalogue no. 71-543-G.
Statistics Canada. 2018a. Table 13-10-0421-01 (formerly CANSIM 102-4508), Live births, by age and parity of mother, table accessed in March 2018.
Statistics Canada. 2018b. Table 13-10-0416-01 (formerly CANSIM 102-4503), Live births, by age of mother, table accessed in March 2018.
Statistics Canada and Council of Ministers of Education, Canada (CMEC). 2016. Education Indicators in Canada: An International Perspective 2016, Statistics Canada Catalogue no. 81-604-X, Chapter C2 - Transitions to the labour market.
Statistics Canada and Council of Ministers of Education, Canada (CMEC). 2018. The transition from school to work - the not in employment, education or training (NEET) indicator for 15 to 19 year olds in Canada, Statistics Canada Catalogue no. 81-599-X, no. 12.
The Institut de la statistique du Québec. 2013. Les jeunes qui ne sont ni au travail ni aux études : une perspective québécoise, Travail et Rémunération - Flash-info, volume 14, no. 1. Available in French only.
UNESCO Institute of Statistics. 2013. International, Standard Classification of Education ISCED 2011.
Notes
- Date modified: