Labour market outcomes for college and university graduates, class of 2010 to 2014
Archived Content
Information identified as archived is provided for reference, research or recordkeeping purposes. It is not subject to the Government of Canada Web Standards and has not been altered or updated since it was archived. Please "contact us" to request a format other than those available.
Released: 2018-12-04
Even with the same university degree or college diploma, female graduates earn, on average, less than their male counterparts two years after graduation. Results from a new study, based on administrative data, are focused for the first time on the annual employment income of college and university graduates over time in all provinces and territories.
From 2010 up to 2014, over 900,000 students under 35 years of age graduated from a Canadian public postsecondary institution and entered the labour market. Most of these graduates obtained an undergraduate degree (53%) or a college-level diploma (14%). The median employment income two years after graduation was $43,600 for those with an undergraduate degree and $39,100 for college-level diploma holders.
For all graduating cohorts from 2010 to 2014, men with college-level diplomas or undergraduate degrees had higher median employment income than women with the same credentials. The median employment income was $43,900 for men who graduated with a college-level diploma and $36,200 for women who obtained the same qualification. For those who obtained an undergraduate degree, the median employment income was $47,200 for men and $41,300 for women. Gender differences in employment income are influenced by various factors, such as choice of field of study, occupation, and hours of work. The current study cannot identify whether or not the occupation is related to the field of study of the graduate.
The employment income of graduates varies by educational qualification
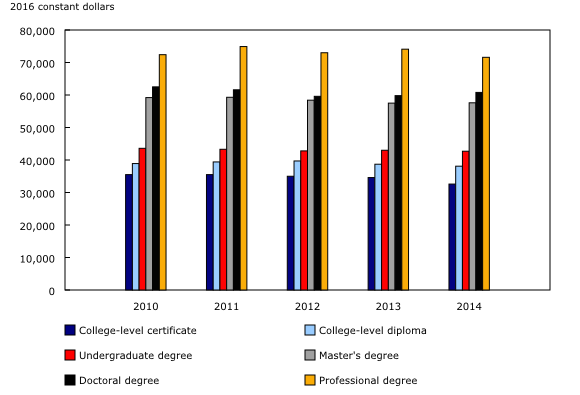
Among graduates who obtained their postsecondary credential from 2010 to 2014, the year of graduation had little impact on their employment income two years after graduation as each cohort of graduates entered a similar labour market environment. However, differences in income were observed by type of qualification for all graduating classes.
For the most recent graduate cohort (students who obtained a credential in 2014), the median employment income two years after graduation ranged from $32,600 for graduates with a college-level certificate to $71,600 for those with a professional degree (which includes graduates from law, medicine, dentistry, veterinary medicine, optometry or pharmacy). The results varied for other qualifications. For example, it was $38,100 for a college-level diploma, $42,700 for those with an undergraduate degree, $57,600 for a master's degree, and $60,800 for doctoral degree graduates.
Median employment income for men ranged from $35,300 (graduates with a college level-certificate) to $72,800 (graduates with a professional degree). The median employment income for women ranged from $30,400 (college-level certificates) to $70,800 (professional degrees).
Studies in architecture, engineering and related technologies and in health and related fields lead to relatively high median employment income
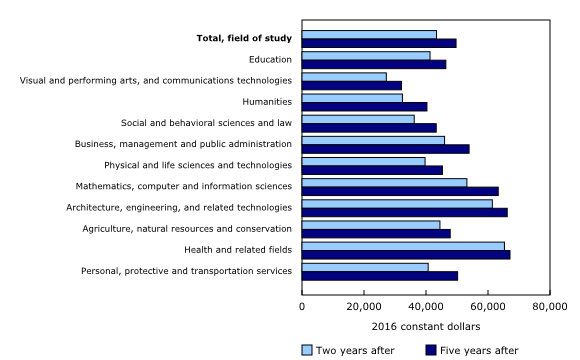
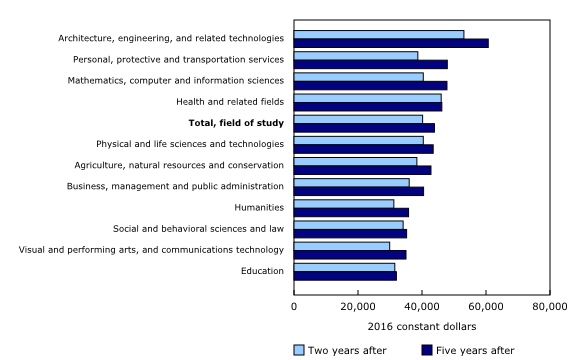
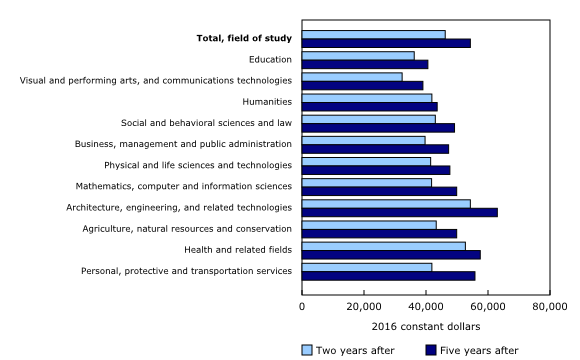
Graduates from 2014 in architecture, engineering and related technologies, and in health and related fields, had the highest median employment income two years after graduation for college-level diplomas ($47,600 and $44,900, respectively) and undergraduate degrees ($60,000 and $58,200, respectively). Women and men had slightly different results.
For 2014 college-level diploma graduates, the median employment income two years after graduation in health and related fields was $44,000 for women and $50,500 for men. This was followed by architecture, engineering, and related technologies, with women earning $41,100, while men earned $48,900.
Women who obtained an undergraduate degree in health and related fields had the highest median employment income two years after graduation at $60,800, followed by architecture, engineering, and related technologies where the median employment income was $55,900.
Men with an undergraduate degree in architecture, engineering and related technologies had the highest median employment income ($61,000), followed by graduates in mathematics, computer and information sciences ($56,100). Health and related fields programs yielded the seventh highest median employment income for men at $44,100.
Among the 2014 cohort of graduates, women represented 16% of the college-level diplomas and 20% of the undergraduate degrees in the architecture, engineering and related technologies field. In contrast, they accounted for 84% of college-level diplomas and 80% of undergraduate degrees in health and related fields.
For graduates from most provinces, architecture, engineering and related technologies, and health and related fields were also among the top-earning fields of study for both college-level diploma and undergraduate degree graduates.
Employment income increases over time for postsecondary graduates
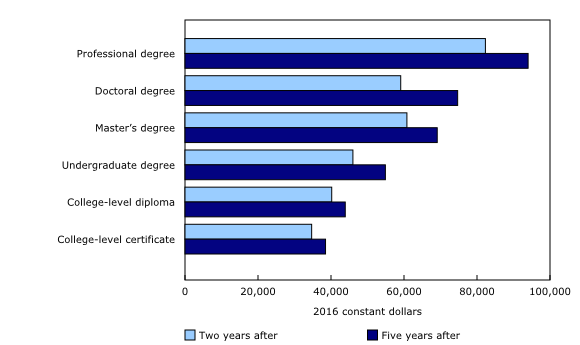
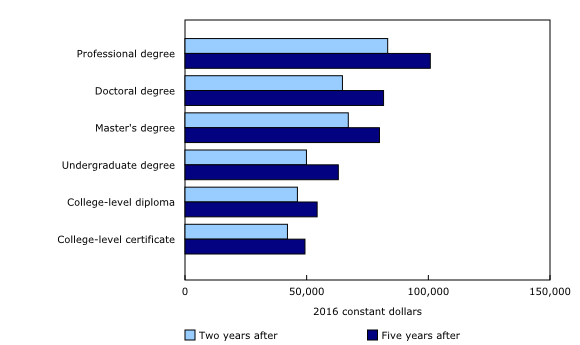
The 2011 graduating class saw their median employment income increase between 9% (for college-level diploma graduates) and 26% (for doctoral degree graduates) when measured first at two years, and then five years after graduation.
Students who obtained a professional degree in 2011 continued to have the highest median employment income five years after graduation, with an increase of 14% between year two and five. Those with a master's degree had a slightly higher median employment income two years after graduation than those who earned a doctoral degree, some of whom may have pursued postdoctoral studies. However, five years after graduation, the doctoral degree graduates were earning more.
For graduates who earned a college-level diploma in 2011, the median employment income for males increased by almost 18% between two and five years after graduation. Female graduates, in turn, had a more modest rate of growth of 4% over the same period.
Among male students who earned an undergraduate degree in 2011, overall median employment income increased by almost 26% from years two to five following their graduation. The rate of growth in median employment income for female graduates over the same time period was lower, at 15%.
Median employment income for graduates in health and related fields grows slowly
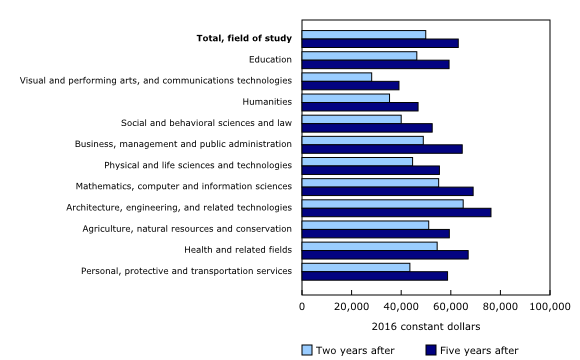
Although median employment incomes in health and related fields had the lowest growth rate among those with an undergraduate degree from years two to five after graduation (at approximately 4%), it was still among the top fields of study in terms of employment income. Graduates from humanities programs had the second highest growth rate of median employment income (28% between year two and five after graduation), however, their income ranked as one of the lowest among graduates from the major fields of study who obtained an undergraduate degree.
As was the case for students with an undergraduate degree, those with a college-level diploma in health and related fields had the lowest rate of growth (less than 1%) from two to five years after graduation, but started with relatively high median employment income. College-level diploma graduates in visual and performing arts, and communications technologies, had larger income growth between two and five years after graduation at 17%, but started with the lowest median employment income.
Note to readers
Context
This is the second of three releases highlighting results on postsecondary students and apprentices, and their labour market outcomes. Results on postsecondary enrolments and graduates were released on November 28, 2018. Results on registered apprentices and outcomes of apprentice certificate holders will be released on December 5, 2018.
This release includes data on the labour market outcomes of postsecondary graduates, including median employment income by educational qualification, field of study, age group, sex, and student status; for Canada, provinces and the territories.
Statistics Canada acknowledges the contributions and collaboration of the provinces and territories, Employment and Social Development Canada (ESDC), and other stakeholders in the development of the Education and Labour Market Longitudinal Platform (ELMLP) and the indicators.
Data definitions and concepts
Data used for this analysis and related tables come from the Postsecondary Information System (PSIS) (cohorts of graduates for the calendar years 2010 to 2014) integrated with the T1 Family File for the tax years of 2011 to 2016.
Graduate counts: In PSIS, graduate counts refer to the total number of degrees, diplomas and certificates awarded to graduates. In contrast to the PSIS published counts, the approach used in this analysis focuses on outcomes for unique persons, rather than for each reported credential earned. The target population includes one record per graduate aged 15 to 64 with an in-scope postsecondary credential (no multiple records), and excludes individuals with missing key demographic variables (age and sex).
Results presented are for graduates from 2010 to 2014 who were between 15 and 34 years old at the time of graduation and who had income data available, and were not full-time students in the year(s) of income analysis (the second year after graduation, or for the five year period after graduation for the longitudinal employment income analysis).
For further information on the data quality, concepts and methodology, see the "Labour market outcomes for college and university graduates, 2010 to 2014" technical reference guide.
Employment income: includes wages, salaries and commissions (wages and salaries, commissions from employment, training allowances, tips and gratuities, tax exempted Indian employment income) and net self-employment income (net income from business, profession, farming, fishing and commissions). Net self-employment income may be positive, negative or zero.
Median employment income: for a specified group is the value that divides the employment income distribution of that group into two halves, i.e., the incomes of half of the units in that group are below the median, while those of the other half are above the median. The median employment income of graduates is expressed in 2016 constant dollars.
Cross-sectional analysis: This is used for the 2014 graduate results and allows the comparison of graduate outcomes between different cohorts at the same amount of time elapsed after graduation. At each point in time (e.g. in the second year after graduation) only graduates who had income information and were not attending school full-time were included in the analysis population. As a result, cohorts may be composed of different individual graduates at different points in time.
Longitudinal analysis: The growth analysis for the median employment income of the 2011 cohort from two to five years after graduation is based on a longitudinal approach. Graduates who had income information and were not attending school full-time for the entire period of observation (e.g. from the first year after up to year five) were included in the analysis population. Doing this allows comparison of the same individuals over time and ensures that the analysis population is the same in every year of the analysis period.
College-level certificate refers to a Career, technical or professional training certificate in the Classification of programs and credentials.
College-level diploma refers to a Career, technical or professional training diploma in the Classification of programs and credentials.
Professional degree includes undergraduate degree and post-baccalaureate non-graduate degree programs in the following fields of study (based on Classification of Instructional Programs (CIP) Canada 2016, 6-digit classes): 22.0101 Law (LLB, JD, BCL); 51.1201 Medicine (MD); 51.0401 Dentistry (DDS, DMD); 51.2401 Veterinary medicine (DVM); 51.1701 Optometry (OD); 51.2001 Pharmacy (PharmD, BS, BSc, BPharm) as per the Classification of programs and credentials.
Data interpretation and limitations:
Due to data gaps, the analysis excludes Ontario college graduates. Similarly, the 2011 graduates of the territories are excluded from the longitudinal analysis for the five year period after graduation.
Median employment income values were calculated without controlling for:
- full- vs. part-time hours or full- vs. part-year employment
- occupation or whether or not employment is related to a graduate's field of study
- the effect on employment income of previous credentials, multiple credentials, or additional education that may have been obtained since the cohort graduation year
- previous work experience, if present
- geographical location of employment and associated labour market conditions.
Employment income for graduates with a doctoral degree does not include post-doctoral fellowships.
Graduate cohorts include both Canadian and international students with income information.
Products
The technical reference guide entitled "Labour market outcomes for college and university graduates, 2010 to 2014," which is part of the Technical Reference Guides for the Education and Labour Market Longitudinal Platform (ELMLP) (37200001), is now available.
The infographic entitled "Infographic: Labour market outcomes for college and university graduates, 2010 to 2014," which is part of Statistics Canada – Infographics (11-627-M), is also available.
Contact information
For more information, or to enquire about the concepts, methods or data quality of this release, contact us (toll-free 1-800-263-1136; 514-283-8300; STATCAN.infostats-infostats.STATCAN@canada.ca) or Media Relations (613-951-4636; STATCAN.mediahotline-ligneinfomedias.STATCAN@canada.ca).
- Date modified:


