
Ethnicity, Language and Immigration Thematic Series
Educational and labour market outcomes of children with an immigrant background by their region of origin

Archived Content
Information identified as archived is provided for reference, research or recordkeeping purposes. It is not subject to the Government of Canada Web Standards and has not been altered or updated since it was archived. Please "contact us" to request a format other than those available.
by Martin Turcotte, Centre for Ethnocultural, Language and Immigration Statistics, Statistics Canada
Skip to text
Text begins
Overview
Based on integrated data from the 2006 and 2016 censuses, this study examines the education and labour market outcomes of a cohort of children with an immigrant background who were aged 13 to 17 in 2006. In this study, the outcomes of children of immigrant parents from different regions are compared with those of children of Canadian-born parents.
- The children of immigrants were generally more likely than their counterparts from the third generation or higher to complete postsecondary studies. For example, among children of immigrants aged 13 to 17 in 2006, 43% had earned a university degree in 2016, compared with 29% of their counterparts from the third generation or higher.
- The children of Asian immigrants were much more likely to have a high level of education. For example, in 2016, the children of immigrants from East Asia were two and a half times more likely than their counterparts from the third generation or higher to hold a university degree.
- In general, the children of parents with lower levels of education also had a lower level of education. However, parents’ education level had less of an impact on the education levels of children with an immigrant background than it did on those of children with Canadian-born parents.
- Among male university graduates aged 30 to 34 working full-time full-year, those born to immigrant parents earned less than their counterparts from the third generation or higher, even after accounting for other factors.
- Among female university graduates aged 30 to 34 working full-time full-year, there was no significant wage gap between those with an immigrant background and those from the third generation or higher, once other factors were accounted for.
Introduction
In addition to its humanitarian tradition of welcoming refugees, one of the objectives of Canada’s immigration policies is to promote economic growth and prosperity throughout the country. Moreover, international immigration must help to fill current and future skilled labour shortages.
Given these objectives, education and vocational training are of utmost importance when selecting immigration candidates. It is believed that immigrants will have less trouble integrating if they are able to find a job and that they will have less trouble finding a good job if they completed postsecondary studies at a recognized postsecondary institution.
Statistics illustrate the role of education as a selection criteria for immigrants to Canada. For example, among immigrants aged 25 to 34 admitted between 2011 and 2016, 57% had a university certificate, diploma or degree at the bachelor level or above (this proportion was 71% among economic immigrants). In comparison, 30% of non-immigrants in the same age group had a university degree.Note 1
Meeting labour market shortages with a highly educated immigrant population can be beneficial for the Canadian economy in the short term. The influence of immigration on Canada’s social and economic evolution can also be felt in the much longer term, particularly because most immigrants will have Canadian-born children. These children can be considered children or youth “with an immigrant background,” as they are referred to in this article.
Given their particular family history, marked by their parents settling in a new environment, children with an immigrant background differ from other children in various ways (Statistics Canada 2017a). For example, they are likely to develop a “mixed” culture, which is first based on the culture of their parents and their community of origin, but is then later influenced by the culture of their friends, teachers and other adults they socialize with outside the home, as well as the establishments they attend (school, work, etc.). In this way they contribute to the country’s social and cultural diversity.
Children with an immigrant background can also contribute to the increase in the general level of education in Canada. In Canada, contrary to several European countries, children with an immigrant background are generally more likely than their non-immigrant counterparts to embark on and complete postsecondary studies (e.g., Kamanzi et al. 2016; OECD 2017; Chen and Hou 2019).
Despite these general trends, not all immigrants and not all children with an immigrant background have the same educational profile, and some are more successful than others. Some may have more or less success in the labour market (e.g., Chen and Hou 2019). Moreover, although the vast majority of children with an immigrant background earn their degree in Canada and are fluent in the languages of work, they may be more likely to experience discrimination during the hiring process (e.g., Oreopoulos 2011 for Canadian data).
This study explores the education and labour market outcomes of children with an immigrant background based on their region of origin, i.e., place of birth of their immigrant parents (see “Data sources, concepts and methods” for more information). Knowing the regions of origin of children with an immigrant background who are at higher risk of having educational difficulties can help in developing targeted support programs to guide them throughout their education. Similarly, identifying the regions of origin associated with exceptionally high postsecondary and university graduation rates can prompt more in-depth analyses to better understand the unmeasured factors responsible for success (e.g., Somerville and Robinson 2016, about children with an immigrant background from South Asia).
Identifying the regions of origin with less favourable labour market results is also important for the development of programs and policies aimed at fostering employability and fighting employment discrimination. If children with an immigrant background are generally more successful in school and are more likely to complete postsecondary studies, we would also expect them to have better labour market outcomes. But is this really the case?
In this context, this article aims to answer the following two questions:
- To what extent do children with an immigrant background differ from one another in terms of education outcomes, by their region of origin and compared with children of Canadian-born parents?
- To what extent are the gaps in education outcomes between the regions of origin due to variations in their family and socioeconomic situations during childhood, as well as individual characteristics?
- Are the labour market outcomes of children with an immigrant background from the different regions of origin, at the same level of education and once they have become young adults, comparable to those of youth whose parents were born in Canada (employment and earnings)?
The first question can be answered using 2006 and 2016 census data. We compare 2016 education outcomes (whether or not certain credentials were earned) by the regions of origin of youth with an immigrant background and taking into account the different characteristics measured in 2006 (when the youth lived with their parents).
More specifically, we are interested in the education outcomes of two youth cohorts: 1) that of youth aged 9 to 13 in 2006 for whom the likelihood of having at least a high school diploma in 2016, when they were between 19 and 23 years old, was estimated; 2) that of youth aged 13 to 17 in 2006, for whom we are interested in the completion of the following, as of 2016 when they were between 23 and 27 years old: a) any postsecondary certificate, diploma or degree; b) of a university degree at the bachelor level or higher; c) of a university degree at the bachelor level or higher in a STEM (science, technology, engineering and mathematics) field.
A recent study conducted by Chen and Hou (2019) examined the education and labour market outcomes of children with an immigrant background by visible minority groups, using a synthetic cohort approach. This study enriches that portrait, but focuses mostly on the regions of origin of children with an immigrant background.Note 2 Moreover, integrated 2006 and 2016 census data are used to measure and directly take into account more factors associated with education outcomes, particularly parents’ education and family income during childhood.
To answer the second research question, we examine two sets of labour market outcomes of young adults: employment, namely full-time, full-year employment, and employment earnings (or wages). In the second part of this article, only data from the 2016 Census are used, and the population of interest is persons aged 30 to 34 born in Canada or with an immigrant background.Note 3 As in the previous sections, labour market outcomes of children with an immigrant background by their region of origin are compared with those of third- or higher-generation Canadians. Details on the data source, concepts and methods are provided in the “Data source, concepts and methods” textbox.
Start of text boxThis study primarily uses integrated 2006 and 2016 Census data. The major advantages of this data integration are: 1) the availability of information on the family environment of youth before they leave the parental home. Unlinked, or “regular,” census data include the level of education attained by children with an immigrant background but, once the youth have left the family household and completed their postsecondary studies, do not indicate the socioeconomic characteristics of their family of origin (parents’ education and income, family structure, etc.);Note 4 2) a relatively large sample size, which helps to combine youth into several distinct regions of origin (specifically 16 in this study, including Canada);Note 5 3) the possibility to compare the outcomes of children with an immigrant background (generation 1.5 and second generation) with the outcomes of third- or higher-generation Canadians, which cannot be done with certain databases that only comprise information about immigrants.
Given that the majority of children and teens aged 9 to 17 lived with their parents in 2006 (98% of the sample), those who did not were excluded from the analysis. Youth aged 18 or over in 2006 were excluded because, starting at this age, a greater proportion no longer live with their parents (which makes it impossible to take into account family context variables). The subsample from the integrated 2006–2016 Census file used for this study comprised 122,810 respondents. All analyses were weighted using a weight that takes into account the selection probability of both the 2006 Census and the 2016 Census.
Children with an immigrant background
For the purposes of this study, children with an immigrant background are all children and teens born to one or two immigrant parents. These children were either born in Canada (the majority), or arrived in Canada before the age of 15 (making them members of generation 1.5, therefore all being familiar with the Canadian school system and having, if applicable, a high school or postsecondary diploma from Canada). Note that the inclusion or exclusion of children from generation 1.5, that is, children who immigrated before the age of 15, does not affect the overall findings of this study.
Region of origin
The region of origin of children with an immigrant background is the main variable of interest. For the purposes of this study, the region of origin corresponds, in all cases, to the parents’ place of birth and not the children’s place of birth. This decision was made so as to not assign a place of birth to immigrant children as a result of transitional migration rather than their parents’ region of origin. For example, the region of origin of a child with an immigrant background who was born in the United States but whose parents were both born in India (South Asia) will be South Asia rather than the United States or North America. Note that if the parents have different birth places, the mother’s place of birth is used, except if the mother was born in Canada, in which case the father’s place of birth is used.
Third-or higher-generation children are children of Canadian-born parents. Canada is the reference region for the majority of analyses in this study. Note that region of origin and parents’ place of birth are used interchangeably within this text.
In addition to Canada, the 15 other regions of origin part of the study, with the main regions of origin in parentheses, are the following: North America (United States), Central America (Mexico, El Salvador, Guatemala), the Caribbean and Bermuda (Jamaica, Haiti, Trinidad and Tobago), South America (Guyana, Brazil, Chile), Western Europe (Germany, France, Netherlands), Eastern Europe (Poland, Russian Federation, Romania), Northern Europe (United Kingdom), Southern Europe (Portugal, Italy), sub-Saharan Africa (Republic of South Africa, Ghana, Tanzania, Nigeria, Kenya), North Africa (Egypt, Morocco, Algeria), Western and Central Asia and Middle East (Lebanon, Iran, Afghanistan, Syria), East Asia (China, Hong Kong, South Korea), Southeast Asia (Philippines, Viet Nam, Cambodia), South Asia (India, Sri Lanka), and Oceania and others (Fiji, Australia, New Zealand).
Level of Education
At least a high school diploma indicates whether a person has at least completed a high school diploma or an equivalency certificate. In Tables 1 and 2 and Charts 1 and 2, “At least a high school diploma” encompasses completion of a high school diploma or equivalency certificate, a postsecondary certificate, diploma, or degree, or both.
Postsecondary certificate, diploma or degree includes certificates of apprenticeship, trade certificates and diplomas, certificates or diplomas of college studies, including CEGEP in Quebec, and university certificates, diplomas or degrees.
University degree or diploma (bachelor’s or higher) includes bachelor’s degrees (including those completed at a college), medical, master’s and doctoral degrees.
Highest level of education is used as an independent variable when investigating labour market outcomes. Its categories are mutually exclusive. Thus, for example, “high school diploma” includes only people with a high school diploma who have no postsecondary qualifications.
Parents’ highest level of education is used as a dependent variable when investigating education outcomes. Its categories are similar to those of “Highest level of education” and are also mutually exclusive.
Employment rates
Percentage of individuals employed during the week prior to the census (May 2016).
Full-time, full-year employment
Employment held by a worker 49 weeks or more in 2015 and mostly full time.
Employment earnings
Earnings that correspond to the salaries, wages and commissions of paid work. Does not include employment earnings of self-employed workers. For the 2016 Census, the reference period is the year 2015.
Multivariate analysis
In the first section, logistic regression models were used to estimate the adjusted predicted probability of attaining a given level of education (high school, postsecondary, university degree, and university degree in science, technology, engineering or mathematics fields). The mean values of the control variables were used in the tables for the sample in question (i.e., the mean values for respondents included in the model in question). All control variables included in the models are presented in Table 2. Adjusted employment rates were also obtained by logistic regression. Finally, quantile regressions were used to generate the multivariate analysis for the predicted median earnings.
Section 1: Education outcomes by region of origin
In today’s society and economy, earning a high school diploma is practically considered a minimum qualification and does not guarantee successful integration into the labour market (Uppal 2017).Note 6
In the cohort of children aged 9 to 13 in 2006, 92% of them had at least completed a high school diploma 10 years later in 2016. This proportion was higher for children with an immigrant background (96%) than for Canadian children from the third generation or higher (91%) (Chart 1 and Table 1).
Children with an immigrant background from all regions of origin were more likely than their counterparts from the third generation or higher to have at least a high school diploma—with the only two exceptions being children from a Central American country (84%), and children from the Caribbean and Bermuda (91%).
| Type of diploma completed in 2016 | ||||
|---|---|---|---|---|
| At least a high school diplomaTable 1 Note 1 | Postsecondary certificate, diploma or degreeTable 1 Note 2 | University degree (bachelor level or higher)Table 1 Note 2 | University degree (bachelor level or higher) in a STEM field (science, technology, engineering and mathematics)Table 1 Note 2 | |
| percentage | ||||
| Total | 92 | 68 | 33 | 8 |
| Region of oirigin | ||||
| Canada | 91 | 67 | 29 | 6 |
| Other countries | 96 | 72 | 43 | 12 |
| Region of origin breakdown | ||||
| Canada | 91 | 67 | 29 | 6 |
| North America | 94 | 66 | 38 | 8 |
| Central America | 84 | 51 | 19 | 2 |
| Caribbean and Bermuda | 91 | 61 | 24 | 4 |
| South America | 94 | 67 | 28 | 7 |
| Western Europe | 94 | 72 | 39 | 11 |
| Eastern Europe | 97 | 76 | 47 | 11 |
| Northern Europe | 95 | 67 | 37 | 8 |
| Southern Europe | 95 | 72 | 38 | 7 |
| Sub-Saharan Africa | 97 | 70 | 48 | 14 |
| North Africa | 94 | 79 | 52 | 16 |
| Western and Central Asia and Middle East | 97 | 75 | 45 | 13 |
| East Asia | 98 | 82 | 67 | 24 |
| Southeast Asia | 98 | 77 | 42 | 12 |
| South Asia | 98 | 76 | 56 | 17 |
| Oceania and other | 96 | 63 | 28 | 7 |
|
||||
In contrast, almost all children aged 9 to 13 whose parents were from a country in East Asia, South Asia and Southeast Asia had at least earned their high school diploma in 2016 (98% for each of these regions).

Data table for Chart 1
| Region of origin | High school diploma |
|---|---|
| percentage | |
| East Asia | 98 |
| South Asia | 98 |
| Southeast Asia | 98 |
| Sub-Saharan Africa | 97 |
| Western and Central Asia and Middle East | 97 |
| Eastern Europe | 97 |
| Oceania and others | 96 |
| Northern Europe | 95 |
| Southern Europe | 95 |
| North Africa | 94 |
| South America | 94 |
| Western Europe | 94 |
| North America | 94 |
| Caribbean and Bermuda | 91 |
| Canada | 91 |
| Central America | 84 |
| Sources: Statistics Canada, integrated 2006 and 2016 census data. | |
The scenario was relatively the same for the completion of a postsecondary certificate or diploma or degree (which includes all trades, apprenticeship, college and university credentials) and for a university degree (bachelor level or higher) specifically.
Among youth aged 13 to 17 in 2006, those with an immigrant background were slightly more likely to have a postsecondary certificate, diploma or degree in 2016 than youth from the third generation or higher (72% and 67%, respectively). Among the regions of origin, results were less favourable for the same two regions, namely Central America (51%), and the Caribbean and Bermuda (61%), as they were for the high school completion rate.
Children with an East Asian immigrant background were most likely to have a postsecondary certificate, diploma or degree in 2016 (82%), followed by children from North Africa (79%) and Southeast Asia (77%).
Although there were gaps between the regions of origin for high school and postsecondary education levels, the widest variations observed were for university education (at the bachelor level or higher).
More specifically, among youth with an immigrant background aged 13 to 17 in 2006, 43% had a university degree 10 years later. In comparison, this proportion was 29% for youth whose parents were born in Canada (Table 1).
Although children with an immigrant background were generally more likely to graduate from university, teens from East Asia (China, Hong Kong, etc.) particularly stood out: among this cohort of youth aged 13 to 17 in 2006, 67% had a university degree in 2016. Higher-than-average proportions were also observed among teens with an immigrant background from South Asia (56%) and North Africa (52%).
In fact, youth from all sub-regions of Europe, Africa and Asia had a higher proportion of university graduates than the average of Canadian youth from the third generation or higher.
A different scenario was observed among teens aged 13 to 17 in 2006 with a Central American immigrant background (university graduation rate of 19% in 2016), as well as among their counterparts with an immigrant background from the Caribbean and Bermuda (24%).
About 1 in 4 youth with an East Asian immigrant background had a university degree in a STEM field
STEM fields are considered important because they are associated with innovation and increased productivity, and offer generally higher salaries. Different initiatives exist to make these fields more popular among youth, and particularly among young women.Note 7
Past research has demonstrated that immigrants were more likely than non-immigrants to graduate in a STEM field (e.g., Hango 2013). The same is also true for their children. Among youth with an immigrant background from East Asia and aged 13 to 17 years old in 2006, 12% had a university degree in a STEM field 10 years later, compared with 6% of Canadian youth from the third generation or higher.
These overall results hide significant gaps based on the region of origin of youth with an immigrant background. Among teens with an immigrant background aged 13 to 17 in 2006, 24% had a university degree in a STEM field in 2016. Corresponding proportions were also higher than average among youth from South Asia (17%), North Africa (16%) and sub-Saharan Africa (14%).
In contrast, the proportion of those who had a university degree in a STEM field was 2% among youth with an immigrant background from Central America and 4% among youth with an immigrant background from the Caribbean and Bermuda (Table 1).
Start of text boxSince the early 1990s, young women have been more likely than young men to graduate from university (Statistics Canada 2017). This trend can be seen among third-generation Canadians as well as among children with an immigrant background, regardless of the region of origin (textbox table). However, the gap ratio (i.e., the proportion of girls divided by the proportion of boys) is greater for certain regions than for others.
| Region of origin | University diploma or degree (bachelor level or higher) | |||
|---|---|---|---|---|
| Boys | Girls | Differences between boys and girls | Relative difference between boys and girls | |
| percentage | percentage points | ratio | ||
| East Asia | 62 | 72 | 10 | 1.15 |
| South Asia | 50 | 61 | 11 | 1.21 |
| Oceania and others | 24 | 32 | 8 | 1.36 |
| North Africa | 43 | 61 | 18 | 1.40 |
| Western Europe | 32 | 46 | 14 | 1.42 |
| North America | 32 | 45 | 13 | 1.43 |
| Eastern Europe | 38 | 55 | 17 | 1.44 |
| Sub-Saharan Africa | 39 | 56 | 17 | 1.44 |
| South America | 22 | 34 | 12 | 1.54 |
| Central America | 15 | 23 | 8 | 1.56 |
| Western and Central Asia and Middle East | 35 | 55 | 20 | 1.58 |
| Southeast Asia | 32 | 51 | 19 | 1.60 |
| Southern Europe | 29 | 46 | 17 | 1.60 |
| Canada | 21 | 36 | 15 | 1.71 |
| Northern Europe | 25 | 48 | 23 | 1.91 |
| Caribbean and Bermuda | 16 | 31 | 15 | 1.96 |
| Sources: Statistics Canada, integrated 2006 and 2016 census data. | ||||
For example, among teens aged 13 to 17 in 2006 with an immigrant background from the Caribbean and Bermuda, girls were almost twice as likely as boys to have a university degree at the bachelor level or higher in 2016 (graduation rate of 31% and 16%, respectively, for a ratio of 1.96). In comparison, this gender gap was clearly lower among certain regions of origin; for example, the proportion of young women from East Asia who had a university degree was 72%, compared with 62% for young men (ratio of 1.15 between boys and girls). Boys from South Asia were also more successful, relative to girls from the same region, than their male counterparts whose parents were born in Canada.
Characteristics of the parents and family and education outcomes
It is important to be cautious when interpreting the gaps in the education outcomes of youth by their region of origin. Among other things, these gaps can reflect differences in the children’s socioeconomic origin (e.g., Croll 2004) or their individual characteristics, which can vary depending on the region of origin. This section presents the different factors associated with education outcomes and how they can vary by region of origin.
In general, we know that children from more socioeconomically advantaged families are far more likely to enroll in and successfully complete postsecondary studies themselves (OECD 2017; Zafira 2012; etc.). The parents’ level of education is recognized, even more so than income level or family wealth, as being the factor most strongly associated with the academic success and perseverance of children—particularly at the postsecondary and university level (Childs et al. 2018).
The strength of correlation between the parents’ level of education and the children’s education outcomes is illustrated in Table A1 in the appendix. For example, from 2006 to 2016, among youth aged 13 to 17 whose parents had neither a high school diploma nor postsecondary credentials, 12% had a university degree at the bachelor level or higher 10 years later. In comparison, this proportion was 63% among youth who had at least one parent with a university degree above the bachelor level. Several reasons can explain the correlation between the parents’ level of education and the children’s education outcomes (see the textbox for more information about these reasons), but the fact is that this remains one of the most significant and consistent factors throughout the years.
As seen in Table A2 in the appendix, children with an immigrant background are more likely to have parents with a university degree. In 2006, 39% of children and teens with an immigrant background aged 9 to 17 lived with at least one parent who had a university degree. In comparison, this was the case for 26% of their counterparts from the third generation or higher.
Youth with an immigrant background from regions with the highest university graduation rates were also generally more likely to have parents with a higher level of education. This was the case for youth from all sub-regions of Asia and Africa. For example, in 2006, 62% of children aged 9 to 17 with a North African immigrant background lived with parents who had a university degree, compared with 52% for their East Asian counterparts.
In comparison, only 21% of children with an immigrant background from Central America and 20% of those from the Caribbean and Bermuda lived with a parent who had a university degree. As mentioned earlier, both these regions of origin were also the ones with the lowest university graduation rates.
Start of text boxAs many studies have shown, children whose parents have a higher level of education have an advantage in many aspects of their education. This advantage can be seen as soon as children enter elementary school and remains, or even increases, over the years.
Societies vary from one to another, with some placing more emphasis on social mobility. In addition, there are more opportunities for pursuing postsecondary studies, for children from all socioeconomic backgrounds, than there were prior to government funding for public schools (Croll 2004). This being said, inequality of opportunity at birth, by parents’ level of education, is a reality in Canada, as it is elsewhere in the world.
It may seem that children with more highly educated parents have better education outcomes and more often graduate from university because their family has greater financial means.
This is only partly true and is not the main reason for the explanation. At equal family income levels, children whose parents are more highly educated are more likely to earn a university degree. In addition, it has been shown in numerous studies that parents’ education has a greater influence than family income on education outcomes (Childs et al. 2018).
In fact, it is a combination of factors related to the values, expectations and behaviours of parents that explains the education outcomes of their children. First, parents with a higher level of education are more likely than others to participate in different activities related to positive education outcomes and associated with the “cultural capital” passed on by the family: reading and communicating with the children, participating in cultural activities, buying books for the household, encouraging new knowledge learning, etc. (Childs et al. 2018). This cultural capital is a determining factor in the educational achievement of children as soon as they start school.
In addition to providing increased material resources to promote their children’s educational achievement, more highly educated parents generally have greater aspirations and expectations in terms of their children’s education (Feliciano 2006).Note 8 This is reflected, for example, in the fact that parents who are more highly educated tend to save more money, such as through Registered Education Savings Plans, regardless of their income level, with savings more strongly correlated with the parents’ education level than the extent of their financial resources (Frenette 2017).
After hearing their parents repeatedly stress the importance of education, children internalize this message and develop high educational aspirations and expectations themselves. In their vision of the world, these children come to regard educational success as “normal” and expected, and even see the possibility of undertaking and completing university studies and having a professional occupation as “natural” (Dumais 2002).
In short, studies show that parents who are more highly educated give and transfer to their children a combination of resources and values that allow those children, more so than others, to undertake and successfully complete their high school and postsecondary studies, and often a university degree.
Financial resources
Although financial resources have a lesser impact on education outcomes than the parents’ education level, financial resources can still play an active role in the children’s education pathways.
The relationship between family income during adolescence and the probability of graduating from university later on is also evident. For example, among youth whose families belonged to the lowest family income decile when they were between the ages of 13 and 17, 23% had a university degree; in comparison, this proportion was 58% among those who belonged to the highest family income decile (Table A1).
As seen in Table A2, the median family income in 2006 of children with an immigrant background ($62,340) was lower than that of children from the third generation or higher ($68,740) (despite a higher level of education of parents born outside Canada).
Median family incomes below $60,000 were reported among children whose parents were from Western and Central Asia and Middle East ($47,030), Central America ($54,610), and the Caribbean and Bermuda ($55,600). On the other hand, the median family incomes of children with an immigrant background from Northern Europe ($78,320) and North American ($74,010) were above those of children from the third generation or higher (Table A2).
Another economic capital indicator is the level of wealth, which can be measured by homeowner status in the census. In general, children with an immigrant background were somewhat less likely than children from the third generation or higher to be part of a family that owned its dwelling (78% and 84%, respectively). As with family income, these ownership rates vary by the region of origin.
Family structure and education outcomes
The family structure—regardless of the parents’ economic situation—is another factor that can affect the education outcomes of children. In general, children who live with two married parents are more likely to graduate from high school and go on to earn a postsecondary diploma (Abada et al. 2009; McLanahan and Percheski 2008). This is less often the case for children who grow up in a single-parent household. In these households, there are often fewer financial resources and parenting time resources are also scarcer, which can translates into a below-average level of support (homework help, review, etc.) (e.g., Astone and McLanahan 1991).
These trends are reflected in the integrated 2006 and 2016 census data (Table A1). Among children aged 9 to 13 who lived with a lone parent in 2006, 85% had at least a high school diploma 10 years later, compared with 95% of children who were living with both parents.
Children with an immigrant background are generally more likely than children from the third generation or higher to live with two married parents. Family structures, however, vary considerably by region of origin. For example, 41% of youth with an immigrant background from the Caribbean and Bermuda lived with a lone parent (Table A3). This proportion was also higher than average among those whose region of origin was sub-Saharan Africa (26%). In comparison, only 5% of youth with an immigrant background from South Asia lived with a lone parent (94% of them lived with married parents—the highest proportion among regions of origin).
The study also revealed that the type of area of residence—rural or urban—could have an impact on education pathways, particularly at the postsecondary level. In addition, the probability of enrolling in a university program increases as the distance between the area of residence and the educational institution decreases, all else being equal (Frenette 2002).
That said, children with an immigrant background are highly overrepresented in large metropolitan areas, where most postsecondary educational institutions are located (and therefore more easily accessible, since youth do not have to move out of the parental home, among others). More specifically, in 2006, 90% of children aged 9 to 17 with an immigrant background lived in a census metropolitan area (CMA), compared with only 60% of third- or higher-generation Canadian children.
Some regions of origin were associated with higher percentages of children living in a CMA. For example, almost all children with an immigrant background from East Asia, South Asia and North Africa lived in a CMA in 2006 (97% in each case). In contrast, this was less often the case among children with a Western European (68%) or Central American (71%) background.
In addition to human capital (parents’ education level), social capital (family structure) and economic capital characteristics (household income), some cultural capital elements can be positively associated with education outcomes. English–French bilingualism is positively associated with obtaining a diploma. For example, among youth aged 13 to 17 in 2006, 45% of those who were English–French bilingual had a university degree 10 years later, compared with 29% of those who were not bilingual (Table A1).
In general, children with an immigrant background were more likely to be English-French bilingual (22% compared with 19% of third- or higher-generation Canadian youth).
Among the other factors in the census that can have an impact on education pathways, it is important to mention the parents’ professional situation and residential stability, since some studies associated frequently moving and changing schools with less favourable education outcomes for children (Haelermans and De Witte 2015; Gasper et al. 2012).
These descriptive results shed light on the various situations in which children with an immigrant background evolve during childhood. Children from certain regions of origin may be more likely to have more educated parents but a below-average family income (e.g., those from East Asia).
At the same time, other children (e.g., those from North America) possess almost all the characteristics associated with school and academic success: more highly educated parents, higher-than-average income, residential stability, etc. Table A5 summarizes the extent to which the socioeconomic characteristics of children from different regions of origin stand out from those of all the other children. For example, the median after-tax family income of children from Central America was $7,900 less than that of all other youth. Moreover, the proportion of North American youth whose parents had a university degree was 17 percentage points higher than for all youth.
Multivariate analysis: at least a high school diploma
The results previously described can be summarized as follows: 1) for most regions of origin, children with an immigrant background have better academic outcomes than third- or higher-generation children; 2) the family and socioeconomic characteristics associated with the academic results of children with an immigrant background vary by their region of origin; 3) as regards one of the factors most strongly related to education outcomes, i.e., parents’ level of education, children with an immigrant background from most regions (except Central America, and the Caribbean and Bermuda) are privileged compared with their counterparts from the third generation or higher.
To what extent gaps between children and teens, in terms of education outcomes by region of origin, are due to differences in their socioeconomic characteristics?
For several regions of origin, taking into account the parents’ level of education and family income, family structure and other factors appreciably decreased the gap that separated them from third- or higher-generation children (Chart 2 and Table 2).
For example, without taking into account the profile of the family of origin, the probability that a child aged 9 to 13 with a Northern European immigrant background has at least a high school diploma was 4 percentage points above that of a child with Canadian-born parents. When the other factors were taken into account, the gap decreased to less than 1 percentage point (Chart 2).
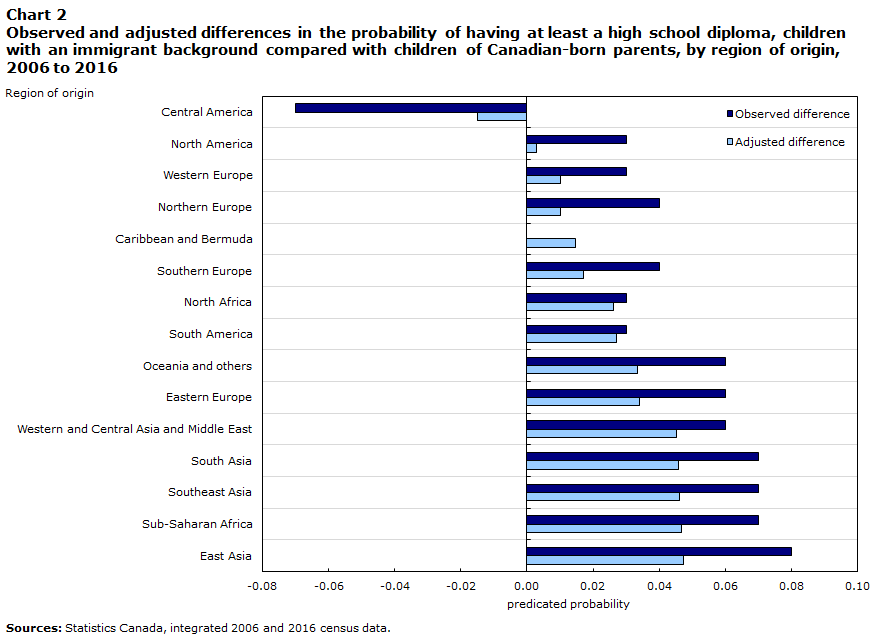
Data table for Chart 2
| Region of origin | Observed difference | Adjusted difference (modelling) |
|---|---|---|
| predicted probability | ||
| Central America | -0.07 | -0.01 |
| North America | 0.03 | 0.00 |
| Western Europe | 0.03 | 0.01 |
| Northern Europe | 0.04 | 0.01 |
| Caribbean and Bermuda | 0.00 | 0.01 |
| Southern Europe | 0.04 | 0.02 |
| North Africa | 0.03 | 0.03 |
| South America | 0.03 | 0.03 |
| Oceania and others | 0.06 | 0.03 |
| Eastern Europe | 0.06 | 0.03 |
| Western and Central Asia and Middle East | 0.06 | 0.05 |
| South Asia | 0.07 | 0.05 |
| Southeast Asia | 0.07 | 0.05 |
| Sub-Saharan Africa | 0.07 | 0.05 |
| East Asia | 0.08 | 0.05 |
| Sources: Statistics Canada, integrated 2006 and 2016 census data. | ||
| Type of diploma completed in 2016 | ||||
|---|---|---|---|---|
| At least a high school diplomaTable 2 Note 1 | Postsecondary certificate, diploma or degreeTable 2 Note 2 | University degree (bachelor level or higher)Table 2 Note 2 | University degree (bachelor level or higher) in a STEM field (science, technology, engineering and mathematics)Table 2 Note 2 | |
| predicted probability | ||||
| Region of origin (Model 1) | ||||
| Canada (ref.) | 0.94 | 0.69 | 0.27 | 0.05 |
| Other countries | 0.97Note * | 0.75Note * | 0.37Note * | 0.08Note * |
| Region of origin breakdown (Model 2) | ||||
| Canada (ref.) | 0.94 | 0.69 | 0.26 | 0.05 |
| North America | 0.94 | 0.65Note * | 0.28 | 0.04 |
| Central America | 0.93 | 0.63Note * | 0.22 | 0.02Note * |
| Caribbean and Bermuda | 0.95Note * | 0.66 | 0.23Note * | 0.04 |
| South America | 0.97Note * | 0.71 | 0.25 | 0.06 |
| Western Europe | 0.95 | 0.72 | 0.31Note * | 0.08Note * |
| Eastern Europe | 0.97Note * | 0.77Note * | 0.38Note * | 0.07Note * |
| Northern Europe | 0.95 | 0.68 | 0.27 | 0.05 |
| Southern Europe | 0.96Note * | 0.73Note * | 0.32Note * | 0.06 |
| Sub-Saharan Africa | 0.99Note * | 0.75Note * | 0.42Note * | 0.10Note * |
| North Africa | 0.97Note * | 0.74 | 0.40Note * | 0.10Note * |
| Western and Central Asia and Middle East | 0.99Note * | 0.80Note * | 0.43Note * | 0.10Note * |
| East Asia | 0.99Note * | 0.86Note * | 0.66Note * | 0.18Note * |
| Southeast Asia | 0.99Note * | 0.82Note * | 0.40Note * | 0.10Note * |
| South Asia | 0.99Note * | 0.81Note * | 0.53Note * | 0.12Note * |
| Oceania and other | 0.97Note * | 0.73 | 0.26 | 0.06 |
| Parents’ highest level of education | ||||
| No certificate, diploma or degree (ref.) | 0.88 | 0.52 | 0.13 | 0.03 |
| High school diploma | 0.93Note * | 0.63Note * | 0.21Note * | 0.04Note * |
| Postsecondary certificate or diploma below the bachelor level | 0.95Note * | 0.70Note * | 0.26Note * | 0.05Note * |
| Bachelor’s degree | 0.97Note * | 0.79Note * | 0.46Note * | 0.11Note * |
| University diploma, degree or certificate above the bachelor level | 0.97Note * | 0.81Note * | 0.52Note * | 0.12Note * |
| Economic family income decile | ||||
| First (ref.) | 0.92 | 0.63 | 0.23 | 0.06 |
| Second | 0.93 | 0.64 | 0.23 | 0.05 |
| Third | 0.94Note * | 0.65 | 0.24 | 0.05 |
| Fourth | 0.94Note * | 0.68Note * | 0.26Note * | 0.05 |
| Fifth | 0.95Note * | 0.69Note * | 0.25 | 0.05 |
| Sixth | 0.96Note * | 0.70Note * | 0.29Note * | 0.06 |
| Seventh | 0.96Note * | 0.72Note * | 0.30Note * | 0.06 |
| Eighth | 0.96Note * | 0.74Note * | 0.32Note * | 0.06 |
| Ninth | 0.97Note * | 0.76Note * | 0.35Note * | 0.07 |
| Tenth | 0.97Note * | 0.79Note * | 0.42Note * | 0.07Note * |
| At least one parent works full-time | ||||
| Yes (ref.) | 0.95 | 0.68 | 0.29 | 0.06 |
| No | 0.95 | 0.71Note * | 0.29 | 0.06 |
| Dwelling in 2006 | ||||
| Renter (ref.) | 0.92 | 0.63 | 0.23 | 0.05 |
| Owner/value of dwelling less than $100,000 | 0.94Note * | 0.69Note * | 0.25Note * | 0.05 |
| Owner/value of dwelling between $100,000 and $250,000 | 0.96Note * | 0.71Note * | 0.28Note * | 0.06Note * |
| Owner/value of dwelling more than $250,000 | 0.96Note * | 0.75Note * | 0.35Note * | 0.07Note * |
| Family structure | ||||
| Married couple | 0.96Note * | 0.72 | 0.30 | 0.06Note * |
| Common-law | 0.94Note * | 0.64Note * | 0.23Note * | 0.04Note * |
| Lone parent (ref.) | 0.95 | 0.71 | 0.29 | 0.05 |
| Residential stability over the last five years | ||||
| Moved (ref.) | 0.95 | 0.67 | 0.26 | 0.05 |
| Did not move | 0.96Note * | 0.72Note * | 0.31Note * | 0.06Note * |
| Type of area of residence | ||||
| Outside a metropolitan area (ref.) | 0.95 | 0.73 | 0.27 | 0.06 |
| Census agglomeration | 0.95 | 0.71Note * | 0.29Note * | 0.06 |
| Census metropolitan area | 0.95 | 0.70Note * | 0.30Note * | 0.06 |
| Area of residence | ||||
| Atlantic | 0.97Note * | 0.72 | 0.35Note * | 0.08Note * |
| Quebec | 0.93Note * | 0.80Note * | 0.25Note * | 0.04Note * |
| Ontario (ref.) | 0.96 | 0.71 | 0.33 | 0.07 |
| Prairies | 0.96Note * | 0.60Note * | 0.33 | 0.07 |
| Alberta | 0.95Note * | 0.62Note * | 0.27Note * | 0.07 |
| British Columbia | 0.96Note * | 0.60Note * | 0.24Note * | 0.06Note * |
| Territories | 0.85Note * | 0.53Note * | 0.20Note * | 0.01Note * |
| English–French bilingualism | ||||
| No (ref.) | 0.95 | 0.69 | 0.27 | 0.05 |
| Yes | 0.97Note * | 0.76Note * | 0.40Note * | 0.08Note * |
| Sex | ||||
| Boy (ref.) | 0.94 | 0.64 | 0.22 | 0.07 |
| Girl | 0.97Note * | 0.77Note * | 0.39Note * | 0.05Note * |
| Age in 2006 | ||||
| 9 years | 0.94Note * | Note ...: not applicable | Note ...: not applicable | Note ...: not applicable |
| 10 years | 0.95Note * | Note ...: not applicable | Note ...: not applicable | Note ...: not applicable |
| 11 years | 0.96 | Note ...: not applicable | Note ...: not applicable | Note ...: not applicable |
| 12 years | 0.96 | Note ...: not applicable | Note ...: not applicable | Note ...: not applicable |
| 13 years (ref.) | 0.96 | 0.63 | 0.24 | 0.06 |
| 14 years | Note ...: not applicable | 0.69Note * | 0.28Note * | 0.06 |
| 15 years | Note ...: not applicable | 0.73Note * | 0.31Note * | 0.06 |
| 16 years | Note ...: not applicable | 0.74Note * | 0.33Note * | 0.06 |
| 17 years | Note ...: not applicable | 0.75Note * | 0.33Note * | 0.06 |
... not applicable
Sources: Statistics Canada, integrated 2006 and 2016 census data. |
||||
A similar pattern was observed for children with an immigrant background from Central America. As previously mentioned, their parents are not as highly educated as the mean, their family income and resident ownership rates are lower, etc. (Tables A2 to A5). When these variables were held constant at their mean value, children with a Central American immigrant background were just as likely to have at least a high school diploma as children of Canadian-born parents (non-significant difference between the predicted probabilities).
That said, childhood socioeconomic and family characteristics were not sufficient to explain the greatest high school graduation rates for many children with an immigrant background, particularly all those from Asia and Africa (almost all of whom had a high school diploma and had completion probabilities of 99% in many cases) (Table 2). Other factors not taken into account could be behind these considerably higher-than-average results (for more information, see the “Why do the children of immigrants have better education outcomes?” textbox).
The influence of most of the other factors in the analysis was within expectations. The probability of having at least a high school diploma was higher among children aged 9 to 13 whose parents were more highly educated and had a higher family income, whose parents owned the dwelling, whose parents were married, who had not recently moved, who did not live in Quebec or in a territory (where the lowest graduation rates were recorded) and who were bilingual. Finally, girls aged 9 to 13 were more likely than boys to have at least a high school diploma (Table 2).
Multivariate analysis: postsecondary education
Without taking into account individual and family characteristics, teens with an immigrant background were more likely than third- or higher-generation youth to have a postsecondary certificate, diploma or degree 10 years later (a difference of 5 percentage points, Table 1). Isolating the effects of the other factors produced a similar gap (Table 2).
Consideration of the factors associated with education outcomes did not have the same effect for all regions of origin. In certain cases, the gap was considerably smaller. For example, regardless of their socioeconomic characteristics, the probability that teens with parents from Central America have a postsecondary certificate, diploma or degree was 16 percentage points lower than for their counterparts from the third generation or higher. When socioeconomic factors were taken into consideration, the gap decreased by more than half to 5 percentage points (Chart 3).
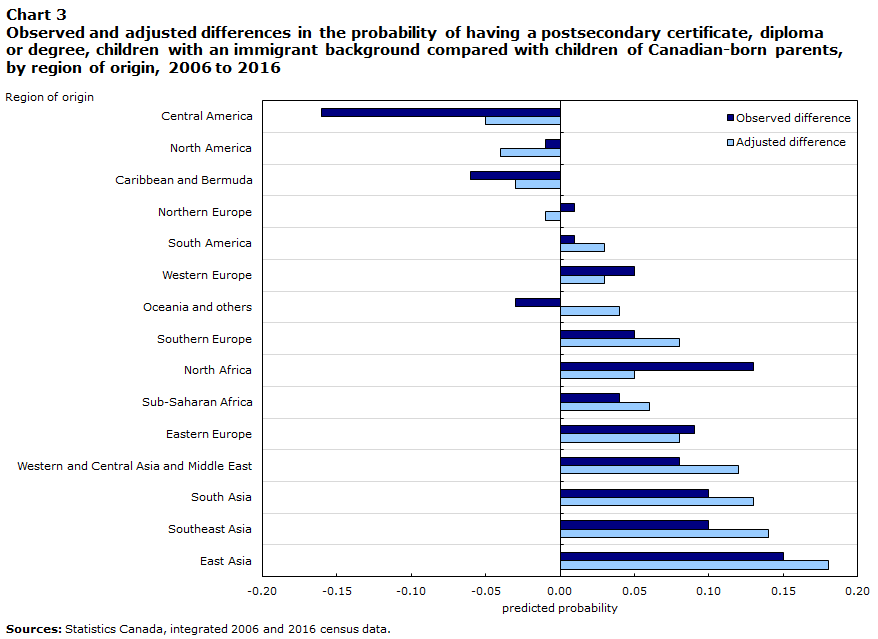
Data table for Chart 3
| Observed difference | Adjusted difference | |
|---|---|---|
| Region of origin | predicted probability | |
| Central America | -0.16 | -0.05 |
| North America | -0.01 | -0.04 |
| Caribbean and Bermuda | -0.06 | -0.03 |
| Northern Europe | 0.01 | -0.01 |
| South America | 0.01 | 0.03 |
| Western Europe | 0.05 | 0.03 |
| Oceania and others | -0.03 | 0.04 |
| Southern Europe | 0.05 | 0.08 |
| North Africa | 0.13 | 0.05 |
| Sub-Saharan Africa | 0.04 | 0.06 |
| Eastern Europe | 0.09 | 0.08 |
| Western and Central Asia and Middle East | 0.08 | 0.12 |
| South Asia | 0.10 | 0.13 |
| Southeast Asia | 0.10 | 0.14 |
| East Asia | 0.15 | 0.18 |
| Sources: Statistics Canada, integrated 2006 and 2016 census data. | ||
For teens from certain subcontinents, taking these factors into account instead increased the positive gap that distinguished them from third- or higher-generation youth. This was especially the case for youth from across Asia.
For example, without consideration of the socioeconomic factors and the other individual characteristics (initial gap), the probability that teens from Western and Central Asia would earn a postsecondary certificate, diploma or degree was 8 percentage points higher than their counterparts from the third generation or higher. The adjusted gap, after taking into account the control variables, was 12 percentage points higher. A similar scenario was seen for youth from East Asia, Southeast Asia and South Asia: the gap was greater after consideration of the control variables.
These results suggest that if the socioeconomic family characteristics of Asian teens had been similar to those of average teens, their postsecondary graduation rate would have been even higher than the one observed.
Multivariate analysis: university degree
University is undeniably the level for which there are greater gaps between teens with an immigrant background and those from the third generation or higher. This educational level is also the one where the human, economic and cultural capital variables have the greatest impact. Furthermore, it appears that the effect of the “immigrant origin” factor on the likelihood of earning a university degree is the most significant. If we took into account their individual and family characteristics in 2006, the probability that youth with an immigrant background would earn a university degree was 10 percentage points higher than that of their counterparts whose parents were born in Canada (Table 2).
As was the case for the high school and postsecondary analyses in general, considering the factors associated with earning a university degree has a different impact depending on the region of origin.

Data table for Chart 4
| Region of origin | Observed difference | Adjusted difference |
|---|---|---|
| predicated probability | ||
| Central America | -0.10 | -0.04 |
| Caribbean and Bermuda | -0.05 | -0.03 |
| South America | 0.00 | -0.01 |
| Oceania and others | -0.01 | 0.00 |
| Northern Europe | 0.08 | 0.01 |
| North America | 0.10 | 0.02 |
| Western Europe | 0.10 | 0.05 |
| Southern Europe | 0.09 | 0.06 |
| Eastern Europe | 0.18 | 0.12 |
| Southeast Asia | 0.13 | 0.14 |
| North Africa | 0.23 | 0.14 |
| Sub-Saharan Africa | 0.19 | 0.16 |
| Western and Central Asia and Middle East | 0.16 | 0.17 |
| South Asia | 0.27 | 0.27 |
| East Asia | 0.38 | 0.40 |
| Sources: Statistics Canada, integrated 2006 and 2016 census data. | ||
For certain regions of origin such as sub-Saharan Africa and all sub-regions of Asia, results practically remained unchanged when the youth’s family and personal characteristics were taken into account. For example, if the other factors were or were not held constant, the predicted probability that a teen aged 13 to 17 in 2006 with a South Asian immigrant background (India, Sri Lanka) would have a university degree 10 years later was still 27 percentage points higher than for their Canadian-born counterparts (Chart 4).
In addition, the consideration or non-consideration of socioeconomic factors had almost no effect on the exceptional university graduation rates of children with an immigrant background from East Asia, and particularly children from China and Hong Kong (adjusted predicted probability of graduating from university of 66%). (Table 2).
These results are particularly noteworthy given: 1) the major impact that the parents’ education level has on the probability of teens earning a university degree;Note 9 2) that the parents of children from these regions are, on average, more highly educated. For teens from Asia and sub-Saharan Africa, we must therefore conclude that other factors not measured in the census are responsible for their clearly higher-than-average likelihood of graduating from university.
For teens from Western Europe, Eastern Europe, Southern Europe and North Africa, taking into account the other variables decreased the difference that separated them from their counterparts from the third generation or higher, without eliminating it, however. All else being equal, they remained more likely to earn a university degree. For them also, other factors not measured in the census could explain the gaps in graduation rates.
Finally, for youth with an immigrant background from Northern Europe and North America, their greatest success in terms of university graduation rate was mostly due to the relatively favourable socioeconomic characteristics in their home environment (more highly educated parents, appreciably higher-than-average income, high prevalence of married parents, etc.). Given equivalent characteristics, they were not more likely than their counterparts from the third generation or higher to graduate from university (Chart 4).
Note that conclusions were similar for a university degree in a STEM field (Table 2, column 4). In fact, if the human capital, economic capital and other factors associated with education outcomes were taken into account, children with an immigrant background remained more likely than children of Canadian-born parents to earn such a degree. This was particularly true for youth from Africa and Asia, with youth from East Asia significantly standing out compared with youth from other regions of origin.
Start of text boxAs seen in this study, children with an immigrant background are more likely than their counterparts from the third or generation or higher to have a postsecondary certificate, diploma or degree (particularly a university degree). Similar results were observed in the past in Canada (Abada et al. 2009) and in the United States (for a literature review, see Feliciano and Lanuza 2015).Note 10
Numerous reasons why children with an immigrant background attend and graduate from university are still unknown at this time.
One of the most common hypotheses behind these persistent gaps is the determining role and influence of parents of children with an immigrant background—that is, the immigrants themselves (Goyette and Xie 1999). According to a number of authors, immigrants form, by definition, a motivated and ambitious population; when they decide to leave their country, they anticipate a better future for themselves, but especially for their children (Feliciano 2005; Feliciano 2006). And this better future is often based on their children’s academic success.
In general, immigrant parents have higher expectations and aspirations for their children than parents born in this country and do everything they can to pass this ambition onto them (Feliciano and Lanuza 2015). This intergenerational transmission of objectives is thought to be easier since the children of immigrants often have a stronger sense of obligation toward their family than children of non-immigrant parents (Hardway, Fuligni and Witkow 2004).Note 11
Furthermore, within certain immigrant communities, the fact that children do well in school and graduate from university maintains, and even increases, the family’s status and level of prestige, which could also influence the parents’ and children’s motivation (e.g., Somerville and Robinson 2016).
Through these socialization processes, a number of children with an immigrant background are thought to assimilate the values transmitted by their parents and immigrant community members during childhood, which guides their academic choices and behaviours (e.g., Feliciano 2006; Feliciano and Lanuza 2015). In Canada, for example, a study that used Youth in Transition Survey data revealed that, at 15 years old, children with an immigrant background were more likely than their non-immigrant counterparts to want to enroll in and complete university studies (Krahn and Taylor 2005).
According to some authors, however, these explanations are not enough to account for the success of second-generation immigrants. In fact, even if we controlled a large number of factors such as parental aspirations, literacy and academic results during adolescence, children with an immigrant background would still be overrepresented among those who enroll in university (Childs et al. 2017).Note 12
Higher probability of earning a university degree among children with an immigrant background whose parents are less educated
In most OECD countries, intergenerational education transmission is not as direct among children of immigrant parents as among other children (OECD 2017). However, less educated immigrants want their children to stay in school as long as possible, which is not as often the case with their counterparts from the third generation or higher (Feliciano 2006).
This study revealed the same findings as it relates to youth who graduate from university (the degree at which the association between the parents’ education and the children’s outcomes is the greatest).
Among children whose parents had at most a high school diploma or less, children with an immigrant background were more likely to have a university degree than children of Canadian-born parents, for almost all regions of origin.
More specifically, among third- or higher-generation Canadian youth whose parents had a high school diploma or less, the predicted probability (adjusted for the socioeconomic characteristics) of graduating from university was 11%. In comparison, this probability was 3 to 6 times greater for their counterparts with an immigrant background from sub-Saharan Africa, South Asia, North Africa and East Asia (Table 3).
| Parents’ highest level of education | Impact of parents’ educationTable 3 Note 1 | ||||
|---|---|---|---|---|---|
| High school or less (ref.) | Postsecondary certificate or diploma below the bachelor level | Bachelor’s degree | University diploma or degree above the bachelor level | ||
| predicted probability of earning a university degree | relative marginal effect | ||||
| Region of origin | |||||
| Canada | 0.11 | 0.17Note * | 0.34Note * | 0.40Note * | 270 |
| Other countries | 0.23 | 0.27Note * | 0.47Note * | 0.55Note * | 139 |
| Region of origin breakdown | |||||
| Canada | 0.11 | 0.17Note * | 0.34Note * | 0.40Note * | 270 |
| North America | 0.20 | 0.22 | 0.52Note * | 0.58Note * | 190 |
| Central America | 0.09 | 0.23 | 0.46Note * | 0.52Note * | 451 |
| Caribbean and Bermuda | 0.15 | 0.17 | 0.31Note * | 0.31Note * | 106 |
| South America | 0.09 | 0.14 | 0.26Note * | 0.38Note * | 348 |
| Western Europe | 0.14 | 0.17 | 0.26Note * | 0.34Note * | 141 |
| Eastern Europe | 0.19 | 0.22 | 0.41Note * | 0.44Note * | 133 |
| Northern Europe | 0.16 | 0.16 | 0.37Note * | 0.39Note * | 153 |
| Southern Europe | 0.16 | 0.24Note * | 0.47Note * | 0.50Note * | 206 |
| Sub-Saharan Africa | 0.35 | 0.39 | 0.46 | 0.59Note * | 68 |
| North Africa | 0.44 | 0.37 | 0.77Note * | 0.71Note * | 63 |
| Western and Central Asia and Middle East | 0.12 | 0.19Note * | 0.38Note * | 0.40Note * | 238 |
| East Asia | 0.62 | 0.68 | 0.76Note * | 0.82Note * | 31 |
| Southeast Asia | 0.25 | 0.24 | 0.33Note * | 0.42Note * | 67 |
| South Asia | 0.41 | 0.57Note * | 0.69Note * | 0.71Note * | 72 |
| Oceania and other | 0.52 | 0.42 | 0.73 | 0.79 | 53 |
Sources: Statistics Canada, integrated 2006 and 2016 census data. |
|||||
This was especially true with respect to youth with an immigrant background from East Asia whose parents had a high school diploma at most, their probability to graduate from university (62%) was even higher than for that of third- or higher-generation Canadians whose parents had a university degree above the bachelor level (40%) (Table 3).
In fact, in general and for most regions of origin, the level of educational attainment had a lesser impact on the outcomes of children with an immigrant background than on children of Canadian-born parents. This conclusion can be supported by calculating the relative marginal effect, which represents the increase, in percentage, of the predicted probability of graduating from university among youth whose parents have a university degree above the bachelor level compared with those whose parents had a high school diploma at most.
Thus, for youth from the third generation or higher, having parents who graduated from university (diploma, degree or certificate above the bachelor level), compared with parents with a high school diploma at most, increased their predicted probability of completing university studies by 270%. In comparison, for youth with an immigrant background from East Asia, having very highly educated parents (education above the bachelor level) compared with less highly educated parents (high school diploma at most) increased their predicted probability of earning a university degree by only 31%.
The only two regions of origin whose marginal effects were above those recorded for third- or higher-generation youth were Central America (451%) and South America (348%). For all other regions of origin, the parents’ level of educational attainment did not have as much of an impact on the youth’s probability of graduating from university.
To summarize the first part of this report, results have shown that children with an immigrant background were, overall, more likely to earn a high school and postsecondary diploma than children of Canadian-born parents. Certain regions of origin particularly stood out. Moreover, the adjusted predicted probability of graduating from university was higher than the mean for 9 of the 15 regions of origin: Western Europe, Eastern Europe, Southern Europe, sub-Saharan Africa, North Africa, Western and Central Asia and Middle East, East Asia, Southeast Asia, and South Asia. If we neutralized the effect of the individual and family characteristics associated with the level of education, youth from all these regions were still more likely to have a university degree.
In contrast, the adjusted probability of graduating from university was similar to that of Canadian-born children for five regions of origin: North America, Central America, South America, Northern Europe, and Oceania and others. Finally, this probability was lower for children with an immigrant background from the Caribbean and Bermuda.
In the second part of the report, we look at the labour market outcomes of children with an immigrant background, again by their region of origin. Since a higher level of education is associated with more positive labour market outcomes, we would expect these employment indicators to be more favourable for children with an immigrant background from regions for which postsecondary graduation rates are the highest. But is this really the case?
Section 2: Labour market outcomes by region of origin
Two factors frequently explain why recent immigrants often have more trouble entering the labour market than non-immigrants: 1) earning a postsecondary diploma outside the country, since these diplomas are not always recognized as much by employers as Canadian diplomas; 2) insufficient knowledge of or proficiency in English or French.
Neither of these factors, however, should disadvantage the children with an immigrant background considered in this study. All of them were enrolled in the Canadian school system and almost all those who earned a high school or postsecondary diploma did so from a Canadian institution. In general, youth with an immigrant background have excellent knowledge of either English or French. Often, they even know a third language, which can be an asset.
This second section focuses on the outcomes of young adults aged 30 to 34 with an immigrant background, who, in most cases, joined the labour market (which is less often the case among 25- to 29-year-olds). Are the diplomas earned by young adults with an immigrant background from different regions of origin beneficial to them? In theory, the labour market outcomes of youth with an immigrant background are expected to be better than those of third- or higher-generation Canadians (and even better among youth from certain regions of origin such as East Asia or South Asia, where the graduation rate is significantly higher). In fact, given their higher level of education, better labour market outcomes for young adults with an immigrant background from North America and all sub-regions of Europe, Asia and Africa could be expected. If the level of education and possibly the field of study were taken into account, the gaps between the regions of origin should still be appreciably smaller (or eliminated compared with young adults born to Canadian parents).
Without controlling for other factors, the employment rate of young adults with an immigrant background (83.3%) was slightly higher than for those of Canadian-born parents (81.8.%). The employment rates nevertheless varied considerably from one region of origin to another (Table 4).
In 2016, the lowest employment rates were recorded by young adults with an immigrant background from Central America (76.8%), the Caribbean and Bermuda (78.2%), and Western and Central Asia and Middle East (78.3%). In contrast, 85.7% of children with an immigrant background from Southern Europe and 86.6% of those from East Asia were employed.
| Employment rates | Full-time, full-year employment rates | |||||
|---|---|---|---|---|---|---|
| Total | Female | Male | Total | Female | Male | |
| percentage | ||||||
| Region of origin | ||||||
| Canada | 81.8 | 78.9 | 84.8 | 51.4 | 44.1 | 58.8 |
| Other countries | 83.3 | 79.9 | 86.5 | 52.7 | 45.6 | 59.6 |
| Region of origin breakdown | ||||||
| Canada | 81.8 | 78.9 | 84.8 | 51.4 | 44.1 | 58.8 |
| North America | 81.3 | 76.5 | 85.9 | 50.2 | 41.0 | 59.2 |
| Central America | 76.8 | 67.4 | 86.6 | 45.9 | 35.0 | 57.2 |
| Caribbean and Bermuda | 78.2 | 76.8 | 79.7 | 46.0 | 42.1 | 50.4 |
| South America | 81.9 | 78.1 | 85.6 | 51.0 | 43.8 | 58.3 |
| Western Europe | 84.5 | 80.0 | 89.0 | 53.7 | 44.4 | 62.9 |
| Eastern Europe | 84.4 | 81.3 | 87.4 | 52.9 | 45.8 | 59.9 |
| Northern Europe | 84.2 | 80.4 | 88.0 | 54.3 | 46.2 | 62.1 |
| Southern Europe | 85.7 | 83.0 | 88.2 | 56.3 | 49.3 | 63.1 |
| Sub-Saharan Africa | 81.0 | 78.9 | 83.1 | 49.2 | 42.4 | 56.1 |
| North Africa | 81.5 | 79.6 | 83.2 | 46.3 | 39.3 | 53.1 |
| Western and Central Asia and Middle East | 78.3 | 72.5 | 83.8 | 47.1 | 39.1 | 54.6 |
| East Asia | 86.6 | 85.6 | 87.5 | 58.5 | 53.8 | 62.8 |
| Southeast Asia | 85.0 | 84.0 | 86.0 | 54.4 | 49.9 | 58.6 |
| South Asia | 82.6 | 77.6 | 87.3 | 51.5 | 44.4 | 58.2 |
| Oceania and other | 84.5 | 81.7 | 87.2 | 50.4 | 42.8 | 57.6 |
| Source: Statistics Canada, 2016 Census of Population. | ||||||
These employment rates also varied by sex and region of origin: women were less likely to be employed, and the gap between men and women was larger for certain regions of origin than for others. For example, 84% of women with an immigrant background from Southeast Asia were employed, while the proportion for men was almost identical (86%). In contrast, only 67.4% of women with an immigrant background from Central America were employed, compared with 86.6% of their male counterparts (Table 4).
The combined full-time, full-year employment rate for youth with an immigrant background was slightly above the rate recorded for their counterparts whose parents were born in Canada (52.7% and 51.4%, respectively).
However, this rate varied from as low as 45.9% for those whose region of origin was Central America to as high as 58.5% among those from East Asia.
In some ways, many of these gaps between regions of origin in terms of employment and full-time, full-year employment are expected (since high school and postsecondary graduation rates vary from one region of origin to another). This raises the question of whether, given the same level of education and sociodemographic characteristics, results would be the similar for youth with an immigrant background.
As seen in Table 5, when the level of education and the other sociodemographic variables are held constant, the predicted probability for a 30- to 34-year-old young adult whose parents were born in Canada of being employed was 84%. For youth with an immigrant background from several regions of origin, this probability is relatively similar.
| Employment rate | Full-time, full-year employment rate | |
|---|---|---|
| predicted probability | ||
| Region of origin breakdown | ||
| Canada (ref.) | 0.84 | 0.52 |
| North America | 0.83Note * | 0.50Note * |
| Central America | 0.84 | 0.50Note * |
| Caribbean and Bermuda | 0.79Note * | 0.45Note * |
| South America | 0.83Note * | 0.50Note * |
| Western Europe | 0.85 | 0.52 |
| Eastern Europe | 0.83Note * | 0.49Note * |
| Northern Europe | 0.85Note * | 0.53 |
| Southern Europe | 0.87Note * | 0.55Note * |
| Sub-Saharan Africa | 0.79Note * | 0.46Note * |
| North Africa | 0.77Note * | 0.42Note * |
| Western and Central Asia and Middle East | 0.77Note * | 0.44Note * |
| East Asia | 0.83Note * | 0.53Note * |
| Southeast Asia | 0.86Note * | 0.53 |
| South Asia | 0.81Note * | 0.47Note * |
| Oceania and other | 0.86 | 0.51 |
| Highest level of education | ||
| No certificate, diploma or degree (ref.) | 0.55 | 0.30 |
| High school diploma | 0.76Note * | 0.46Note * |
| Postsecondary certificate or diploma below the bachelor level | 0.86Note * | 0.53Note * |
| Bachelor’s degree | 0.91Note * | 0.62Note * |
| University certificate, diploma or degree above the bachelor level | 0.91Note * | 0.58Note * |
| Sex | ||
| Women (ref.) | 0.79 | 0.43 |
| Men | 0.88Note * | 0.61Note * |
| Age in 2016 | ||
| 30 years (ref.) | 0.84 | 0.51 |
| 31 years | 0.84 | 0.51Note * |
| 32 years | 0.84Note * | 0.52Note * |
| 33 years | 0.85Note * | 0.52Note * |
| 34 years | 0.85Note * | 0.53Note * |
| Area of residence | ||
| Atlantic | 0.80Note * | 0.50Note * |
| Quebec | 0.87Note * | 0.50Note * |
| Ontario (ref.) | 0.84 | 0.55 |
| Prairies | 0.83Note * | 0.53Note * |
| Alberta | 0.83Note * | 0.51Note * |
| British Columbia | 0.84Note * | 0.48Note * |
| Territories | 0.79Note * | 0.50Note * |
Source: Statistics Canada, 2016 Census of Population. |
||
However, employment probabilities adjusted by age, sex, region of origin and the highest level of educational attainment were lower among young adults from Western and Central Asia and Middle East (77%), North Africa (77%), the Caribbean and Bermuda (79 %), sub-Saharan Africa (79%), and South Asia (81%). In comparison, the adjusted employment probability of Canadian youth was 84%.
For full-time, full-year employment, the predicted probability of having been employed all year was 52% among young adults whose parents were born in Canada. Comparatively, adjusted full-time, full-year employment rates were lower for many other regions of origin. The adjusted predicted probabilities of full-time, full-year employment were lower among young adults with an immigrant background from North Africa (42%), Western and Central Asia and Middle East (44%), the Caribbean and Bermuda (45%), sub-Saharan Africa (46%), and South Asia (47%) (Table 5).Note 13
In summary, despite having a higher level of education than their counterparts whose parents were born in Canada, numerous young adults with an immigrant background are unable to find stable, full-time employment.
Variations in employment earnings by region of origin
Globally, the median annual earnings of young adults with an immigrant background were higher than those of their counterparts born to Canadian parents ($46,580 and $43,470 respectively, for a difference of about $3,110) (Table 6).
This positive difference was greater among young adults from East Asia, who earned $12,200 more annually than third- or higher-generation Canadians. In contrast, the median annual earnings of young adults with an immigrant background from Central America and the Caribbean and Bermuda were lower by $5,030 and $5,800, respectively.
| Annual earnings | Annual earnings, full-time, full-year employment | Annual earnings full-time, full-year employment, among those with university degree (bachelor level or higher) | |||||||
|---|---|---|---|---|---|---|---|---|---|
| Total | Female | Male | Total | Female | Male | Total | Female | Male | |
| dollars | |||||||||
| Region of origin | |||||||||
| Canada (reference category) | 43,470 | 35,530 | 52,430 | 53,920 | 46,840 | 59,840 | 66,190 | 61,420 | 72,880 |
| Other countries | 3,110 | 5,130 | 490 | 3,330 | 5,740 | 1,290 | 2,220 | 2,580 | 870 |
| Region of origin breakdown | |||||||||
| Canada (reference category) | 43,470 | 35,530 | 52,430 | 53,920 | 46,840 | 59,840 | 66,190 | 61,420 | 72,880 |
| North America | -440 | -310 | 410 | 2,550 | 3,010 | 1,880 | 1,680 | 1,940 | -860 |
| Central America | -5,030 | -4,560 | -6,630 | -5,540 | -3,030 | -7,810 | -6,380 | -5,060 | -7,410 |
| Caribbean and Bermuda | -5,800 | 250 | -12,670 | -6,020 | 490 | -11,380 | -5,610 | -2,650 | -8,510 |
| South America | -690 | 3,540 | -6,070 | -1,630 | 2,670 | -4,420 | -1,770 | -400 | -3,700 |
| Western Europe | 2,980 | 2,180 | 4,070 | 3,510 | 3,180 | 3,580 | 810 | -860 | 730 |
| Eastern Europe | 5,630 | 7,720 | 3,250 | 5,800 | 8,450 | 3,840 | 3,610 | 3,680 | 2,910 |
| Northern Europe | 3,990 | 3,860 | 3,320 | 4,080 | 4,610 | 3,360 | 1,930 | 2,090 | 1,340 |
| Southern Europe | 4,180 | 4,350 | 3,250 | 2,920 | 3,320 | 2,450 | 1,970 | 970 | 2,350 |
| Sub-Saharan Africa | 3,730 | 6,820 | -1,190 | 4,780 | 9,180 | 1,200 | 3,230 | 4,490 | 190 |
| North Africa | 2,970 | 4,330 | 50 | 6,460 | 7,570 | 4,360 | 3,220 | 1,140 | 3,650 |
| Western and Central Asia and Middle East | 2,180 | 4,470 | -530 | 5,820 | 7,820 | 4,230 | 4,140 | 2,930 | 2,560 |
| East Asia | 12,200 | 16,540 | 6,460 | 10,660 | 15,120 | 6,770 | 4,420 | 5,730 | 1,580 |
| Southeast Asia | 2,660 | 7,370 | -2,950 | 1,160 | 6,230 | -2,950 | 2,880 | 5,340 | -950 |
| South Asia | 6,030 | 8,990 | 2,750 | 6,900 | 10,520 | 4,700 | 3,800 | 3,720 | 3,840 |
| Oceania and others | 3,020 | 4,280 | 310 | 2,130 | 6,800 | 510 | 2,600 | 3,950 | 250 |
| Source: Statistics Canada, 2016 Census of Population. | |||||||||
The multivariate quantile regression analysis illustrates the determining role that level of education has on employment earnings. Based on this analysis, the median annual earnings of university graduates aged 30 to 34 were $36,220 higher than those of individuals who did not graduate from high school (Table 7).
When the results were adjusted to account for level of education, age, sex and area of residence, the predicted median earnings of young adults with an immigrant background were lower compared with those of their counterparts from the third generation or higher for 11 of the 15 regions of origin.
| Annual earnings | Annual earnings, full-time, full-year employment | Annual earnings full-time, full-year employment, among those with university degree (bachelor level or higher) | |||||||
|---|---|---|---|---|---|---|---|---|---|
| Total | Female | Male | Total | Female | Male | Total | Female | Male | |
| dollars | |||||||||
| Region of origin breakdown | |||||||||
| Canada (ref.) | Note ...: not applicable | Note ...: not applicable | Note ...: not applicable | Note ...: not applicable | Note ...: not applicable | Note ...: not applicable | Note ...: not applicable | Note ...: not applicable | Note ...: not applicable |
| North America | -3,290Note * | -2,750Note * | -4,270Note * | -1,690Note * | -710 | -2,250Note * | 510 | 1,130 | -1,390 |
| Central America | -2,910Note * | -1,690Note * | -4,120Note * | -3,060Note * | -2,720Note * | -3,840Note * | -4,810Note * | -2,880 | -7,270Note * |
| Caribbean and Bermuda | -5,350Note * | -850 | -10,220Note * | -4,680Note * | -420 | -9,440Note * | -4,560Note * | -2,810Note * | -6,950Note * |
| South America | -2,460Note * | 1,380 | -6,090Note * | -2,150Note * | 680 | -4,630Note * | -3,540Note * | -1,560 | -6,970Note * |
| Western Europe | -990Note * | -1,090Note * | -1,010 | -610 | -130 | -950 | -1,670Note * | -1,250 | -2,220Note * |
| Eastern Europe | -370 | 1,800Note * | -2,400Note * | -170 | 1,500Note * | -1,750Note * | -1,080 | -150 | -2,400Note * |
| Northern Europe | -480 | 1,010Note * | -2,050Note * | -360 | 630 | -1,360Note * | -640 | -870 | -400 |
| Southern Europe | 2,470Note * | 2,940Note * | 2,110Note * | 1,840Note * | 1,850Note * | 1,480Note * | 1,580Note * | 1,830Note * | 790 |
| Sub-Saharan Africa | -3,890Note * | 190 | -8,060Note * | -2,150Note * | 1,190 | -5,140Note * | -1,350 | 340 | -3,330Note * |
| North Africa | -2,080Note * | -1,900 | -3,000Note * | 2,350Note * | 2,720 | 2,620 | 790 | 2,390 | -360 |
| Western and Central Asia and Middle East | -2,570Note * | -820 | -3,720Note * | 1,230 | 2,920Note * | -170 | -370 | 680 | -1,110 |
| East Asia | 1,280Note * | 7,550Note * | -4,050Note * | 20 | 3,950Note * | -3,930Note * | -120 | 2,260Note * | -3,450Note * |
| Southeast Asia | -1,050Note * | 5,310Note * | -6,630Note * | -2,200Note * | 2,520Note * | -6,590Note * | -2,550Note * | -190 | -6,160Note * |
| South Asia | -350 | 2,750Note * | -3,730Note * | 60 | 2,780Note * | -1,990Note * | -1,760Note * | -1,170 | -3,030Note * |
| Oceania and others | -590 | 4,350Note * | -5,100Note * | -1,560 | 3,050 | -4,980Note * | -1,390 | -1,410 | -4,850 |
| Highest level of education | |||||||||
| No certificate, diploma or degree (ref.) | Note ...: not applicable | Note ...: not applicable | Note ...: not applicable | Note ...: not applicable | Note ...: not applicable | Note ...: not applicable | Note ...: not applicable | Note ...: not applicable | Note ...: not applicable |
| High school diploma | 8,900Note * | 9,690Note * | 7,920Note * | 6,710Note * | 7,820Note * | 5,750Note * | Note ...: not applicable | Note ...: not applicable | Note ...: not applicable |
| Postsecondary certificate or diploma below the bachelor level | 18,310Note * | 15,370Note * | 20,690Note * | 15,530Note * | 12,550Note * | 18,000Note * | Note ...: not applicable | Note ...: not applicable | Note ...: not applicable |
| Bachelor’s degree | 32,740Note * | 31,950Note * | 32,370Note * | 30,490Note * | 30,540Note * | 29,540Note * | -3,190Note * | -3,760Note * | -2,610Note * |
| University diploma, degree or certificate above the bachelor level | 36,220Note * | 36,920Note * | 33,280Note * | 35,690Note * | 37,010Note * | 32,780Note * | reference | reference | reference |
| Sex | |||||||||
| Women (ref.) | Note ...: not applicable | Note ...: not applicable | Note ...: not applicable | Note ...: not applicable | Note ...: not applicable | Note ...: not applicable | Note ...: not applicable | Note ...: not applicable | Note ...: not applicable |
| Men | 18,120Note * | Note ...: not applicable | Note ...: not applicable | 13,670Note * | Note ...: not applicable | Note ...: not applicable | 6,140Note * | Note ...: not applicable | Note ...: not applicable |
| Age | |||||||||
| 30 years (ref.) | Note ...: not applicable | Note ...: not applicable | Note ...: not applicable | Note ...: not applicable | Note ...: not applicable | Note ...: not applicable | Note ...: not applicable | Note ...: not applicable | Note ...: not applicable |
| 31 years | 1,970Note * | 1,410Note * | 2,510Note * | 1,640Note * | 1,640Note * | 1,830Note * | 2,680Note * | 2,390Note * | 2,900Note * |
| 32 years | 3,340Note * | 2,310Note * | 4,560Note * | 3,430Note * | 2,830Note * | 3,920Note * | 5,450Note * | 4,320Note * | 6,750Note * |
| 33 years | 4,830Note * | 3,150Note * | 6,560Note * | 4,720Note * | 3,900Note * | 5,630Note * | 8,000Note * | 6,180Note * | 10,110Note * |
| 34 years | 6,670Note * | 5,110Note * | 8,300Note * | 6,400Note * | 5,440Note * | 7,430Note * | 11,150Note * | 9,640Note * | 13,380Note * |
| Area of residence | |||||||||
| Atlantic | -5,900Note * | -4,940Note * | -7,200Note * | -5,870Note * | -5,190Note * | -6,580Note * | -7,760Note * | -6,210Note * | -9,810Note * |
| Quebec | -5,430Note * | -2,710Note * | -8,160Note * | -7,440Note * | -5,930Note * | -8,870Note * | -11,990Note * | -11,130Note * | -13,250Note * |
| Ontario (ref.) | Note ...: not applicable | Note ...: not applicable | Note ...: not applicable | Note ...: not applicable | Note ...: not applicable | Note ...: not applicable | Note ...: not applicable | Note ...: not applicable | |
| Prairies | 2,230Note * | -220 | 4,760Note * | 2,830Note * | 1,390Note * | 4,200Note * | -420 | 370 | -1,160 |
| Alberta | 13,420Note * | 6,550Note * | 19,700Note * | 15,650Note * | 11,180Note * | 19,560Note * | 13,160Note * | 11,090Note * | 16,010Note * |
| British Columbia | -600Note * | -2,840Note * | 1,380Note * | 820Note * | -800Note * | 2,200Note * | -3,470Note * | -3,780Note * | -3,040Note * |
| Territories | 11,460Note * | 15,340Note * | 8,110Note * | 23,200Note * | 21,840Note * | 23,060Note * | 22,250Note * | 21,110Note * | 23,940Note * |
| Field of study (university degree) | |||||||||
| Science and science technology | Note ...: not applicable | Note ...: not applicable | Note ...: not applicable | Note ...: not applicable | Note ...: not applicable | Note ...: not applicable | 12,140Note * | 11,020Note * | 13,390Note * |
| Engineering and engineering technology | Note ...: not applicable | Note ...: not applicable | Note ...: not applicable | Note ...: not applicable | Note ...: not applicable | Note ...: not applicable | 33,020Note * | 33,160Note * | 34,580Note * |
| Mathematics and computer and information science | Note ...: not applicable | Note ...: not applicable | Note ...: not applicable | Note ...: not applicable | Note ...: not applicable | Note ...: not applicable | 22,500Note * | 19,560Note * | 24,580Note * |
| Business and administration | Note ...: not applicable | Note ...: not applicable | Note ...: not applicable | Note ...: not applicable | Note ...: not applicable | Note ...: not applicable | 22,130Note * | 18,340Note * | 26,310Note * |
| Arts and humanities (ref.) | Note ...: not applicable | Note ...: not applicable | Note ...: not applicable | Note ...: not applicable | Note ...: not applicable | Note ...: not applicable | Note ...: not applicable | Note ...: not applicable | Note ...: not applicable |
| Social and behavioural sciences | Note ...: not applicable | Note ...: not applicable | Note ...: not applicable | Note ...: not applicable | Note ...: not applicable | Note ...: not applicable | 9,200Note * | 7,160Note * | 12,720Note * |
| Legal professions and studies | Note ...: not applicable | Note ...: not applicable | Note ...: not applicable | Note ...: not applicable | Note ...: not applicable | Note ...: not applicable | 33,900Note * | 30,490Note * | 38,220Note * |
| Health care | Note ...: not applicable | Note ...: not applicable | Note ...: not applicable | Note ...: not applicable | Note ...: not applicable | Note ...: not applicable | 27,050Note * | 26,380Note * | 26,470Note * |
| Education and teaching | Note ...: not applicable | Note ...: not applicable | Note ...: not applicable | Note ...: not applicable | Note ...: not applicable | Note ...: not applicable | 12,110 | 12,060Note * | 10,930Note * |
| Trades, services, natural resources and conservation | Note ...: not applicable | Note ...: not applicable | Note ...: not applicable | Note ...: not applicable | Note ...: not applicable | Note ...: not applicable | 10,520Note * | 9,470Note * | 12,180Note * |
| Constant | 14,090Note * | 15,870Note * | 31,310Note * | 26,740Note * | 27,750Note * | 39,880Note * | 48,470Note * | 50,520Note * | 51,960Note * |
... not applicable
Source: Statistics Canada, 2016 Census of Population. |
|||||||||
The difference was particularly significant for young adults with an immigrant background from the Caribbean and Bermuda, and sub-Saharan Africa. More specifically, the predicted median earnings of individuals aged 30 to 34 with an immigrant background from the Caribbean and Bermuda were $5,350 lower than those of third- or higher-generation Canadians (Table 7). Among men, the difference was even greater: predicted median earnings of men aged 30 to 34 whose region of origin was the Caribbean and Bermuda were $10,220 lower than those of their counterparts whose region of origin was Canada, when the other factors considered were held constant. For men with an immigrant background from sub-Saharan Africa, the gap in earnings compared with their Canadian counterparts was $8,060, when other factors were taken into account.
Full-time, full-year employment earnings
Some of the earnings gaps can be explained by the likelihood of individuals from certain regions to work part-time (whether voluntary or not). By analyzing the earnings of those who worked full time, full year, we compare individuals in a similar situation in terms of hours and weeks worked in 2015.
In general and without taking into account differences in profiles, the median salary of youth with an immigrant background who worked full time, full year was $3,330 higher than that of individuals whose parents were born in Canada (Table 6). However, if we took into consideration that their level of education was higher for most regions of origin, the picture changed noticeably.
The example was particularly noteworthy among men with an immigrant background from East Asia (who, as we know, are among the most likely to have a university degree). For these individuals, the unadjusted annual earnings for full-time, full-year employment were $6,770 higher than those of third- or higher-generation Canadians (Table 6). In contrast, given equivalent levels of education and sociodemographic characteristics, their predicted earnings were $3,930 lowerthan those of third- or higher-generation Canadians (Table 7 and Chart 5A). In fact, for men from most regions of origin, adjusted median annual earnings were lower than those of Canadian-born parents individuals.

Data table for Chart 5a
| Region of origin | Observed difference | Adjusted difference |
|---|---|---|
| dollars | ||
| North America | 1,880 | -2,250 |
| Central America | -7,810 | -3,840 |
| Caribbean and Bermuda | -11,380 | -9,440 |
| South America | -4,420 | -4,630 |
| Western Europe | 3,580 | -950 |
| Eastern Europe | 3,840 | -1,750 |
| Northern Europe | 3,360 | -1,360 |
| Southern Europe | 2,450 | 1,480 |
| Sub-Saharan Africa | 1,200 | -5,140 |
| North Africa | 4,360 | 2,620 |
| Western and Central Asia and Middle East | 4,230 | -170 |
| East Asia | 6,770 | -3,930 |
| Southeast Asia | -2,950 | -6,590 |
| South Asia | 4,700 | -1,990 |
| Oceania and others | 510 | -4,980 |
| Source: Statistics Canada, 2016 Census of Population. | ||
The picture was not as clear where women were concerned. While women whose region of origin was Central America had lower adjusted earnings (-$2,720), this was not the case for women from the other regions of origin. In general, their median earnings were similar to or greater than those of third- or higher-generation Canadians (Chart 5B).
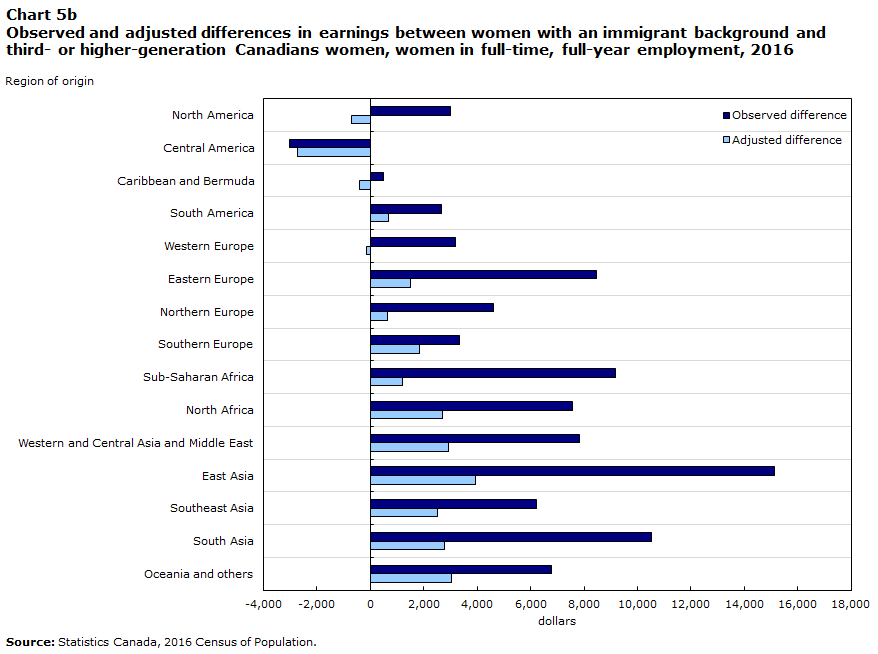
Data table for Chart 5b
| Region of origin | Observed difference | Adjusted difference |
|---|---|---|
| dollars | ||
| North America | 3,010 | -710 |
| Central America | -3,030 | -2,720 |
| Caribbean and Bermuda | 490 | -420 |
| South America | 2,670 | 680 |
| Western Europe | 3,180 | -130 |
| Eastern Europe | 8,450 | 1,500 |
| Northern Europe | 4,610 | 630 |
| Southern Europe | 3,320 | 1,850 |
| Sub-Saharan Africa | 9,180 | 1,190 |
| North Africa | 7,570 | 2,720 |
| Western and Central Asia and Middle East | 7,820 | 2,920 |
| East Asia | 15,120 | 3,950 |
| Southeast Asia | 6,230 | 2,520 |
| South Asia | 10,520 | 2,780 |
| Oceania and others | 6,800 | 3,050 |
| Source: Statistics Canada, 2016 Census of Population. | ||
Earnings of university graduates who work full time, full year, by field of study
The last indicator considered, in terms of labour market outcomes, is the annual earnings of university graduates who worked full time, full year.
As previously shown, youth with an immigrant background are more likely to choose a scientific field (STEM) for their university studies. These fields of study should lead to better-paying jobs (Wall et al. 2018) and therefore higher earnings among individuals with an immigrant background.
Without consideration of their field of study and their other characteristics, youth with an immigrant background who had a university degree and worked full time, full year had slightly higher earnings than their third- or higher-generation counterparts ($2,220 more; see Table 6 for unadjusted results). The positive difference was even greater among women with an immigrant background who graduated from university ($2,580 more).
After neutralizing the effect of the field of study in addition to the other sociodemographic characteristics, the picture remained similar for female university graduates from most regions of origin. These women’s annual earnings were similar to their counterparts whose parents were born in Canada, or even higher in the case of female university graduates from East Asia (+$2,260) and Southern Europe (+$1,830).
The picture was different for male university graduates and who worked full time, full year. The annual earnings of men in this group with an immigrant background were lower than those of their non-immigrant counterparts for 9 of the 15 regions of origin (Table 7). The greatest differences were recorded among university graduates whose region of origin was Central America (-$7,270), South America (-$6,970), the Caribbean and Bermuda (-$6,950) and Southeast Asia (-$6,160). Among men, the regions of origin for which employment earnings were closest to Canadians from the third generation or higher were Northern Europe, Southern Europe and North Africa.
A number of reasons can explain these gaps in annual earnings for male university graduates who worked full time, full year, by their region of origin, such as limited social networks and lack of ties within recognized businesses, discrimination, etc. Nevertheless, the objective of this study is not to shed light on these reasons, and the variables needed to conduct such an analysis are not necessarily included in the census.
That said, the labour market gaps qualify the generally positive picture in terms of the education outcomes of youth with an immigrant background. For an equivalent level of education (and equivalent field of study in the case of university graduates), young men with an immigrant background from most regions of origin have lower employment earnings than men whose parents were born in Canada. Such trends were, however, not observed among women.
Conclusion
This study confirmed an overall result seen in other studies—children with an immigrant background have better education outcomes than children of Canadian-born parents. Using integrated 2006 and 2016 census data, this study dug deeper into these general findings and analyzed the extent to which education and labour market outcomes of children with an immigrant background varied by region of origin, that is, where their parents were born.
The first question we wanted to answer was: “How do children with an immigrant background differ from one another in terms of education outcomes, by their region of origin and if we account for variations in their family and socioeconomic situations during childhood?”
In terms of high school education, children with an immigrant background from practically all regions of origin were more likely to have at least completed a high school diploma than children of Canadian-born parents. Children with an African and Asian immigrant background particularly stood out: their probability to succeed and graduate from high school was close to 100%. The differences between the regions of origin of youth with an immigrant background were relatively small, however, since the vast majority of youth graduate from high school.
At the university level, however, there were larger gaps between regions. After neutralizing the impact of the parents’ level of education, family income and family structure during adolescence, the predicted university graduation rates were lower among youth from the Caribbean and Bermuda (23% compared with 26% for youth born to Canadian parents).
In contrast, the adjusted predicted rates for earning a university degree were highest among youth with an immigrant background from North Africa (40%), Southeast Asia (40%), sub-Saharan Africa (42%), South Asia (53%) and East Asia (66%).
The parents’ level of education, the characteristic most closely associated with education outcomes, often had a lower incidence on youth with an immigrant background. When their parents had a relatively lower level of education, children with an immigrant background far exceeded children of Canadian-born parents in terms of university graduation rates. Factors not measured by the census can explain these persistent differences in favour of children with an immigrant background from certain regions compared with children of Canadian-born parents (e.g., greater aspirations and expectations from immigrant parents in terms of their children’s education).
The second research question was: “Do the benefits observed among children with an immigrant background, in terms of education outcomes, translate into measurable benefits on the labour market (employment and wages)?”
Results suggest that youth with an immigrant background from certain regions of origin had a lesser return on investment in their formal education. The full-time, full-year employment rates, adjusted by level of education, were therefore lower for young adults from North Africa, Western and Central Asia and Middle East, the Caribbean and Bermuda, sub-Saharan Africa, and Southern Asia than for those whose parents were born in Canada.
In terms of employment earnings (wages), those of women with an immigrant background were generally similar to those of women whose parents were born in Canada. The same was not true for men. At the same level of education, full-time, full-year employment earnings of men with an immigrant background were lower than those of third- or higher-generation Canadians, for many regions of origin. The disadvantages in terms of full-time employment earnings were particularly significant among men from the following regions of origin: Central America, the Caribbean and Bermuda, South America, sub-Saharan Africa, East Asia, Southeast Asia, and Oceania and others. Among university graduates, the adjusted employment earnings of men with an immigrant background who work full time were also lower than their third- or higher-generation counterparts, even when taking into account the fields of study, which vary depending on the region of origin.
The census does not measure the extent to which cultural factors or factors related to discrimination or to higher or lower aspirations by region are associated with education and labour market results. It also does not examine the scope and influence of knowledge networks or measure the number of years of experience in the labour market (including during postsecondary studies).
However, the study does help determine, within recent cohorts of youth with an immigrant background, which origin groups do better and which have more difficulties earning a high school, postsecondary and university qualification. More in-depth studies on the most at-risk groups would help to identify the challenges and opportunities that contribute to their success and difficulties.
| Type of diploma completed in 2016 | |||
|---|---|---|---|
| At least a high school diplomaTable A1 Note 1 | Postsecondary certificate, diploma or degreeTable A1 Note 2 | University degree (bachelor level or higher)Table A1 Note 2 | |
| percentage | |||
| Parents’ highest level of education | |||
| No certificate, diploma or degree | 77 | 46 | 12 |
| High school diploma | 89 | 59 | 21 |
| Postsecondary certificate or diploma below the bachelor level | 92 | 67 | 26 |
| Bachelor’s degree | 97 | 80 | 54 |
| University diploma, degree or certificate above the bachelor level | 98 | 83 | 63 |
| Income level (deciles) | |||
| First | 84 | 54 | 23 |
| Second | 86 | 57 | 22 |
| Third | 89 | 59 | 23 |
| Fourth | 90 | 63 | 25 |
| Fifth | 92 | 66 | 26 |
| Sixth | 94 | 68 | 30 |
| Seventh | 95 | 71 | 33 |
| Eighth | 96 | 73 | 37 |
| Ninth | 97 | 77 | 44 |
| Tenth | 98 | 82 | 58 |
| At least one parent works full-time | |||
| No | 85 | 41 | 14 |
| Yes | 94 | 53 | 22 |
| Dwelling in 2006 | |||
| Renter (reference) | 83 | 53 | 19 |
| Owner/value of dwelling less than $100,000 | 88 | 64 | 20 |
| Owner/value of dwelling between $100,000 and $250,000 | 93 | 69 | 30 |
| Owner/value of dwelling more than $250,000 | 97 | 75 | 46 |
| Type of family | |||
| Two married parents | 95 | 71 | 37 |
| Two common-law parents | 86 | 63 | 20 |
| Lone parent | 85 | 58 | 22 |
| Residential stability over the last five years | |||
| No | 91 | 63 | 29 |
| Yes | 93 | 71 | 35 |
| Type of area of residence | |||
| Rural | 89 | 64 | 22 |
| Census agglomeration | 90 | 64 | 26 |
| Census metropolitan area | 94 | 70 | 37 |
| Area of residence | |||
| Atlantic | 94 | 67 | 31 |
| Quebec | 88 | 75 | 26 |
| Ontario | 94 | 70 | 39 |
| Prairies | 91 | 55 | 29 |
| Alberta | 92 | 62 | 32 |
| British Columbia | 95 | 62 | 33 |
| Territories | 74 | 47 | 20 |
| English–French bilingualism | |||
| No | 91 | 65 | 29 |
| Yes | 96 | 79 | 45 |
| Sex | |||
| Boy | 90 | 62 | 25 |
| Girl | 94 | 75 | 41 |
|
|||
| Parents’ highest level of education | Socioeconomic situation of family | |||||
|---|---|---|---|---|---|---|
| High school diploma or less | Postsecondary certificate or diploma below the bachelor level | University degree (bachelor level or higher) | Median after-tax income of economic family | Parents own dwelling | At least one parent works full-time | |
| percentage | dollars | percentage | ||||
| Total | 23 | 46 | 30 | 66,960 | 82 | 91 |
| Region of origin | ||||||
| Canada | 24 | 50 | 26 | 68,740 | 84 | 92 |
| Other countries | 23 | 38 | 39 | 62,340 | 78 | 89 |
| Region of origin breakdown | ||||||
| Canada | 24 | 50 | 26 | 68,740 | 84 | 92 |
| North America | 16 | 37 | 47 | 74,010 | 84 | 93 |
| Central America | 40 | 38 | 21 | 54,610 | 67 | 87 |
| Caribbean and Bermuda | 22 | 57 | 20 | 55,600 | 65 | 84 |
| South America | 27 | 46 | 27 | 60,870 | 71 | 90 |
| Western Europe | 14 | 48 | 39 | 70,360 | 85 | 93 |
| Eastern Europe | 11 | 39 | 50 | 60,340 | 75 | 93 |
| Northern Europe | 18 | 46 | 36 | 78,320 | 88 | 94 |
| Southern Europe | 34 | 41 | 25 | 72,310 | 87 | 93 |
| Sub-Saharan Africa | 18 | 41 | 41 | 61,790 | 62 | 81 |
| North Africa | 9 | 30 | 62 | 57,480 | 61 | 83 |
| Western and Central Asia and Middle East | 25 | 32 | 43 | 47,030 | 66 | 79 |
| East Asia | 23 | 24 | 52 | 51,150 | 81 | 85 |
| Southeast Asia | 27 | 35 | 38 | 63,170 | 79 | 90 |
| South Asia | 26 | 26 | 47 | 56,080 | 78 | 91 |
| Oceania and others | 28 | 47 | 25 | 70,540 | 83 | 93 |
| Sources: Statistics Canada, integrated 2006 and 2016 census data. | ||||||
| Family situation | Area of residence | Cultural capital | ||||||
|---|---|---|---|---|---|---|---|---|
| Two married parents | Common-law | Lone parent | Residential stability over the last five years | Rural | Census agglomeration | Census metropolitan area | English–French bilingualism | |
| percentage | ||||||||
| Total | 73 | 10 | 17 | 66 | 18 | 12 | 69 | 20 |
| Region of origin | ||||||||
| Canada | 69 | 13 | 18 | 70 | 24 | 16 | 60 | 19 |
| Other countries | 80 | 4 | 16 | 56 | 5 | 5 | 90 | 22 |
| Region of origin breakdown | ||||||||
| Canada | 69 | 13 | 18 | 70 | 24 | 16 | 60 | 19 |
| North America | 77 | 7 | 17 | 68 | 18 | 13 | 69 | 23 |
| Central America | 72 | 8 | 19 | 54 | 17 | 12 | 71 | 23 |
| Caribbean and Bermuda | 55 | 5 | 41 | 56 | 2 | 2 | 96 | 24 |
| South America | 72 | 7 | 21 | 54 | 3 | 3 | 94 | 20 |
| Western Europe | 76 | 8 | 16 | 68 | 20 | 12 | 68 | 25 |
| Eastern Europe | 83 | 4 | 13 | 51 | 3 | 3 | 94 | 27 |
| Northern Europe | 78 | 5 | 17 | 66 | 11 | 11 | 79 | 18 |
| Southern Europe | 84 | 3 | 12 | 69 | 2 | 3 | 94 | 23 |
| Sub-Saharan Africa | 70 | 3 | 26 | 51 | 3 | 3 | 94 | 24 |
| North Africa | 84 | 2 | 13 | 51 | 1 | 2 | 97 | 48 |
| Western and Central Asia and Middle East | 86 | 1 | 13 | 44 | 2 | 2 | 96 | 33 |
| East Asia | 86 | 2 | 12 | 52 | 1 | 2 | 97 | 17 |
| Southeast Asia | 81 | 4 | 15 | 54 | 1 | 4 | 95 | 17 |
| South Asia | 94 | 1 | 5 | 43 | 1 | 2 | 97 | 17 |
| Oceania and others | 78 | 3 | 19 | 65 | 8 | 8 | 84 | 15 |
| Sources: Statistics Canada, integrated 2006 and 2016 census data. | ||||||||
| Area of residence in 2006 | |||||||
|---|---|---|---|---|---|---|---|
| Atlantic | Quebec | Ontario | Prairies | Alberta | British Columbia | Territories | |
| percentage | |||||||
| Total | 7 | 24 | 40 | 7 | 10 | 11 | 0 |
| Region of origin | |||||||
| Canada | 9 | 29 | 34 | 8 | 11 | 9 | 0 |
| Other countries | 2 | 15 | 55 | 4 | 9 | 16 | 0 |
| Region of origin breakdown | |||||||
| Canada | 9 | 29 | 34 | 8 | 11 | 9 | 0 |
| North America | 9 | 12 | 42 | 5 | 13 | 18 | 0 |
| Central America | 1 | 24 | 43 | 11 | 12 | 10 | 0 |
| Caribbean and Bermuda | 1 | 24 | 66 | 2 | 3 | 4 | 0 |
| South America | 0 | 20 | 63 | 6 | 6 | 5 | 0 |
| Western Europe | 4 | 24 | 39 | 5 | 12 | 15 | 0 |
| Eastern Europe | 1 | 14 | 62 | 5 | 9 | 9 | 0 |
| Northern Europe | 3 | 3 | 56 | 5 | 13 | 18 | 0 |
| Southern Europe | 1 | 17 | 69 | 3 | 4 | 7 | 0 |
| Sub-Saharan Africa | 1 | 14 | 57 | 4 | 10 | 13 | 0 |
| North Africa | 1 | 63 | 29 | 2 | 4 | 2 | 0 |
| Western and Central Asia and Middle East | 2 | 27 | 53 | 2 | 8 | 8 | 0 |
| East Asia | 1 | 7 | 47 | 2 | 10 | 33 | 0 |
| Southeast Asia | 1 | 11 | 48 | 7 | 14 | 19 | 0 |
| South Asia | 0 | 6 | 66 | 2 | 6 | 20 | 0 |
| Oceania and others | 0 | 2 | 16 | 5 | 16 | 60 | 1 |
| Sources: Statistics Canada, integrated 2006 and 2016 census data. | |||||||
| Region of origin breakdown | Median after-tax income of economic family | Parents’ level of education (university diploma or degree or higher) | Parents own dwelling | Lives with married parents | Residential stability over the last five years | Lives in a CMA | Does not live in Quebec | English–French bilingualism |
|---|---|---|---|---|---|---|---|---|
| Difference between the average for the region of origin and the average for all children | ||||||||
| dollars | gap between totals in percentage points | |||||||
| Canada | 1,200 | -4 | 2 | -3 | 4 | -9 | -4 | -1 |
| North America | 2,900 | 17 | 2 | 4 | 2 | 0 | 12 | 3 |
| Central America | -7,900 | -9 | -16 | 0 | -12 | 2 | 1 | 3 |
| Caribbean and Bermuda | -5,100 | -10 | -17 | -18 | -10 | 27 | 0 | 4 |
| South America | -3,300 | -3 | -11 | 0 | -12 | 24 | 4 | 0 |
| Western Europe | 1,200 | 8 | 2 | 4 | 2 | -1 | 0 | 5 |
| Eastern Europe | -1,600 | 20 | -7 | 11 | -15 | 25 | 10 | 7 |
| Northern Europe | 5,100 | 6 | 6 | 6 | 0 | 9 | 21 | -2 |
| Southern Europe | 1,900 | -6 | 5 | 12 | 3 | 25 | 7 | 3 |
| Sub-Saharan Africa | -3,800 | 11 | -20 | -2 | -14 | 25 | 10 | 5 |
| North Africa | -5,500 | 32 | -21 | 12 | -14 | 27 | -38 | 28 |
| Western and Central Asia and Middle East | -11,000 | 13 | -16 | 13 | -22 | 27 | -2 | 14 |
| East Asia | -7,200 | 22 | -1 | 14 | -13 | 28 | 17 | -2 |
| Southeast Asia | -3,700 | 8 | -3 | 8 | -12 | 26 | 14 | -2 |
| South Asia | -7,800 | 17 | -4 | 21 | -23 | 27 | 19 | -3 |
| Oceania and others | 500 | -5 | 1 | 5 | -1 | 15 | 22 | -4 |
| Sources: Statistics Canada, integrated 2006 and 2016 census data. | ||||||||
References
Abada, Teresa, Feng Hou and Bali Ram. 2009. “Ethnic Differences in Educational Attainment among the Children of Canadian Immigrants,” Canadian Journal of Sociology, Vol. 34, no. 1, p. 1 to 28.
Abada, Teresa, Kristyn Frank and Feng Hou. 2018. “Between Two Worlds: Source-Country Gender Roles and Gender Differences in Educational Attainment among Immigrant Children,” Sociological Inquiry, Vol. 88, no. 1, p. 131 to 154.
Astone, Nan and Sara S. McLanahan. 1991. “Family Structure, Parental Practices and High School Completion,” American Sociological Review, Vol. 56, no. 3, p. 309 to 320.
Boyd, Monica. 2016. “Educational and Labor Market Attainments of the 1.5- and Second-Generation Children of East Asian Immigrants in Canada,” American Behavioral Scientist, Vol. 60, no. 5-6, p. 705 to 729
Chen Wen-Hao and Feng Hou. 2019. Intergenerational Education Mobility and Labour Market Outcomes: Variation Among the Second Generation of Immigrants in Canada, Analytical Studies Branch Research Paper Series, no. 418. Statistics Canada Catalogue no. 11F0019M, Ottawa, Ontario.
Childs, Stephen, Ross Finnie and Richard E. Mueller. 2017. “Why Do So Many Children of Immigrants Attend University? Evidence for Canada,” Journal of International Migration and Integration, Vol. 18, no. 1, p. 1 to 28.
Childs, Stephen, Ross Finnie and Richard E. Mueller. 2018. “Assessing the Importance of Cultural Capital on Post-Secondary Education Attendance in Canada,” Journal of Further and Higher Education, Vol. 42, no. 1, p. 57 to 91.
Croll, Paul. 2004. “Families, Social Capital and Educational Outcomes,” British Journal of Educational Studies, Vol. 52, no. 4, p. 390 to 416.
Devor, Camron S., Susan D. Stewart and Cassandra Dorius. 2018. “Parental Divorce, Social Capital, and Postbaccalaureate Educational Attainment Among Young Adults,” Journal of Family Issues, Vol. 39, no. 10.
Dumais, Susan A. 2002. “Cultural Capital, Gender, and School Success: The Role of Habitus,” Sociology of Education, Vol. 75, no. 1, p. 44 to 68.
Feliciano, Cynthia and Yader R. Lanuza. 2015. “The Immigrant Advantage in Adolescent Educational Expectations,” International Migration Review,Vol. 50, p. 758 to 792.
Feliciano, Cynthia. 2005. “Does Selective Migration Matter? Explaining Ethnic Disparities in Educational Attainment among Immigrants’ Children,” International Migration Review,Vol. 39, no. 4, p. 841 to 871.
Feliciano, Cynthia. 2006. “Beyond the Family: The Influence of Premigration Group Status on the Educational Expectations of Immigrants’ Children,” Sociology of Education, Vol. 79, no. 4, p. 281 to 303.
Frenette, Marc. 2002. “Too Far to Go on? Distance to School and University Participation,” no. 191, Statistics Canada Catalogue no. 11F0019MIF, Ottawa, Ontario.
Frenette, Marc. 2017. “Investments in Registered Education Savings Plans and Postsecondary Attendance,” Economic Insights, no. 071, Statistics Canada Catalogue no. 11 - 626-X, Ottawa, Ontario.
Gasper, Joseph, Stefanie DeLuca and Angela Estacion. 2012. “Switching Schools: Revisiting the Relationship Between School Mobility and High School Dropout,” American Educational Research Association, Vol. 49, no. 3, p. 487 to 519.
Goyette, Kimberly and Yu Xie. 1999. “Educational Expectations of Asian-American Youth: Determinants and Ethnic Differences,” Sociology of Education, Vol. 72, no. 1, p. 22 to 36.
Haelermans, Carla and Kristof De Witte. 2015. “Does Residential Mobility Improve Educational Outcomes? Evidence from the Netherlands,” Social Science Research, Vol. 52, no. 1, p. 351 to 369.
Hango, Darcy. 2013. “Gender differences in science, technology, engineering, mathematics and computer science (STEM) programs at university,” Insights on Canadian Society, Statistics Canada Catalogue no. 75 -006-X, Ottawa, Ontario.
Kamanzi, Pierre Canisius, Nicolas Bastien, Pierre Doray and Marie-Odile Magnan. 2016. “Immigration et cheminements scolaires aux études supérieures au Canada : qui y va et quand? Une analyse longitudinale à partir du modèle de Cox,” Canadian Journal of Higher Education/Revue canadienne d’enseignement supérieur, Vol. 46, no. 2, p. 225 to 248.
Krahn, Harvey and Alison Taylor. 2005. “Resilient Teenagers: Explaining the High Educational Aspirations of Visible-Minority Youth in Canada,” Journal of International Migration and Integration, Vol. 6, no. 3 to 4, p. 405 to 434.
McLanahan, Sara S. and Christine Percheski. 2008. “Family Structure and the Reproduction of Inequalities,” Annual Review of Sociology, Vol. 34, no. 1, p. 257 to 276.
OECD. 2017. Catching Up? Intergenerational Mobility and Children of Immigrants, OECD Publishing, Paris.
Oreopoulos, Philip. 2011. “Why Do Skilled Immigrants Struggle in the Labor Market? A Field Experiment with Thirteen Thousand Resumes,” American Economic Journal: Economic Policy, Vol. 3, no. 4, p. 148 to 171.
Picot, Garnett and Feng Hou. 2013. “Why Immigrant Background Matters for University Participation: A Comparison of Switzerland and Canada,” International Migration Review, Vol. 47, no. 3, p. 612 to 642.
Picot, Garnett, Feng Hou and Hanqing Qiu. 2016. “The Human Capital Model of Selection and Immigrant Economic Outcomes,” International Migration, Vol. 54, no. 3, p. 73 to 88.
Portes, Alejandro and Dag MacLeod. 1999. “Educating the Second Generation: Determinants of Academic Achievement Among Children of Immigrants in the United States,” Journal of Ethnic and Migration Studies, Vol. 25, no. 3, p. 373 to 396.
Portes, Alejandro, Patricia Fernandez-Kelly and William Haller. 2009. “The Adaptation of the Immigrant Second Generation in America: A Theoretical Overview and Recent Evidence,” Journal of Ethnic and Migration Studies, Vol. 35, no. 7, p. 1077 to 1104.
Portes, Alejandro, Rosa Aparicio, William Haller and Erik Vickstrom. 2010. “Moving ahead in Madrid: Aspirations and Expectations in the Spanish Second Generation,” International Migration Review, Vol. 44, no. 4, p. 767 to 801.
Somerville, Kara and Oral Robinson. 2016. “Keeping Up Appearances Within the Ethnic Community: A Disconnect between First and Second Generation South Asians’ Educational Aspirations,” Canadian Ethnic Studies, Vol. 48, no. 2, p. 99 to 118.
Statistics Canada. 2017a. “Children with an immigrant background: Bridging cultures,” Census of population, 2016, Statistics Canada Catalogue no. 98 - 200-X2016015, Ottawa, Ontario.
Statistics Canada. 2017b. Education in Canada: Key results from the 2016 Census, Statistics Canada Catalogue no. 11 -001-X, Ottawa, Ontario.
Uppal, Sharanjit. 2017. “Young men and women without a high school diploma,” Insights on Canadian Society, Statistics Canada Catalogue no. 75 -006-X, Ottawa, Ontario.
Wall, Katherine, John Zhao, Sarah-Jane Ferguson and Carlos Rodriguez. 2018. “2016 Census results: Is field of study a factor in the payoff of a graduate degree?” Insights on Canadian Society, Statistics Canada Catalogue no. 75-006-X, Ottawa, Ontario.
Wu, Zheng, Christoph M. Schimmele and Feng Hou. 2015. “Family Structure, Academic Characteristics, and Postsecondary Education,” Family Relations, Vol. 64, no. 2, p. 205 to 220.
Zafira, David. 2012. “Persistent Inequality of Liberation from Social Origins? Determining Who Attends Graduate and Professional Schools in Canada’s Expanded Postsecondary System,” Canadian Review of Sociology, Vol. 49, no. 2, p. 109 to 137.
Zhou, Min. 1997. “Segmented Assimilation: Issues, Controversies and Recent Research on the New Second Generation,” International Migration Review, Vol. 31, no. 4, p. 975 to 1008.
- Date modified: