Inuit in Canada – Projections to 2041
Archived Content
Information identified as archived is provided for reference, research or recordkeeping purposes. It is not subject to the Government of Canada Web Standards and has not been altered or updated since it was archived. Please "contact us" to request a format other than those available.

Description: Inuit in Canada – Projections to 2041
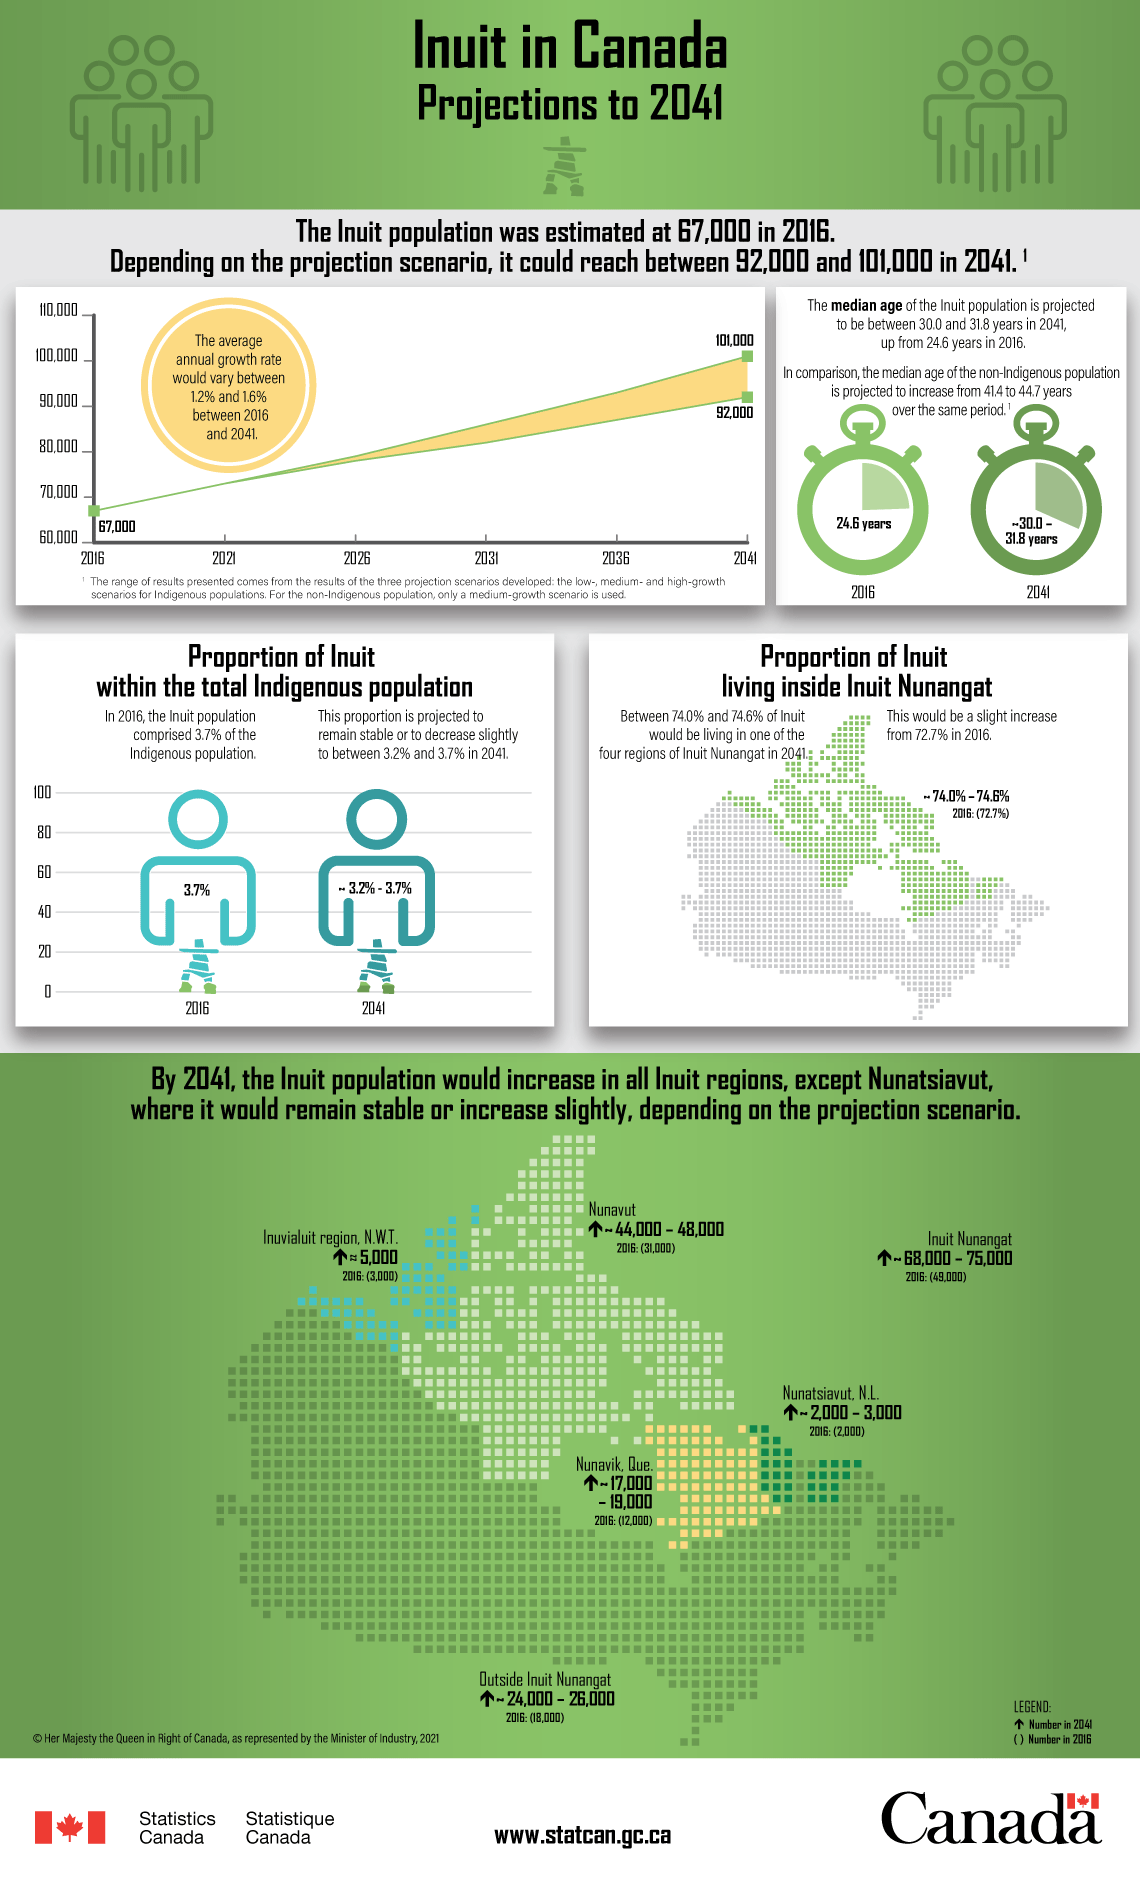
The Inuit population was estimated at 67,000 in 2016. Depending on the projection scenario, it could reach between 92,000 and 101,000 in 2041.Note 1 The average annual growth rate would vary between 1.2% and 1.6% between 2016 and 2041.
| Year | Inuit population, estimated (2016) and projected (2021 to 2041) |
|---|---|
| 2016 | 67,000 |
| 2021 | Between 73,000 and 73,000 |
| 2026 | Between 78,000 and 79,000 |
| 2031 | Between 82,000 and 86,000 |
| 2036 | Between 87,000 and 93,000 |
| 2041 | Between 92,000 and 101,000 |
The median age of the Inuit population is projected to be between 30.0 and 31.8 years in 2041, up from 24.6 years in 2016. In comparison, the median age of the non-Indigenous population is projected to increase from 41.4 to 44.7 years over the same period.Note 1
Proportion of Inuit within the total Indigenous population
In 2016, the Inuit population comprised 3.7% of the Indigenous population. This proportion is projected to remain stable or to decrease slightly to between 3.2% and 3.7% in 2041.
Proportion of Inuit living inside Inuit Nunangat
Between 74.0% and 74.6% of Inuit would be living in one of the four regions of Inuit Nunangat in 2041. This would be a slight increase from 72.7% in 2016.
By 2041, the Inuit population would increase in all Inuit regions, except Nunatsiavut, where it would remain stable or increase slightly, depending on the projection scenario.
| Region | Inuit population | ||
|---|---|---|---|
| Estimated in 2016 | Projected in 2041 | Change between 2016 and 2041 | |
| Total - Inuit Nunangat | 49,000 | Between 68,000 and 75,000 | Increase |
| Nunatsiavut (Newfoundland and Labrador) | 2,000 | Between 2,000 and 3,000 | Stability or increase depending on the scenario |
| Nunavik (Quebec) | 12,000 | Between 17,000 and 19,000 | Increase |
| Nunavut | 31,000 | Between 44,000 and 48,000 | Increase |
| Inuvialuit region (Northwest Territories) | 3,000 | Approximately 5,000 | Increase |
| Outside Inuit Nunangat | 18,000 | Between 24,000 and 26,000 | Increase |
Source: Statistics Canada, Centre for Demography, Demosim 2021.
- Date modified:
