
Métis in Canada – Projections to 2041

Archived Content
Information identified as archived is provided for reference, research or recordkeeping purposes. It is not subject to the Government of Canada Web Standards and has not been altered or updated since it was archived. Please "contact us" to request a format other than those available.
Description: Métis in Canada – Projections to 2041
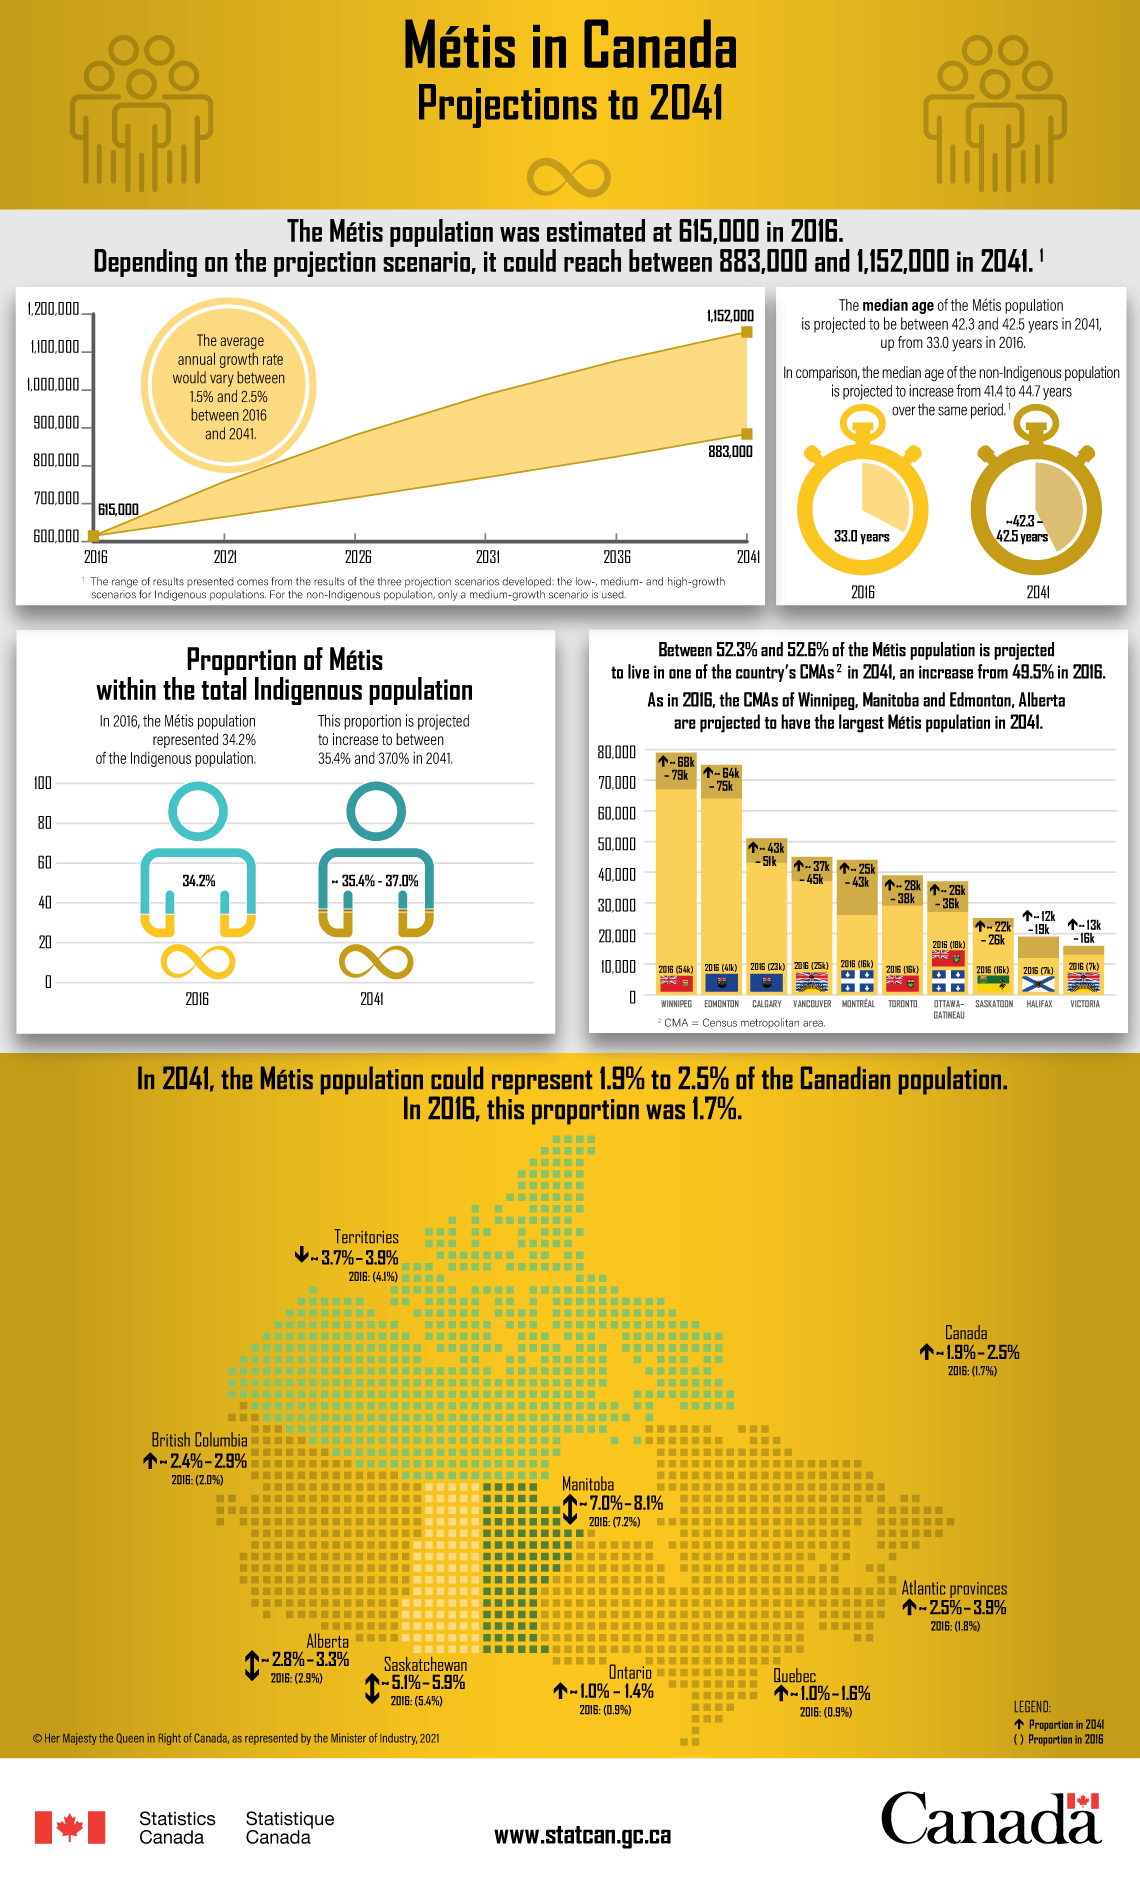
The Métis population was estimated at 615,000 in 2016. Depending on the projection scenario, it could reach between 883,000 and 1,152,000 in 2041.Note 1 The average annual growth rate would vary between 1.5% and 2.5% between 2016 and 2041.
| Year | Métis population, estimated (2016) and projected (2021 to 2041) |
|---|---|
| 2016 | 615,000 |
| 2021 | Between 665,000 and 758,000 |
| 2026 | Between 716,000 and 880,000 |
| 2031 | Between 769,000 and 986,000 |
| 2036 | Between 824,000 and 1,076,000 |
| 2041 | Between 883,000 and 1,152,000 |
The median age of the Métis population is projected to be between 42.3 and 42.5 years in 2041, up from 33.0 years in 2016. In comparison, the median age of the non-Indigenous population is projected to increase from 41.4 to 44.7 years over the same period.Note 1
Proportion of Métis within the total Indigenous population
In 2016, the Métis population represented 34.2% of the Indigenous population. This proportion is projected to increase to between 35.4% and 37.0% in 2041.
Between 52.3% and 52.6% of the Métis population is projected to live in one of the country’s CMAsNote 2 in 2041, an increase from 49.5% in 2016. As in 2016, the CMAs of Winnipeg, Manitoba and Edmonton, Alberta are projected to have the largest Métis population in 2041.
| CMA | Métis population | ||
|---|---|---|---|
| Estimated in 2016 | Projected in 2041 | Change between 2016 and 2041 | |
| Winnipeg, Manitoba | 54,000 | Between 68,000 and 79,000 | Increase |
| Edmonton, Alberta | 41,000 | Between 64,000 and 75,000 | Increase |
| Calgary, Alberta | 23,000 | Between 43,000 and 51,000 | Increase |
| Vancouver, British Columbia | 25,000 | Between 37,000 and 45,000 | Increase |
| Montréal, Quebec | 16,000 | Between 25,000 and 43,000 | Increase |
| Toronto, Ontario | 16,000 | Between 28,000 and 38,000 | Increase |
| Ottawa–Gatineau, Ontario and Quebec | 18,000 | Between 26,000 and 36,000 | Increase |
| Saskatoon, Saskatchewan | 16,000 | Between 22,000 and 26,000 | Increase |
| Halifax, Nova Scotia | 7,000 | Between 12,000 and 19,000 | Increase |
| Victoria, British Columbia | 7,000 | Between 13,000 and 16,000 | Increase |
In 2041, the Métis population could represent 1.9% to 2.5% of the Canadian population. In 2016, this proportion was 1.7%.
| Region | Proportion of Métis in the total population | ||
|---|---|---|---|
| Estimated in 2016 | Projected in 2041 | Change between 2016 and 2041 | |
| Canada | 1.7% | Between 1.9% and 2.5% | Increase |
| Atlantic provinces | 1.8% | Between 2.5% and 3.9% | Increase |
| Quebec | 0.9% | Between 1.0% and 1.6% | Increase |
| Ontario | 0.9% | Between 1.0% and 1.4% | Increase |
| Manitoba | 7.2% | Between 7.0% and 8.1% | Increase or decrease depending on the scenario |
| Saskatchewan | 5.4% | Between 5.1% and 5.9% | Increase or decrease depending on the scenario |
| Alberta | 2.9% | Between 2.8% and 3.3% | Increase or decrease depending on the scenario |
| British Columbia | 2.0% | Between 2.4% and 2.9% | Increase |
| Territories | 4.1% | Between 3.7% and 3.9% | Decrease |
Source: Statistics Canada, Centre for Demography, Demosim 2021.
- Date modified: