Canada in 2041: A larger, more diverse population with greater differences between regions
Archived Content
Information identified as archived is provided for reference, research or recordkeeping purposes. It is not subject to the Government of Canada Web Standards and has not been altered or updated since it was archived. Please "contact us" to request a format other than those available.
Released: 2022-09-08
Today, Statistics Canada's Centre for Demography is releasing a new set of detailed demographic projections to 2041 on immigration and ethnocultural diversity for Canada and its regions. These new projections reflect the targets of the 2022–2024 Immigration Levels Plan released by Immigration, Refugees and Citizenship Canada in February 2022, as well as the most recent demographic developments, including those related to the COVID-19 pandemic. Population projections for the various racialized groups are now available for Canada, the provinces, the territories, and each of the country's large metropolitan areas.
In 2041, if current trends continue, half of the Canadian population will be made up of immigrants and their Canadian-born children
According to the reference scenario, the Canadian population would reach 47.7 million in 2041, and 25.0 million of them would be immigrants or children of immigrants born in Canada, accounting for 52.4% of the total population. In 2016, this population was 14.4 million and accounted for 40.0% of the total Canadian population.
The projected percentage in 2041 could range from 49.8% to 54.3% depending on the projection scenario. Several scenarios are proposed to reflect uncertainty about the future evolution of demographic components and to measure the sensitivity of projections to certain factors. For more information on the scenarios and concepts used for these projections, please read the Note to readers.
A record-high proportion of immigrants in the Canadian population in 2041
As demonstrated by the most recent demographic projections for Canada released on August 22, 2022, immigration is projected to remain the main driver of population growth over the coming decades, continuing a trend that began in the early 1990s.
As a result, in 2041, the proportion of immigrants in the Canadian population could reach from 29.1% to 34.0%, depending on the selected scenario, up from 21.9% in 2016. This would be a record-high level since the 1867 Canadian Confederation.
In 2041, 1 in 4 Canadians will be born in Asia or Africa
The portrait of the immigrant population has changed a great deal over the past 25 years, partly because of differences in the geographic origin of immigrants. Considering these trends and the fact that population growth in the coming decades will depend primarily on international immigration, the Canadian population in 2041 is projected to include 9.9 million to 13.9 million people born in Asia or Africa, depending on the projection scenario. These people alone could account for 23.1% to 26.9% of the total Canadian population in 2041, up from 13.5% in 2016.
In 2041, about 2 in 5 Canadians will be part of a racialized group
The concept of "racialized" population is derived directly from the "visible minority group" variable and therefore refers to the persons belonging to a visible minority group (for more information, see the Note to readers). This information has been collected by Statistics Canada since the 1996 Census of Population to implement the Employment Equity Act, which aims to address discrimination in the hiring of certain groups (women, Indigenous peoples, persons with disabilities, and members of a racialized group).
Since 1996, the racialized population in Canada has been steadily increasing. In 2016, it consisted of 8.0 million people. By 2041, the racialized population could reach 16.4 million to 22.3 million people depending on the projection scenario. The racialized population could therefore account for 38.2% to 43.0% of the Canadian population. In 2016, this proportion was 22.2%.
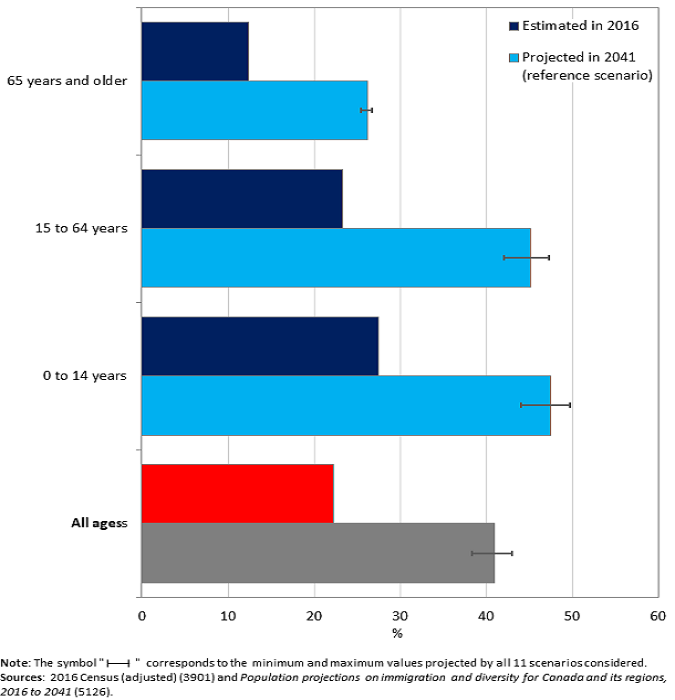
The projected proportion of the population belonging to a racialized group is higher among youth
The proportion of the racialized population and the projected rate of increase of this proportion vary from one age group to another. Depending on the projection scenario, the racialized population would account for a higher proportion among young cohorts, reaching between 44.0% and 49.7% among those aged 0 to 14. Among the working-age population (15 to 64 years), of special interest for the application of the Employment Equity Act, the proportion of the racialized population would be between 42.1% and 47.3% in 2041, up from 23.3% in 2016. Lastly, among the population aged 65 or older, this proportion would remain below the national average and would be between 25.4% and 26.7% in 2041. However, the rate of increase would be fastest in this last age group, the proportion more than doubling over the projected period.
Progeny born in Canada to persons belonging to a racialized group is an important factor in the growth of the projected racialized population
The projected increase of the proportion of the population belonging to a racialized group is largely related to the increase in the immigrant population, as well as that of their Canadian-born children. This projected increase is significant not only among those born in Canada to at least one immigrant parent (the second-generation population), but also among the population born in Canada to parents who themselves were born in Canada (third generation or more).
The second-generation racialized population is projected to more than double from 2.2 million in 2016 to between 4.8 million and 6.3 million in 2041, depending on the projection scenario. As for the racialized population in the third generation or more, which was 283,000 people in 2016, it would rise even faster in the coming years and could reach 770,000 to 867,000 by 2041.
These projection results highlight an important aspect of Canada's demographic dynamic—the Canadian-born descendants of racialized people are a major factor in the growth of the racialized population. The ethnocultural diversity of the Canadian population is therefore expected to increase in the coming years, regardless of future immigration levels.
In 2041, the Black population would surpass the Chinese population
It should be noted that the racialized population, like the rest of the Canadian population, is not a homogeneous group. It is made up of several groups that, defined for the purposes of the Employment Equity Act, are themselves diversified in many respects.
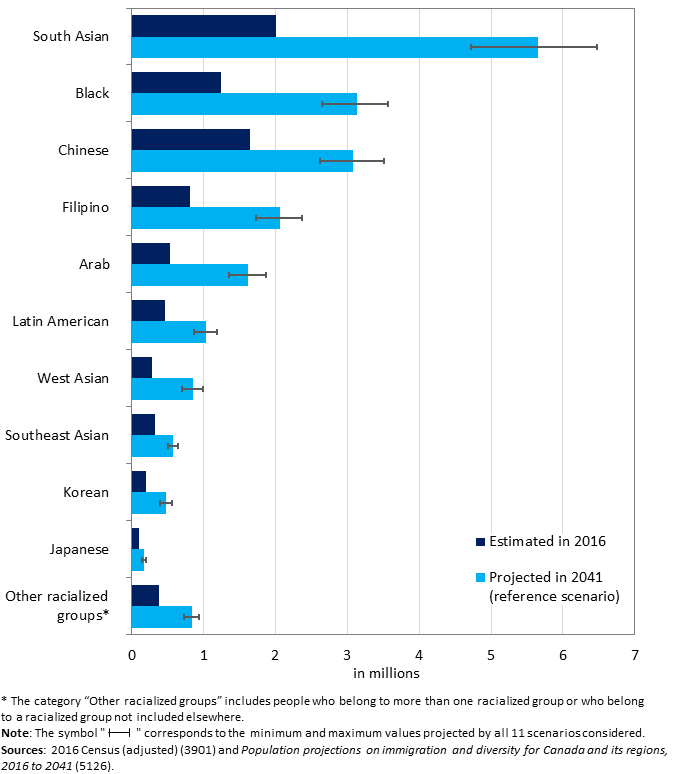
Among these racialized groups, the South Asian group would remain the largest population group in 2041, reaching between 4.7 million and 6.5 million people according to the various projection scenarios developed.
The Black population would more than double from 1.2 million people in 2016 to more than 3.0 million people in 2041, according to the reference scenario. For the first time, the Black population would be larger than the Indigenous population in Canada, as well as the population belonging to the Chinese group.
Although they form smaller populations, Western Asians and Arabs are the racialized groups that would grow the fastest, with an average annual growth rate over the period from 2016 to 2041 that could range between 3.8% and 5.2% and between 3.7% and 5.1%, respectively.
From 2016 to 2041, the average annual growth rate of the racialized population, all groups combined, would be between 2.9% and 4.2%, well above the average annual growth rate of the Canadian population as a whole (between 0.7% and 1.5%).
Canada, a nation of contrasts today and even more so tomorrow
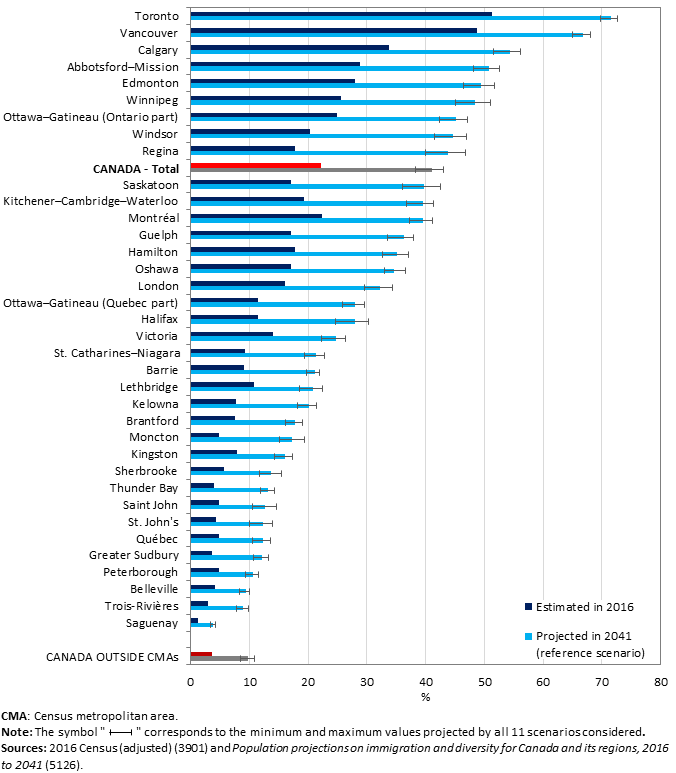
The ethnocultural mosaic differs significantly across the country, and current gaps are projected to widen over the coming years.
Although increasing in all regions of the country, the proportion of the racialized population would remain significantly higher in Canada's census metropolitan areas (CMAs), regardless of the projection scenario. This proportion would be above the national average (over 41%) in Toronto, Vancouver, Calgary, Abbotsford–Mission, Edmonton, Winnipeg, Ottawa–Gatineau (Ontario part), Windsor, and Regina—all these CMAs are in Ontario or in the centre and west of the country.
Conversely, the proportion of the racialized population would be below the national average in eastern Canada, Quebec, most of Ontario's and other provinces' CMAs, and rural areas across Canada.
Immigrants would continue to be concentrated in Toronto, Montréal and Vancouver
In 2016, the immigrant population was concentrated in Canada's largest cities. In 2041, the vast majority of the immigrant population would continue to live in a CMA, while Toronto, Montréal, and Vancouver would remain the three primary areas of residence of immigrants.
This obvious contrast between the country's urban and rural regions is reminiscent of some of the current challenges arising from their specific demographic dynamic, including not only pressures on the housing market and the development of urban infrastructure, but also the loss of the demographic weight of the country's rural regions.
In 2041, 4 out of 5 Torontonians will be foreign-born or born to immigrant parents
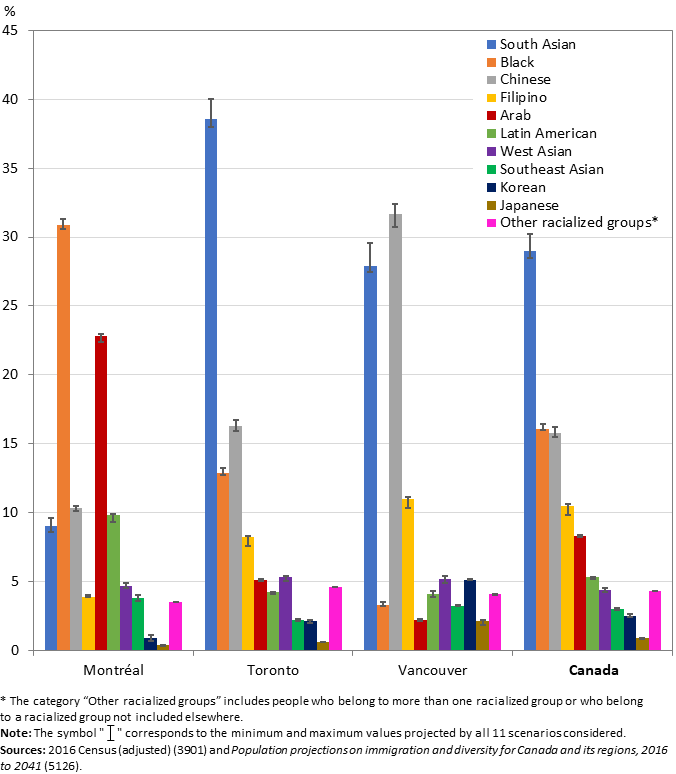
The Greater Toronto Area would continue to be the country's most populous metropolitan area and the home of the largest number of immigrants. Among the racialized population, the South Asian group would continue to be the largest. Depending on the projection scenario, this racialized group could number between 2.3 million and 3.2 million, up from 1.0 million in 2016. The South Asian group alone would account for 38.6% of Toronto's total racialized population in 2041, according to the reference scenario.
The projected portrait of diversity varies greatly by region
The Montréal and Vancouver metropolitan areas would continue to be Canada's most populous urban agglomerations to the east and west of Toronto, respectively. However, the ethnocultural mosaic of these three metropolitan areas would be significantly different in 2041.
In Montréal, the main racialized group would continue to be the Black population, which would double from 276,000 people in 2016 to 673,000 people according to the reference scenario. Arabs would continue to be the second-largest group, rising from 194,000 people in 2016 to 496,000 people under the reference scenario. According to the reference scenario, these two groups would account for 30.9% and 22.8%, respectively, of the total racialized population of Montréal in 2041.
In Vancouver, Chinese (which is the largest racialized group) numbered 504,000 in 2016, and, depending on the projection scenario, would reach between 737,000 and 972,000 in 2041. This would be followed by South Asians, which would number between 638,000 and 859,000 in 2041, up from 308,000 in 2016. According to the reference scenario, these two groups would account for 31.7% and 27.9%, respectively, of the total racialized population of Vancouver in 2041.
The data visualization product Population projections on immigration and diversity: Interactive Dashboard provides the results of the population projections for the different racialized groups for each of Canada's 35 large cities (CMAs) and for provinces and territories. Projections are also available for the outside-CMA area of each province and territory.
Today's release makes new public projections of the immigrant population and the racialized population covering the period from 2016 to 2041. They highlight the significant contrasts that exist in Canada, both geographically and in terms of the characteristics of racialized Canadians, whether they have immigrated to or were born in Canada. These projections provide relevant information to properly capture some of the substantial changes that are occurring and transforming the social fabric of Canadian communities. They show that the demographic dynamic of Canadian communities is intimately linked to a process of ethnocultural diversification of the population. The projections show that this relative increase in the number of Canadians with diverse backgrounds and cultural influences is expected to continue over time. These projections reflect Statistics Canada's commitment to providing a more detailed portrait of the future Canadian population through the use of disaggregated data. On October 26, 2022, Statistics Canada will release results of the 2021 Census of Population that will provide a comprehensive statistical portrait of the ethnocultural and religious composition of Canada's population and communities from coast to coast to coast.
Note to readers
These projection results are based on data from the 2016 Census of Population, which were adjusted to account for, among other things, the census net undercoverage. Because of these adjustments, the figures presented here for 2016 may differ from those obtained directly from the 2016 Census.
These projections were generated using Demosim, Statistics Canada's microsimulation demographic projection model.
These projections are not predictions, but rather an exercise designed to provide a portrait of what the Canadian population might be in the coming years based on 11 projection scenarios. These scenarios were developed for two purposes: (1) to estimate the sensitivity of certain measures of ethnocultural diversity in Canada to specific aspects of immigration and other demographic components, and (2) to provide a plausible range of demographic trends for specific subpopulations (by racialized group, place of birth, etc.). Readers are asked to consider this range of results instead of a single scenario. Full details on the assumptions used in each of the 11 scenarios are available in the publication entitled "Population projections for Canada and its regions on the themes of immigration and diversity, 2016 to 2041: Overview of assumptions and scenarios" in Demosim: Reports and Analytical Studies (17-20-0001).
The concept of ethnocultural diversity of the population can have multiple meanings. In these projections, the ethnocultural diversity of the population is defined based on some aspects that are most likely to undergo changes as a direct or indirect result of immigration in the coming years, namely, place of birth and racialized group. In this respect, it should be remembered that the groups selected for the projections, although they comprise people who share certain characteristics, do not in themselves represent homogeneous entities.
In October 2021, Statistics Canada released projections reflecting another aspect of the diversity of the Canadian population, that is projections of Indigenous populations in Canada up to 2041.
Finally, it should be noted that the concept of "racialized" population is derived directly from the "visible minority" variable in the census. "Visible minority" refers to the persons belonging to a visible minority group defined by the Employment Equity Act. The Act defines visible minorities as "persons, other than Aboriginal peoples, who are non-Caucasian in race or non-white in colour." The visible minority population consists mainly of the following groups: South Asian, Chinese, Black, Filipino, Latin American, Arab, Southeast Asian, West Asian, Korean and Japanese. The charts and tables in this article, as well as the projections made available free of charge in Table 17-10-0146-01 on Statistics Canada's website, are based on the variable and concept of "visible minority" but use the terms "racialized population" and "racialized groups."
Products
The report Population projections on immigration and diversity for Canada and its regions, 2016 to 2041: Overview of projection assumptions and scenarios is now available.
The data visualization product Population projections on immigration and diversity: Interactive Dashboard (71-607-x) can also be used to explore population projection results in a dynamic manner. The base data for this tool are those from the Common Output Data Repository 17-10-0146-01 table. This table, also available, presents projections of the Canadian population by racialized group, generation status, age group, sex, census metropolitan area of residence, province or territory of residence, and projection scenario for years 2016 to 2041.
Contact information
For more information, or to enquire about the concepts, methods or data quality of this release, contact us (toll-free 1-800-263-1136; 514-283-8300; infostats@statcan.gc.ca) or Media Relations (statcan.mediahotline-ligneinfomedias.statcan@statcan.gc.ca).
- Date modified:


