Infographic 2
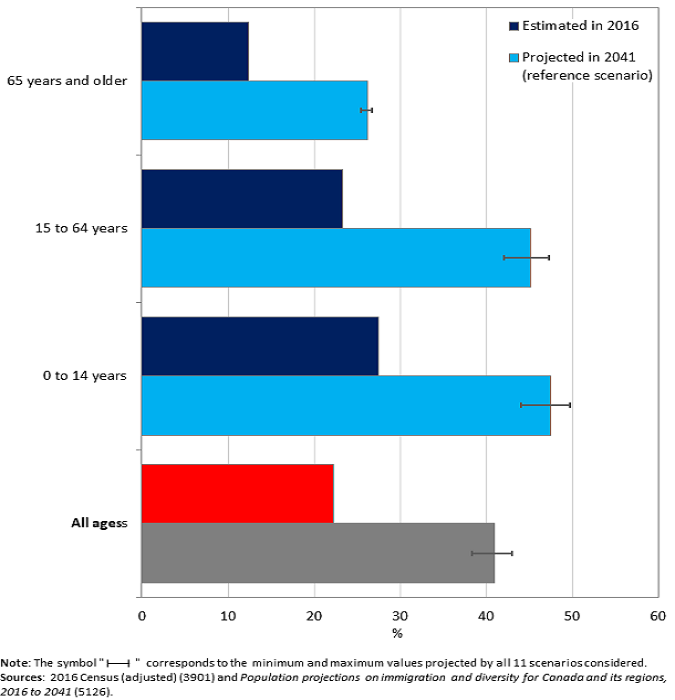
Proportion of the racialized population in the total population by age group, 2016 (estimated) and 2041 (projected under the reference scenario), Canada

Infographic description
The title of the infographic is "Proportion of the racialized population in the total population by age group, 2016 (estimated) and 2041 (projected under the reference scenario), Canada"
This is a horizontal bar chart.
The horizontal axis shows the proportion of the racialized population (%) from 0% to 60% by increments of 10 percentage points.
The vertical axis shows 3 age groups (0 to 14 years, 15 to 64 years, and 65 years and older), as well as a fourth category "All ages".
There are two series of bars. The first series of horizontal bars (in dark blue or in red for the "All ages" category only) represents the proportion of the racialized population estimated in 2016 by age group.
The second series of horizontal bars (in pale blue or in grey for the "All ages" category only) represents the proportion of the racialized population projected for 2041 by age group under the reference scenario. Error bars appear on the second series of horizontal bars. These error bars correspond to the interval between the minimum and maximum values projected by all 11 scenarios developed in the
The first set of bars presents the proportion of the racialized population among those aged 65 years and older, estimated at 12.4% in 2016 and projected at 26.2% for 2041. The minimum and maximum values projected for 2041 are, respectively, 25.4% and 26.7%.
The second set of bars presents the proportion of the racialized population among those aged 15 to 64 years, estimated at 23.3% in 2016 and projected at 45.1% for 2041. The minimum and maximum values projected for 2041 are, respectively, 42.1% and 47.3%.
The third set of bars presents the proportion of the racialized population among those aged 0 to 14 years, estimated at 27.5% in 2016 and projected at 47.4% for 2041. The minimum and maximum values projected for 2041 are, respectively, 44.0% and 49.7%.
The fourth set of bars presents the proportion of the racialized population of all ages, estimated at 22.2% in 2016 and projected at 41.0% for 2041. The minimum and maximum values projected for 2041 are, respectively, 38.2% and 43.0%.
Note: The error bars correspond to the minimum and maximum values projected by all 11 scenarios considered.
Sources: 2016 Census (adjusted) (3901) and
- Date modified: