
Population projections on immigration and diversity for Canada and its regions, 2016 to 2041: Overview of projection assumptions and scenarios
Skip to text
Text begins
Acknowledgments
This report is the work of the Demosim team. The following are or were members of the Demosim team during the development of the versions of the model based on the 2016 Census: Arnaud Bouchard-Santerre, Patrice Dion, Stéphanie Langlois, Anne Milan, Jean-Dominique Morency, David Pelletier, Elham Sirag, Stéphanie Tudorovsky, Gabriel Vesco and Samuel Vézina of the Centre for Demography; Dominic Grenier, Chantal Grondin, Danielle Léger and Amélie Lévesque of the Statistical Integration Methods Division.
For the development of this version of Demosim, funding was received from Statistics Canada and two external partners: Indigenous Services Canada (ISC) and Immigration, Refugees and Citizenship Canada (IRCC). Representatives of these departments were consulted at different stages, through an interdepartmental working group and an interdepartmental steering committee.
We would like to thank Jonathan Chagnon for all his help in preparing the assumptions and Carol D’Aoust for formatting this report and his support for publishing the projections and its related products. We would also like to thank Laurent Martel, who reviewed a preliminary version of this document.
Introduction
For a fourth consecutive cycle, Statistics Canada is presenting population projections on immigration and ethnocultural diversity in Canada. As in the past, these projections are produced using the Demosim microsimulation model. This new cycle of projections aims to integrate more recent data sources—the most important being the 2016 Census—and to consider the most recent developments in immigration and, where possible, the impact of the COVID-19 pandemic on the demographic evolution of Canada’s population. The objective here is to produce prospective data for the period from 2016 to 2041.
This new projection exercise on immigration and ethnocultural diversity is largely based on the methods and know-how acquired in previous cycles, so there will be no surprises for users who are familiar with these projections. However, it differs from previous exercises in that more attention was paid to the uncertainty in the first projection years. This decision was made given the current demographic context, which has been marked by a certain amount of volatility—in particular as a result of the COVID-19 pandemic—but also to meet the needs of some users for projection data over a short horizon.
This projection exercise is also different because of the range of products available to users. The analytical report that used to be published (Statistics Canada 2017) has now been replaced by the following three products available on Statistics Canada’s website: (1) a data table, (2) an interactive data visualization tool (see Box 1 for more details on these products), and (3) this report, which describes the assumptions and scenarios used for these projections. The technical aspects of the model are already described in the following report: Projections of the Indigenous populations and households in Canada, 2016 to 2041: Overview of data sources, methods, assumptions and scenarios (Statistics Canada 2021). Readers interested in the more technical aspects of the model are invited to consult this publication as well as Box 2 of this report.
Start of text box 1
Box 1. Dissemination products for the population projections on immigration and diversity
Analysts and researchers interested in the results of the current projections are invited to consult the following products available to the public free of charge on the Statistics Canada website:
The Daily
The Daily is Statistics Canada’s official release bulletin. A special article in The Daily was published the day these projections were disseminated. It provides a brief description of the main projection results (Statistics Canada 2022-1).
Data table
A data table (Table 17-10-0146-01 [Statistics Canada 2022-2]) presents projected population figures broken down by age group, sex, racialized group, generation status, place of residence (province, territory and census metropolitan area) and projection scenario for the years 2016 to 2041.
Interactive data visualization tool (dashboard)
An interactive data visualization tool (Statistics Canada 2022-3) provides a dynamic way to explore the results of these projections. The reference data for this tool are taken from the data table presented in the previous paragraph.
Data produced on demand
If you cannot find data that would be useful in the above products, you can request custom data by contacting the Centre for Demography (statcan.demography-demographie.statcan@statcan.gc.ca). Custom tables are prepared on a cost-recovery basis.
End of text box 1
Base population and projection model
The starting point of this projection is May 10, 2016, the reference date of the 2016 Canadian Census of Population. The base population was developed from the 2016 Census (long-form questionnaire) microdata file. To ensure that the data best represent Canada’s population on the census reference date, they were adjusted to take into account the population living in institutions and collective dwellings, census net undercoverage and the population living on incompletely enumerated Indian settlements or Indian reserves. Following these adjustments, the Demosim base population includes close to 9.1 million records, representing 36,029,000 people.
The projections were produced using the Demosim microsimulation projection model. This model can project a great number of characteristics of the Canadian population, including ethnocultural characteristics such as place of birth, generation status and racialized group. Demosim can also produce results at fine geographic levels. These projections were developed at the census metropolitan area (CMA) level.
To update the projected population characteristics being simulated, Demosim models many demographic events, such as fertility, mortality, and internal and international migration, as well as other non-demographic events, including intergenerational “transmission” of the racialized group or changes in education level that may occur during a person’s life. The complete list of events modelled by Demosim as well as the data sources and methods used in the projection model are described in a separate document (Box 2).
Start of text box 2
Box 2. To find out more about the base population, data sources and methodology behind these projections
For more information on the content of the Demosim model, the base population, and the data sources and methods used to model the events that these projections take into account, please consult the sections entitled “Base population,” “Demosim’s general functions and features” and “Main components projected in Demosim” in the publication entitled Projections of the Indigenous populations and households in Canada, 2016 to 2041: Overview of data sources, methods, assumptions and scenarios (Statistics Canada 2021).
Since this publication was released, some changes have been made to the model, in particular to the modulesNote on emigration and acquisition of Canadian citizenship. An updated description of these two modules is provided in Appendix A.
End of text box 2
Assumptions
This section presents the main assumptions selected for these projections. These assumptions were developed for two purposes: 1) to estimate the sensitivity of certain measures of ethnocultural diversity in Canada to specific aspects of immigration and other demographic components, and 2) to provide a plausible range of demographic trends for specific subpopulations (by racialized group, place of birth, etc.).
To get the most out of existing analyses, many of the assumptions selected are similar to those developed for projection exercises recently conducted by Statistics Canada. In particular, the analytical work and consultations done to prepare the document Population Projections for Canada (2018 to 2068), Provinces and Territories (2018 to 2043) (Statistics Canada 2019-1) were especially useful, particularly the assumptions related to the key demographic components (immigration, emigration, fertility and mortality).Note To learn more about the rationale behind the selection of these assumptions, please refer to the technical report of these projections entitled Population Projections for Canada (2018 to 2068), Provinces and Territories (2018 to 2043): Technical Report on Methodology and Assumptions (Statistics Canada 2019-2). It is referenced extensively in the paragraphs below. In addition, some assumptions selected for the Projections of the Indigenous populations and households in Canada, 2016 to 2041 (Statistics Canada 2021) have been reproduced here in full, particularly those relating to Indigenous populations.
The choice of assumptions is closely related to the methods used to model the different components projected. Readers will find additional information in the methodological section of the report entitled Projections of the Indigenous populations and households in Canada, 2016 to 2041: Overview of data sources, methods, assumptions and scenarios (Statistics Canada 2021) and in Appendix A of this document.
The paragraphs below present the assumptions made with respect to immigration, emigration, non-permanent residents, internal migration, fertility, assignment of the racialized group to newborns, and mortalityNote (Table 1). Assumptions about other components are summarized at the end of the section.
| Components | Number of assumptions | Assumptions |
|---|---|---|
| Immigration level | 1 | 2016 to 2021 period |
| - Observed data from the Demographic Estimates Program. | ||
| 3 | 2022 to 2024 period | |
| - Low: Lower limit of the range in IRCC's Immigration Levels Plan for Canada, 2022 to 2024; | ||
| - Medium: Target number in IRCC's Immigration Levels Plan for Canada, 2022 to 2024; | ||
| - High: Upper limit of the range in IRCC's Immigration Levels Plan for Canada, 2022 to 2024. | ||
| 3 | 2025 to 2041 period | |
| - Low: Immigration rate gradually reaching 6.5 immigrants per 1,000 inhabitants in 2041;Table 1 Note 1 | ||
| - Medium: Immigration rate gradually reaching 8.3 immigrants per 1,000 inhabitants in 2041;Table 1 Note 1 | ||
| - High: Immigration rate kept constant at 11.9 immigrants per 1,000 inhabitants. | ||
| Provincial and territorial distribution of immigrants upon arrival | 1 | 2016 to 2021 period |
| - Observed data from the Demographic Estimates Program.Table 1 Note 2 | ||
| 2 | 2022 to 2041 periodTable 1 Note 3 | |
| - Distribution observed in 2021 linearly converging towards the average distribution observed from 2007 to 2021 by 2041; | ||
| - Distribution observed in 2021 linearly converging towards the average distribution observed from 2017 to 2021 by 2041. | ||
| Composition of immigration by place of birthTable 1 Note 4 | 1 | 2016 to 2021 period |
| - Observed data from the Demographic Estimates Program. | ||
| 2 | 2022 to 2041 period | |
| - Average composition observed from 2017 to 2021 linearly converging towards the average composition observed from 2007 to 2021 by 2041; | ||
| - Average composition observed from 2017 to 2021 kept constant until 2041. | ||
| Emigration | 3 | Net emigration rate |
| May 2016 to June 2021 period | ||
| - Observed data from the Demographic Estimates Program. | ||
| July 2021 to December 2041 period | ||
| - Low: Gross migraproduction rateTable 1 Note 5 gradually reaching 1.2 emigrants per 1,000 inhabitants in 2041; | ||
| - Medium: Gross migraproduction rateTable 1 Note 5 gradually reaching 1.5 emigrants per 1,000 inhabitants in 2041; | ||
| - High: Gross migraproduction rateTable 1 Note 5 gradually reaching 1.7 emigrants per 1,000 inhabitants in 2041. | ||
| 1 | Differences between population groups | |
| - Observed from 1995 to 2016. | ||
| Number of non-permanent residents | 3 | - Low: Number of non-permanent residents gradually reaching 1,031,000 in 2041; |
| - Medium: Number of non-permanent residents gradually reaching 1,556,000 in 2041; | ||
| - High: Number of non-permanent residents gradually reaching 1,947,000 in 2041. | ||
| Internal migration | 5 | Number and direction of migratory flows |
| - Average of flows observed during the periods 1996/2001, 2001/2006, 2006/2011 and 2011/2016; | ||
| - Observed flows from 2011 to 2016; | ||
| - Observed flows from 2006 to 2011; | ||
| - Observed flows from 2001 to 2006; | ||
| - Observed flows from 1996 to 2001. | ||
| 1 | Differences between population groups | |
| - Differences kept constant at the average level observed during the periods 2000/2001, 2005/2006, 2010/2011 and 2015/2016. | ||
| Fertility | 3 | Total fertility rate (TFR) |
| - Low: TFR gradually reaching 1.40 children per woman in 2041;Table 1 Note 6 | ||
| - Medium: TFR gradually reaching 1.59 children per woman in 2041;Table 1 Note 6 | ||
| - High: TFR gradually reaching 1.79 children per woman in 2041.Table 1 Note 6 | ||
| 1 | Differences between population groups | |
| - Differences kept constant to level estimated between 2015 and 2016. | ||
| Assignment of a racialized group to newborns | 1 | - Observed in 2016. |
| Mortality | 3 | Rise of life expectancyTable 1 Note 7 |
| - Low: Males = 83.5 years / Females = 87.4 years in 2041; | ||
| - Medium: Males = 84.8 years / Females = 88.4 years in 2041; | ||
| - High: Males = 85.8 years / Females = 89.6 years in 2041. | ||
| 1 | Differences between population groups | |
| - Differences kept constant to level estimated from 2006 to 2016. | ||
Source: Statistics Canada, Centre for Demography. |
||
Immigration
In recent years, there have been many changes in the number of immigrants admitted to Canada annually, the destination of immigrants upon arrival, and the composition of immigration by place of birth. More than one projection assumption is applied to each of these three dimensions of immigration to reflect the fluctuations observed over time and the associated uncertainty.
Annual number of immigrants
For the period from May 2016 to December 2021, the annual number of immigrants added to Canada’s population during the projection corresponds to the numbers from the Demographic Estimates Program (DEP), which are based on IRCC data. From January 2022 onwards, three distinct assumptions were selected: low, medium and high (immigration).
For the low immigration assumption, the number of immigrants from 2022 to 2024 corresponds to the lower limit of the range of the IRCC Immigration Levels PlanNote published in 2022 (the most recent plan available when this report was being prepared), i.e., 360,000 immigrants in 2022; 380,000 in 2023; and 390,000 in 2024. In 2024, this number corresponds to an immigration rate of 9.8 immigrants per 1,000 inhabitants.Note For subsequent years, the low assumption assumes a gradual (logarithmic) decrease in the immigration rate measured in 2024 to an immigration rate of 6.5 immigrants per 1,000 inhabitants in 2041.
The medium and high assumptions were developed in a similar fashion. From 2022 to 2024, the number of immigrants for the medium assumption corresponds to the target number of the immigration plan published in 2022 (431,645 immigrants in 2022; 447,055 in 2023; and 451,000 in 2024) as it corresponds to the upper limit of the plan (445,000 immigrants in 2022; 465,000 in 2023; and 475,000 in 2024) for the high assumption. In 2024, the corresponding immigration rates are 11.3 immigrants per 1,000 inhabitants in the medium assumption and 11.9 immigrants per 1,000 inhabitants in the case of the high assumption.Note After 2024, the immigration rate measured in 2024 decreases following a cubic interpolation to 8.3 immigrants per 1,000 inhabitants in 2041 in the case of the medium assumption, while it remained constant at 11.9 immigrants per 1,000 inhabitants until the end of the projection for the high assumption (Chart 1).Note

Data table for Chart 1
| Year | Estimated | Low assumption | Medium assumption | High assumption |
|---|---|---|---|---|
| per thousand | ||||
| 2016 | 8.3 | Note ..: not available for a specific reference period | Note ..: not available for a specific reference period | Note ..: not available for a specific reference period |
| 2017 | 7.9 | Note ..: not available for a specific reference period | Note ..: not available for a specific reference period | Note ..: not available for a specific reference period |
| 2018 | 8.7 | Note ..: not available for a specific reference period | Note ..: not available for a specific reference period | Note ..: not available for a specific reference period |
| 2019 | 9.1 | Note ..: not available for a specific reference period | Note ..: not available for a specific reference period | Note ..: not available for a specific reference period |
| 2020 | 4.9 | Note ..: not available for a specific reference period | Note ..: not available for a specific reference period | Note ..: not available for a specific reference period |
| 2021 | 10.6 | Note ..: not available for a specific reference period | Note ..: not available for a specific reference period | Note ..: not available for a specific reference period |
| 2022 | Note ..: not available for a specific reference period | 9.3 | 11.2 | 11.6 |
| 2023 | Note ..: not available for a specific reference period | 9.7 | 11.4 | 11.9 |
| 2024 | Note ..: not available for a specific reference period | 9.8 | 11.3 | 11.9 |
| 2025 | Note ..: not available for a specific reference period | 9.0 | 11.3 | 11.9 |
| 2026 | Note ..: not available for a specific reference period | 8.6 | 11.2 | 11.9 |
| 2027 | Note ..: not available for a specific reference period | 8.2 | 11.0 | 11.9 |
| 2028 | Note ..: not available for a specific reference period | 8.0 | 10.9 | 11.9 |
| 2029 | Note ..: not available for a specific reference period | 7.8 | 10.7 | 11.9 |
| 2030 | Note ..: not available for a specific reference period | 7.6 | 10.4 | 11.9 |
| 2031 | Note ..: not available for a specific reference period | 7.4 | 10.2 | 11.9 |
| 2032 | Note ..: not available for a specific reference period | 7.3 | 9.9 | 11.9 |
| 2033 | Note ..: not available for a specific reference period | 7.2 | 9.7 | 11.9 |
| 2034 | Note ..: not available for a specific reference period | 7.1 | 9.4 | 11.9 |
| 2035 | Note ..: not available for a specific reference period | 7.0 | 9.2 | 11.9 |
| 2036 | Note ..: not available for a specific reference period | 6.9 | 9.0 | 11.9 |
| 2037 | Note ..: not available for a specific reference period | 6.8 | 8.8 | 11.9 |
| 2038 | Note ..: not available for a specific reference period | 6.7 | 8.6 | 11.9 |
| 2039 | Note ..: not available for a specific reference period | 6.6 | 8.5 | 11.9 |
| 2040 | Note ..: not available for a specific reference period | 6.6 | 8.4 | 11.9 |
| 2041 | Note ..: not available for a specific reference period | 6.5 | 8.3 | 11.9 |
|
.. not available for a specific reference period Source: Statistics Canada, Centre for Demography. |
||||
These assumptions are largely based on those developed for the Population Projections for Canada (2013 to 2063), Provinces and Territories (2018 to 2043) (Statistics Canada 2019-2). Like the latter, the assumptions in this new projection exercise consider the targets of the most recent IRCC immigration plan for setting short-term targets and the results of the 2018 Survey of Experts on Future Demographic Trends (Dion et al. 2019) for the long-term targets.
Therefore, the long-term targets of the medium and low immigration assumptions, with rates of 8.3 per 1,000 and 6.5 per 1,000 in 2041, are derived directly from the survey’s results.Note Note For the high assumption, the selected long-term target is 11.9 per 1,000, which is significantly higher than the one obtained from the survey (10.8 per 1,000). This choice helps to better reflect uncertainty about this component by widening the range of possible outcomes. This is done in a context characterized by significant labour force needs and where the top of the range of the most recent immigration plan has increased compared with previous plans, proposing immigration rates of 11.9 per 1,000 in 2023 and 2024, levels that have not been reached in recent decades. What distinguishes the most these assumptions from those used in the population projections for Canada is the way immigration rates change between the period covered by the immigration plan and the long-term targets.
The choice of a cubic evolution of rates towards the long-term target (8.3 per 1,000) in the medium assumption makes it possible to:
- Maintain relatively high rates in the early years of the projection. This ensures continuity with the immigration plan targets and, therefore, with the federal government’s short-term immigration objectives (including that of supporting the economy regarding labour shortages).
- Give a greater weight to the long-term forecasts provided by experts toward the end of the projected period. It should be remembered that the target of 8.3 per 1,000 set by the experts was obtained in a context where immigration was already increasing. Overall, experts expressed the view that the immigration rate would tend to return in the long run to a level closer to recent historical values.
As for the logarithmic change in the low assumption, it brings the rate closer to the lower level specified by the experts in just a few years and offers the advantage of very quickly extending downward the range of results. Several arguments have already been made to support a possible decline in immigration rates in the future, including problems related to the integration of immigrants, the limited capacity of communities to welcome them or a decline in public support for immigration (for a more in-depth discussion on the subject, see Galbraith [2019]).
Finally, the choice to maintain the immigration rate at 11.9 per 1,000 between 2025 and 2041 in the high assumption is based on the following observation: while the top range of the immigration plan assumes that the 11.9 per 1,000 rate could be reached in the coming years, never in the last few decades have immigration rates of this magnitude been reached in Canada (the highest rate since 1970 being 10.6 per 1,000 in 2021). Therefore, it is assumed in these projections that the immigration rate corresponding to the upper bound of the immigration plan constitutes a ceiling.
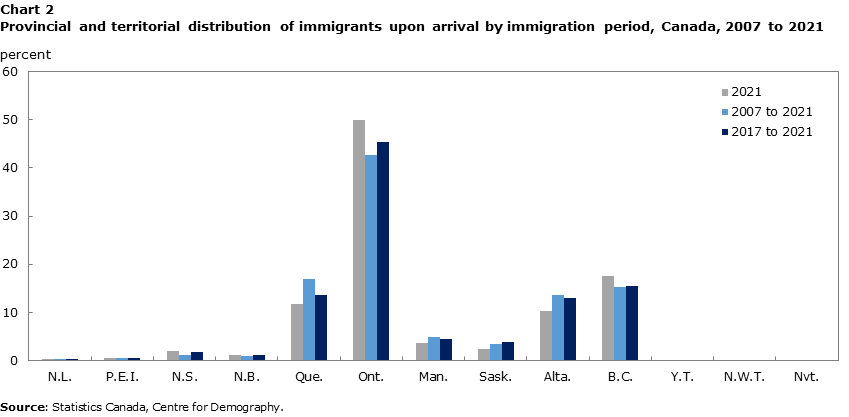
Provincial and territorial distribution of immigrants upon their arrival in Canada
The geographic distribution of immigrants upon their arrival in Canada has a significant influence on population growth and ethnocultural diversity in the country’s various regions. For the period from May 2016 to December 2021, the projection of the geographical distribution of immigrants upon arrival is based on the data observed.Note
Starting in 2022, two distinct assumptions are proposed, in which the geographic distribution of immigrants observed in 2021 changes in a linear fashion to reach a target distribution in 2041 reflecting the average observed during the period from 2007 to 2021 in the first assumption, and the average observed during the period from 2017 to 2021 in the second (Chart 2). For 2022, a special adjustment is made to ensure that the share of immigrants that Quebec would receive is consistent with that set out in the immigration plans of the IRCC and the Ministère de l’Immigration, de la Francisation et de l’Intégration du Québec (MIFI).Note
Data table for Chart 2
| Province / Territory | 2021 | 2007 to 2021 | 2017 to 2021 |
|---|---|---|---|
| percent | |||
| N.L. | 0.3 | 0.3 | 0.4 |
| P.E.I. | 0.5 | 0.5 | 0.6 |
| N.S. | 1.9 | 1.2 | 1.7 |
| N.B. | 1.1 | 0.9 | 1.3 |
| Que. | 11.7 | 16.9 | 13.7 |
| Ont. | 50.1 | 42.7 | 45.3 |
| Man. | 3.7 | 4.8 | 4.4 |
| Sask. | 2.5 | 3.5 | 3.9 |
| Alta. | 10.2 | 13.6 | 13.1 |
| B.C. | 17.6 | 15.3 | 15.4 |
| Y.T. | 0.1 | 0.1 | 0.1 |
| N.W.T. | 0.1 | 0.1 | 0.1 |
| Nvt. | 0.0 | 0.0 | 0.0 |
| Source: Statistics Canada, Centre for Demography. | |||
For these two assumptions, the geographical distribution observed in 2021 (the last observed year) is given significant weight in the first few years. An analysis of historical data shows that the geographic distribution of immigrants upon arrival in Canada tends to change slowly over time and changes little from year to year. Thus, the last year observed seems to be the best predictor of the future geographic distribution in the short term.
The long-term target based on the average observed over the last 15 years (2007 to 2021) was chosen so that the geographic distribution would converge to an average portrait that takes into account fluctuations observed over a relatively long period. In contrast, the long-term target based on the average of a very recent period (2017 to 2021) is intended to provide an alternative portrait that gives more weight to the recent demographic situation. This second assumption is particularly favourable to the Atlantic provinces, Ontario, Saskatchewan and the territories.
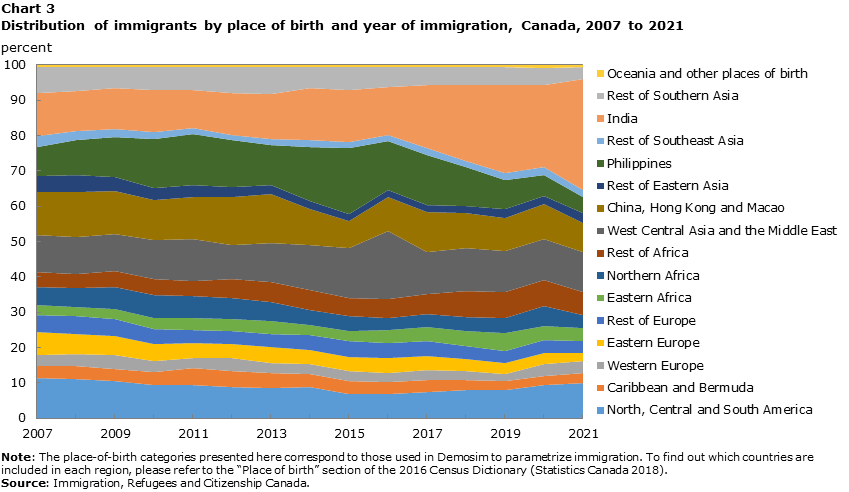
Composition of immigration by place of birth
The composition of immigration by place of birth is a component that has a direct impactNote on the population growth of different sub-groups of the Canadian population, particularly the different racialized groups.
Over the period from 2007 to 2021, 62% of immigrants who settled in Canada were from Asia, 14% from Africa, 12% from the Americas, 11% from Europe, and less than 1% from Oceania. These proportions fluctuated relatively little over the period. However, variations occur from year to year when data are disaggregated to finer geographic levels. For example, while the proportion of new immigrants from Asia has remained relatively stable at about 60% in recent years there has been significant regional variations (by country or group of countries) (Chart 3). In addition, the factors determining the origin of immigrants selected to come to Canada are numerous and difficult to predict. They include changes in government immigration programs or crises around the world (especially with respect to refugees).
Data table for Chart 3
| Place of birth | 2007 | 2008 | 2009 | 2010 | 2011 | 2012 | 2013 | 2014 | 2015 | 2016 | 2017 | 2018 | 2019 | 2020 | 2021 |
|---|---|---|---|---|---|---|---|---|---|---|---|---|---|---|---|
| percent | |||||||||||||||
| North, Central and South America | 11.5 | 11.0 | 10.5 | 9.3 | 9.3 | 8.8 | 8.6 | 8.8 | 6.9 | 6.8 | 7.4 | 7.9 | 7.9 | 9.4 | 10.0 |
| Caribbean and Bermuda | 3.4 | 3.7 | 3.6 | 3.8 | 4.9 | 4.7 | 4.1 | 3.9 | 3.5 | 3.4 | 3.4 | 3.0 | 2.6 | 2.7 | 2.7 |
| Western Europe | 3.1 | 3.6 | 3.8 | 3.0 | 2.9 | 3.4 | 2.9 | 2.6 | 2.9 | 2.8 | 2.9 | 2.5 | 2.1 | 3.1 | 3.6 |
| Eastern Europe | 6.6 | 5.6 | 5.4 | 4.9 | 4.3 | 4.2 | 4.4 | 4.0 | 3.9 | 4.2 | 4.0 | 3.3 | 2.9 | 3.2 | 2.3 |
| Rest of Europe | 4.8 | 5.0 | 4.8 | 4.2 | 3.6 | 3.6 | 3.7 | 4.2 | 4.6 | 4.2 | 4.0 | 3.8 | 3.5 | 3.7 | 3.4 |
| Eastern Africa | 2.8 | 2.8 | 2.8 | 3.1 | 3.6 | 3.4 | 3.7 | 2.8 | 2.8 | 3.6 | 3.9 | 4.2 | 5.0 | 4.0 | 3.7 |
| Northern Africa | 4.9 | 5.3 | 6.3 | 6.6 | 6.1 | 5.9 | 5.3 | 4.4 | 4.2 | 3.5 | 3.7 | 4.0 | 4.1 | 5.5 | 3.5 |
| Rest of Africa | 4.2 | 3.9 | 4.5 | 4.6 | 4.3 | 5.4 | 5.8 | 5.5 | 5.1 | 5.2 | 5.8 | 7.3 | 7.6 | 7.4 | 6.8 |
| West Central Asia and the Middle East | 10.7 | 10.4 | 10.6 | 10.9 | 11.7 | 9.7 | 11.2 | 12.9 | 14.1 | 19.2 | 12.0 | 12.2 | 11.5 | 11.7 | 11.1 |
| China, Hong Kong and Macao | 12.2 | 12.7 | 12.2 | 11.3 | 12.1 | 13.5 | 13.8 | 10.0 | 7.6 | 9.6 | 11.2 | 9.9 | 9.5 | 9.7 | 8.4 |
| Rest of Eastern Asia | 4.3 | 4.7 | 3.9 | 3.5 | 3.2 | 3.0 | 2.5 | 2.5 | 2.1 | 2.0 | 2.1 | 2.2 | 2.5 | 2.5 | 2.7 |
| Philippines | 8.3 | 10.0 | 11.3 | 13.6 | 14.7 | 13.2 | 11.3 | 15.3 | 18.6 | 14.0 | 14.2 | 10.9 | 8.1 | 5.9 | 4.5 |
| Rest of Southeast Asia | 3.2 | 2.5 | 2.3 | 2.1 | 1.6 | 1.4 | 1.6 | 2.0 | 1.8 | 1.7 | 1.8 | 1.7 | 2.0 | 2.2 | 2.0 |
| India | 12.0 | 11.3 | 11.6 | 11.9 | 10.8 | 11.9 | 12.7 | 14.7 | 14.5 | 13.5 | 18.0 | 21.5 | 24.9 | 23.1 | 31.4 |
| Rest of Southern Asia | 7.3 | 6.8 | 6.0 | 6.5 | 6.4 | 7.3 | 7.8 | 5.8 | 6.6 | 5.5 | 4.9 | 4.9 | 5.0 | 5.0 | 3.5 |
| Oceania and other places of birth | 0.6 | 0.6 | 0.6 | 0.5 | 0.6 | 0.6 | 0.6 | 0.7 | 0.7 | 0.7 | 0.8 | 0.8 | 0.8 | 0.8 | 0.6 |
|
Note: The place-of-birth categories presented here correspond to those used in Demosim to parametrize immigration. To find out which countries are included in each region, please refer to the “Place of birth” section of the 2016 Census dictionary (Statistics Canada 2018). Source: Immigration, Refugees and Citizenship Canada. |
|||||||||||||||
Given the uncertainty surrounding the future change in the composition of immigration by place of birth, two assumptions were used, each of which was established at the provincial and territorial level.Note For the period between May 2016 and December 2021, the projected distribution of new immigrants by place of birth is determined based on IRCC data. Then, between 2022 and 2041, two assumptions are proposed. The first assumption is that the distribution of new immigrants by place of birth would change in a linear fashion from the estimated average distribution over the period from 2017 to 2021 to a target in 2041 that corresponds to the estimated average distribution over the period from 2007 to 2021. The second assumption is that the average distribution of immigrants by place of birth would remain constant, corresponding to the recently observed average distribution (2017 to 2021). A comparison of the two assumptions shows that the latter is more favourable to immigration from India and less favourable to immigration from China and the Philippines.
Emigration
Emigration is a demographic phenomenon that is difficult to estimate in Canada, in particular because people leaving the country have no legal obligation to report their departure (Bérard-Chagnon 2018). Nonetheless, we know that the number of emigrants is well below the number of immigrants. For example, between July 2016 and June 2021, a total of 1,400,000 immigrants settled in Canada, whereas net emigration, i.e., the number of emigrants minus the number of returning emigrants plus net temporary emigration, was estimated at 145,000.Note
As with immigration levels, three assumptions were used regarding future increases in net emigration levels: a low, medium and high emigration assumption. These assumptions were chosen to ensure the best possible consistency with those developed for the Population Projections for Canada (2018 to 2068), Provinces and Territories (2018 to 2043)Note while taking into account the most recent developments for this component.
Recent data show a change in the evolution of net emigration rates. Between 2016 and 2019, net emigration rates were in continuous decline, which continued in 2020 and 2021 owing to the COVID-19 pandemic and, more specifically, to the resulting border closure. As of this moment, it is difficult to predict whether this decline in rates, which began a few years before the pandemic, will continue or whether rates will return to levels closer to the averages of past periods. Because of this increased uncertainty, the selected assumptions provide a broader range of outcomes than the population projections for Canada released in 2019.
For the period from May 2016 to June 2021, the net emigration rates by age for Canada as a whole obtained from the DEP are applied directly in the projection. An adjustment by province and territory is then made to reflect the net emigration estimates for those geographies for that period. It is starting in July 2021 that the three assumptions diverge.
Although only the net emigration component is projected in the projection model, the assumptions are developed separately for each of the three components of net emigration. Therefore, the final net emigration assumptions are the result of combining the assumptions selected for each of its three components.
Under the low assumption, the gross migraproduction rateNote (GMPR) (reflecting net emigration) observed in 2020/2021 (0.6 per 1,000) at the national level will converge to a rate of 1.2 per 1,000 set in 2030/2031,Note then remain constant at this level until the end of the projection. This assumption was produced by combining the following assumptions developed for emigration, returning emigration and net temporary emigration:
- Emigration: It is assumed that the emigration GMPR observed for 2020/2021 will converge logarithmically to a target in 2030/2031 corresponding to the last data point observed before the pandemic (2018/2019), which is the lowest level observed before the COVID-19 pandemic. This rate is then held constant until the end of the projection.
- Returning emigration: the number of returning emigrants is derived from an assumption on the evolution of the ratio between the number of returning emigrants and the number of emigrants. The assumption selected assumes that the ratio observed in 2020/2021 will increase logarithmically to reach, in 2030/2031, the ratio expected for that year in the low assumption of the population projections for Canada (Sirag and Dion 2019). Thereafter, this ratio is held constant.
- Net temporary emigration: It is assumed that the GMPR of the net temporary emigration observed in 2020/2021 will converge logarithmically by 2030/2031 to the average GMPR observed in the period from 2006 to 2016 and that this rate will remain constant thereafter until 2041/2042.
Under the high assumption, the GMPR (reflecting net emigration) observed in 2020/2021 (0.6 per 1,000) at the national level will increase rapidly to reach 1.6 per 1,000 in 2025/2026, then increase more slowly to reach 1.7 per 1,000 in 2041/2042. This assumption is based on the following three assumptions specific to each component of net emigration:
- Emigration: It is assumed that the emigration GMPR observed in 2020/2021 will converge logarithmically by 2025/2026 to the rate predicted for that year in the high assumption of the population projections for Canada (Sirag and Dion 2019). After 2025/2026, it is assumed that the rate will change in the same way as in the high assumption of the same projections.
- Returning emigration: It is assumed that the ratio between the number of returning emigrants and the number of emigrants observed in 2020/2021 will converge by 2025/2026 to the ratio selected in the high assumption of the population projections for Canada for that year (Sirag and Dion 2019). It is also assumed that this ratio will thereafter follow the same trend as in the high assumption.
- Net temporary emigration: It is assumed that the net temporary emigration GMPR observed in 2020/2021 will converge logarithmically by 2025/2026 to the average GMPR observed in the period from 2006 to 2016 and then remain constant thereafter until 2041/2042.
The low and high assumptions provide extreme values for the possible changes of the net emigration rate in the future. It is from these two extremes that the medium assumption is derived. It is obtained by averaging the GMPRs of the low and high assumptions. According to the medium assumption, the GMPR would reach 1.5 per 1,000 in 2041/2042. Table 2 provides a summary of the three assumptions.
| Period | Estimated | Low assumption | Medium assumption | High assumption |
|---|---|---|---|---|
| per thousand | ||||
| 2015/2016 | 1.5 | Note ..: not available for a specific reference period | Note ..: not available for a specific reference period | Note ..: not available for a specific reference period |
| 2016/2017 | 1.1 | Note ..: not available for a specific reference period | Note ..: not available for a specific reference period | Note ..: not available for a specific reference period |
| 2017/2018 | 0.9 | Note ..: not available for a specific reference period | Note ..: not available for a specific reference period | Note ..: not available for a specific reference period |
| 2018/2019 | 0.8 | Note ..: not available for a specific reference period | Note ..: not available for a specific reference period | Note ..: not available for a specific reference period |
| 2019/2020 | 0.0 | Note ..: not available for a specific reference period | Note ..: not available for a specific reference period | Note ..: not available for a specific reference period |
| 2020/2021 | 0.6 | Note ..: not available for a specific reference period | Note ..: not available for a specific reference period | Note ..: not available for a specific reference period |
| 2021/2022 | Note ..: not available for a specific reference period | 0.4 | 0.6 | 0.8 |
| 2022/2023 | Note ..: not available for a specific reference period | 0.8 | 1.1 | 1.4 |
| 2023/2024 | Note ..: not available for a specific reference period | 0.9 | 1.2 | 1.5 |
| 2024/2025 | Note ..: not available for a specific reference period | 1.0 | 1.3 | 1.6 |
| 2025/2026 | Note ..: not available for a specific reference period | 1.1 | 1.4 | 1.6 |
| 2026/2027 | Note ..: not available for a specific reference period | 1.1 | 1.4 | 1.6 |
| 2027/2028 | Note ..: not available for a specific reference period | 1.2 | 1.4 | 1.6 |
| 2028/2029 | Note ..: not available for a specific reference period | 1.2 | 1.4 | 1.6 |
| 2029/2030 | Note ..: not available for a specific reference period | 1.2 | 1.4 | 1.7 |
| 2030/2031 | Note ..: not available for a specific reference period | 1.2 | 1.4 | 1.7 |
| 2031/2032 | Note ..: not available for a specific reference period | 1.2 | 1.4 | 1.7 |
| 2032/2033 | Note ..: not available for a specific reference period | 1.2 | 1.4 | 1.7 |
| 2033/2034 | Note ..: not available for a specific reference period | 1.2 | 1.4 | 1.7 |
| 2034/2035 | Note ..: not available for a specific reference period | 1.2 | 1.5 | 1.7 |
| 2035/2036 | Note ..: not available for a specific reference period | 1.2 | 1.5 | 1.7 |
| 2036/2037 | Note ..: not available for a specific reference period | 1.2 | 1.5 | 1.7 |
| 2037/2038 | Note ..: not available for a specific reference period | 1.2 | 1.5 | 1.7 |
| 2038/2039 | Note ..: not available for a specific reference period | 1.2 | 1.5 | 1.7 |
| 2039/2040 | Note ..: not available for a specific reference period | 1.2 | 1.5 | 1.7 |
| 2040/2041 | Note ..: not available for a specific reference period | 1.2 | 1.5 | 1.7 |
| 2041/2042 | Note ..: not available for a specific reference period | 1.2 | 1.5 | 1.7 |
|
.. not available for a specific reference period Source: Statistics Canada, Centre for Demography. |
||||
The composition of emigrants is based on observed data for the period from 1995 to 2016 which were obtained by linking the Longitudinal Administrative Databank (LAD) to the Longitudinal Immigration Database (IMDB). Analysis of these data shows that the characteristics of emigrants have remained stable over time. That is why only one assumption is proposed. According to this assumption, immigrants who have been in Canada for 15 years or less are more likely to emigrate than the rest of the population, with the exception of immigrants who arrived less than three years earlier and whose birthplace is not Western or Northern Europe, North America or Eastern Asia.
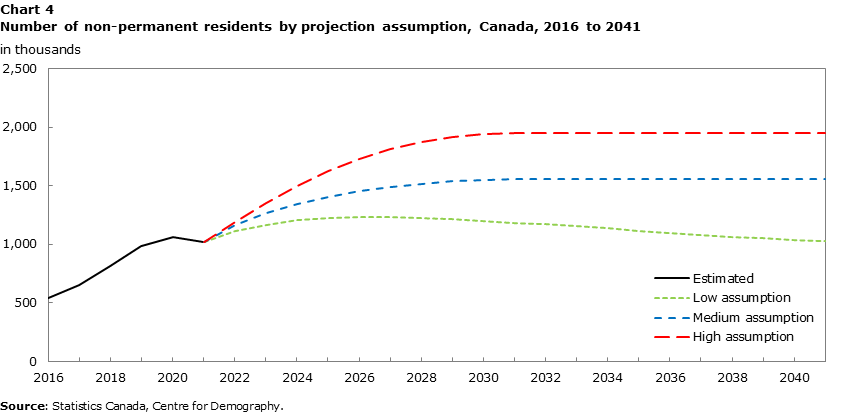
Non-permanent residents
Non-permanent residents (NPRs) are persons who have been legally granted the right to live in Canada on a temporary basis under a temporary resident permit, along with members of their family living with them. They include individuals holding visitor permits, work permits, student permits, Minister’s permits, as well as refugee status claimants (Statistics Canada 2016).
Since the early 2000s, except on rare occasions, Canada’s NPR population has increased.Note Between 2016/2017 and 2018/2019, net NPRs (i.e., the difference between the number of NPRs entering and leaving the country) even surpassed 100,000 annually, a level never before seen over a three-year period since data for this component have been collected. The COVID-19 pandemic then severely restricted NPRs’ arrivals and departures; net NPRs decreased in 2019/2020 and 2020/2021 (and were even negative for this year). Preliminary data for 2021/2022 indicate that net NPRs increased from the previous year.Note
Over the past few years, IRCC has made substantial changes to its programs to facilitate admissions of international students and workers in sectors deemed essential or with urgent labour needs (Griffith 2022). The number of study permit holders more than doubled between 2013 and 2019 (Immigration, Refugees and Citizenship Canada 2022-2). Although the pandemic resulted in 2020 in a decrease in the number of study permit holders, permit holders under the International Mobility Program (IMP) and permit holders under the Temporary Foreign Worker (TFW) Program, numbers bounced back in 2021 to levels very similar to what was observed in 2019 for these three NPR categories (Immigration, Refugees and Citizenship Canada 2022-3; 2022-4).
Starting in 2020, to address some of the barriers caused by the pandemic, the IRCC adopted a number of temporary measures to make it easier for NPRs to enter or stay in the country (Immigration, Refugees and Citizenship Canada, 2022-1). For example, additional measures have been taken to address labour shortages in many sectors of the Canadian economy. These measures mainly affect foreign workers (Employment and Social Development Canada, 2022) but also students and visitors (Immigration, Refugees and Citizenship Canada, 2022-5). In addition, programs have been designed to welcome Ukrainians wishing to flee the war (Immigration, Refugees and Citizenship Canada, 2022-6). All these measures have the potential to increase the number of NPRs living in Canada in the coming years, although it is difficult to estimate the magnitude of the impacts. This context drove the development of the three assumptions selected for the future evolution of the NPR population.
It should be noted that the NPR stock at the start of the projection reflects (adjusted) estimates from the 2016 Census. The resulting total number of NPRs is 538,000.Note From this starting point, the size of this population is changed over time by adding or subtracting the net annual change in the number of NPRs, depending on the assumption selected.
For the period from May 2016 to June 2021, it is assumed that the number of NPRs varies by adding or subtracting (as applicable) the net annual change in NPRs published by the DEP at the CMA level. Subsequently, three projection assumptions are proposed. In all cases, these assumptions assume an increase in the NPR population in the first few years.
Under the medium assumption, the net annual change in NPRs for 2021/2022 is set at 145,000 people, which corresponds to the average observed over the three years preceding the pandemic (2016/2017 to 2018/2019). The net annual changes observed during those years were a record. Given the recent context, it is expected that these levels could be reached again in the very short term. Then, the assumption assumes a downward trend in net NPRs (which would still remain positive) following a logarithmic curve, suggesting a faster decrease at the beginning of the projection and a slower decrease toward the end, so as to reach a net change of zero over a 10-year period. From 2030/2031 to the end of the projection, the net change is held at zero and the number of NPRs remains stable. This means that for each non-permanent resident leaving the country or becoming an immigrant, another NPR is admitted. Thus, in 2041, the number of NPRs would reach 1,556,000 under this assumption (Chart 4).
Data table for Chart 4
| Year | Estimated | Low assumption | Medium assumption | High assumption |
|---|---|---|---|---|
| in thousands | ||||
| 2016 | 538 | Note ..: not available for a specific reference period | Note ..: not available for a specific reference period | Note ..: not available for a specific reference period |
| 2017 | 655 | Note ..: not available for a specific reference period | Note ..: not available for a specific reference period | Note ..: not available for a specific reference period |
| 2018 | 818 | Note ..: not available for a specific reference period | Note ..: not available for a specific reference period | Note ..: not available for a specific reference period |
| 2019 | 986 | Note ..: not available for a specific reference period | Note ..: not available for a specific reference period | Note ..: not available for a specific reference period |
| 2020 | 1,063 | Note ..: not available for a specific reference period | Note ..: not available for a specific reference period | Note ..: not available for a specific reference period |
| 2021 | 1,020 | Note ..: not available for a specific reference period | Note ..: not available for a specific reference period | Note ..: not available for a specific reference period |
| 2022 | Note ..: not available for a specific reference period | 1,112 | 1,165 | 1,188 |
| 2023 | Note ..: not available for a specific reference period | 1,168 | 1,268 | 1,349 |
| 2024 | Note ..: not available for a specific reference period | 1,204 | 1,347 | 1,496 |
| 2025 | Note ..: not available for a specific reference period | 1,225 | 1,408 | 1,625 |
| 2026 | Note ..: not available for a specific reference period | 1,234 | 1,455 | 1,732 |
| 2027 | Note ..: not available for a specific reference period | 1,230 | 1,492 | 1,816 |
| 2028 | Note ..: not available for a specific reference period | 1,223 | 1,519 | 1,878 |
| 2029 | Note ..: not available for a specific reference period | 1,213 | 1,539 | 1,918 |
| 2030 | Note ..: not available for a specific reference period | 1,201 | 1,551 | 1,939 |
| 2031 | Note ..: not available for a specific reference period | 1,186 | 1,556 | 1,947 |
| 2032 | Note ..: not available for a specific reference period | 1,171 | 1,556 | 1,947 |
| 2033 | Note ..: not available for a specific reference period | 1,154 | 1,556 | 1,947 |
| 2034 | Note ..: not available for a specific reference period | 1,136 | 1,556 | 1,947 |
| 2035 | Note ..: not available for a specific reference period | 1,118 | 1,556 | 1,947 |
| 2036 | Note ..: not available for a specific reference period | 1,100 | 1,556 | 1,947 |
| 2037 | Note ..: not available for a specific reference period | 1,083 | 1,556 | 1,947 |
| 2038 | Note ..: not available for a specific reference period | 1,067 | 1,556 | 1,947 |
| 2039 | Note ..: not available for a specific reference period | 1,053 | 1,556 | 1,947 |
| 2040 | Note ..: not available for a specific reference period | 1,041 | 1,556 | 1,947 |
| 2041 | Note ..: not available for a specific reference period | 1,031 | 1,556 | 1,947 |
|
.. not available for a specific reference period Source: Statistics Canada, Centre for Demography. |
||||
Under the high assumption, it is assumed that for 2021/2022, the net change in NPRs will be equal to the highest level reached in recent years prior to the pandemic (168,500). This level—observed in 2018/2019—is also the highest ever recorded. Then, as with the medium assumption, the net annual change will decrease to zero after 10 years, but this time following a cubic increase, suggesting a path that, when compared with a linear path, decreases more slowly in the first half of the projection and faster in the second half. Under this assumption, the number of NPRs would reach 1,947,000 in 2041.
Finally, the low assumption assumes that there will be a short-term increase in the number of NPRs, but that the cumulative net change for the period 2021/2022 to 2042/2043 will be zero. Under this assumption, the net change in the number of NPRs for 2021/2022 corresponds to the average of the five years preceding the pandemic, then decreases to zero within five years. The net change then decreases following a cubic interpolation so that the cumulative gains over the period reach zero in 2043. In 2041, this assumption assumes that the number of NPRs would reach 1,031,000.
These three assumptions are matched by a single assumption about the geographical distribution of the net annual change in NPRs by region of residence. This assumption is based on an analysis conducted using (adjusted) data from the 2001, 2006 and 2016 censuses and the 2011 National Household Survey (NHS). According to this analysis, the geographic distribution of the NPR stock is remarkably stable over time and the variations observed from one period to the next are generally small. In the end, it is assumed that the geographical distribution of the net annual change in the number of NPRs will remain stable from 2021/2022 to 2041/2042 and that it will correspond to the average of the geographical distribution of the NPR stock observed in 2001, 2006, 2011 and 2016.
Internal migration
Internal migration refers to the movement of people between the different regions of Canada. Data analysis shows that internal migration is one of the most volatile components over time. Migration flows are indeed particularly sensitive to various social and economic factors (Chastko 2021; Statistics Canada 2019-2; Smith 1986). In addition, for some regions, migration is a significant, if not the most important, component of population growth (Table 3). For all these reasons, five distinct assumptions were used in these projections. In all assumptions, for the period from May 2016 to June 2021, the sizes of migration flows at the CMA level were calibrated to reflect the DEP data.
| Region | 1996/2001 | 2001/2006 | 2006/2011 | 2011/2016 |
|---|---|---|---|---|
| in thousands | ||||
| Newfoundland and Labrador | ||||
| St. John's | -6.3 | 3.1 | 6.2 | 2.5 |
| Rest of Newfoundland and Labrador | -25.7 | -10.7 | -1.5 | 0.9 |
| Prince Edward Island | -0.2 | 0.4 | 0.4 | -0.8 |
| Nova Scotia | ||||
| Halifax | 8.0 | -1.4 | -1.8 | -6.6 |
| Rest of Nova Scotia | -10.3 | -7.1 | -1.7 | -2.3 |
| New Brunswick | ||||
| Moncton | 2.1 | 3.4 | 3.3 | 0.2 |
| Saint John | -2.4 | -3.5 | 0.5 | -2.7 |
| Rest of New Brunswick | -9.0 | -11.2 | -4.8 | -5.7 |
| Quebec | ||||
| Saguenay | -6.2 | -4.9 | -1.7 | -0.7 |
| Québec | -14.9 | 5.6 | 3.2 | -1.4 |
| Sherbrooke | -0.3 | 2.5 | -1.9 | -0.5 |
| Trois-Rivières | -2.6 | -0.7 | -1.0 | 1.0 |
| Montréal | -2.6 | -36.4 | -51.5 | -66.0 |
| Ottawa - Gatineau (Quebec part) | 2.5 | 9.1 | 6.8 | -1.0 |
| Rest of Quebec | -31.2 | 11.3 | 22.6 | 28.3 |
| Ontario | ||||
| Ottawa - Gatineau (Ontario part) | 27.6 | -2.4 | 11.2 | -1.7 |
| Kingston | 0.8 | 0.2 | -1.2 | -3.3 |
| Belleville | -0.9 | 2.6 | 1.1 | 1.7 |
| Peterborough | 0.4 | 2.6 | -0.1 | 1.8 |
| Oshawa | 18.5 | 19.9 | 9.2 | 9.9 |
| Toronto | -44.2 | -107.7 | -73.4 | -111.6 |
| Hamilton | 17.3 | 0.1 | 0.5 | 5.7 |
| St. Catharines - Niagara | 3.2 | -0.6 | -3.0 | 9.1 |
| Kitchener - Cambridge - Waterloo | 8.9 | 6.3 | -2.6 | -5.5 |
| Brantford | 1.8 | 3.3 | 2.3 | 3.5 |
| Guelph | 3.7 | 0.6 | -2.1 | -0.8 |
| London | -0.7 | -0.1 | -4.6 | -2.9 |
| Windsor | 6.2 | -3.2 | -9.0 | 1.8 |
| Barrie | 22.3 | 17.0 | 4.2 | 4.6 |
| Greater Sudbury | -8.0 | 0.0 | -1.5 | -1.7 |
| Thunder Bay | -5.3 | -0.4 | 0.6 | -1.1 |
| Rest of Ontario | -0.3 | 36.9 | 20.5 | 51.4 |
| Manitoba | ||||
| Winnipeg | -8.8 | -12.0 | -11.2 | -16.9 |
| Rest of Manitoba | -11.1 | -10.0 | -0.8 | -1.1 |
| Saskatchewan | ||||
| Regina | -6.5 | -4.1 | 3.5 | 1.1 |
| Saskatoon | -2.2 | -4.8 | 3.8 | 1.5 |
| Rest of Saskatchewan | -18.1 | -18.4 | 9.3 | -1.4 |
| Alberta | ||||
| Lethbridge | 1.9 | 1.6 | 2.8 | 2.6 |
| Calgary | 58.8 | 29.2 | -4.3 | 28.2 |
| Edmonton | 29.5 | 32.1 | 15.8 | 35.1 |
| Rest of Alberta | 32.3 | 30.4 | 15.5 | 3.4 |
| British Columbia | ||||
| Kelowna | 9.1 | 12.9 | 10.3 | 11.2 |
| Vancouver | -19.5 | -21.7 | -9.0 | -23.3 |
| Victoria | 2.7 | 8.0 | 7.9 | 8.1 |
| Abbotsford - Mission | 2.9 | 0.7 | -0.2 | 3.1 |
| Rest of British Columbia | -17.2 | 23.5 | 28.4 | 43.0 |
| Yukon | -2.8 | -0.2 | 0.6 | 0.6 |
| Northwest Territories | -2.8 | -0.9 | -1.2 | -1.3 |
| Nunavut | -0.3 | -0.3 | 0.2 | 0.1 |
|
Note: Net migration is the number of in-migrants minus the number of out-migrants in a region during a given period. Sources: Statistics Canada, 2001, 2006 and 2016 censuses (adjusted) and the 2011 National Household Survey (adjusted). |
||||
The first assumption is the same as the one used in the publication Projections of the Indigenous Populations and Households in Canada, 2016 to 2041 (Statistics Canada 2021). In this assumption, the contribution of internal migration to population growth in the different parts of the country is a reflection of what was observed on average during the 1996-to-2001, 2001-to-2006, 2006-to-2011 and 2011-to-2016 intercensal periods. The other four assumptions differ in that the contribution of migration to the increase in particular parts of the country is not based on the average of the four periods, but on only one of them: 2011 to 2016 for the second assumption, 2006 to 2011 for the third assumption, 2001 to 2006 for the fourth, and 1996 to 2001 for the fifth.
Only one assumption was selected for the composition of migration flows. It is the same as the one used in the publication Projections of the Indigenous Populations and Households in Canada, 2016 to 2041 (Statistics Canada 2021). It is consistent with the average composition of migration observed during the combined periods 2000/2001, 2005/2006 and 2010/2011 and 2015/2016. Analysis of the data from the 2001, 2006 and 2016 censuses and the 2011 NHS shows that the composition of migration flows changes little over time.
Analyses using census data show that some population groups are more likely to migrate than others. This is the case for highly educated people, people aged 15 to 34, people without children, people who know both English and French, and immigrants, especially those who have recently arrived in Canada. Immigrants also differ from non-immigrants due to their preferences in terms of destination, being less likely to move to non-CMA regions (Statistics Canada 2017). Conversely, people in racialized groups are less likely to migrate than the rest of the population. These observations apply to the national level but may differ slightly from region to region (Dion and Coulombe 2008).
Note that the volume and direction of migration flows are determined using the five-year mobility variable of the 2001, 2006 and 2016 censuses and the 2011 NHS. Since it covers many years, this variable paints a robust picture of the interregional migration patterns observed in the past. Conversely, the disaggregation of migration rates by individual characteristics is carried out using the one-year mobility variable of the 2001, 2006 and 2016 censuses and the 2011 NHS. Because it covers migration in only one year, therefore close to the time of migration, this variable better reflects the characteristics of migrants (see Statistics Canada 2021 for more details).Note
Fertility
Fertility, like mortality and international migration, is a major component of Canada’s population growth. It also plays a leading role in changes in the age structure of the population.
The total fertility rate (TFR) has been steadily declining in recent years. It decreased from 1.69 children per woman in 2008 to 1.47 in 2019.Note In 2020, this decline accelerated, and the TFR reached a record low of 1.40 children per woman. The precise reasons for this latest decline, the largest year-over-year decline since 2008, are difficult to determine. This may be a continuation of the trend observed for almost 13 years, but it could also be due in part to the COVID-19 pandemic. The border closures during the first months of the pandemic could also have an impact by reducing the number of people entering the country and having a child shortly after landing.
For 2021, data for Quebec and British Columbia show that between December 2020 and February 2021, the number of births was much lower than for the same period one year earlier (Institut de la statistique du Québec 2022; BC Stat 2022). However, from March to December 2021, the number of births exceeded that of the previous year, so that in total there were more births in 2021 than in 2020, and as many as in 2019.Note For Ontario, there was a 0.9% increase in births in the first quarter of 2021 compared with the same quarter in 2020 (Government of Ontario 2022).
Studies show that in times of great uncertainty, people tend to avoid making significant changes to their lives, such as having a child (Sobotka et al. 2011; Alderotti et al. 2019). Echoing the above, the results of the Canadian Social Survey – COVID-19 and Wellness, which was conducted between April and June 2021, show that nearly 19% of people between 15 and 49 now wanted to have fewer children or wanted to postpone having a child because of the COVID-19 pandemic (while only 4% reported that they wanted to have more children or one child earlier than previously planned) (Fostik and Galbraith 2021).
For the period from 2016 to 2020, the rates used in the projection correspond to the rates observed at the Canada level during the period. An adjustment to births by province and territory is made to match DEP estimates for this period. Starting in 2021, three distinct fertility assumptions have been proposed. These assumptions are consistent with those developed in the Population Projections for Canada (2018 to 2068), Provinces and Territories (2018 to 2043) (Galbraith et al. 2019).Note Thus, each assumption is the result of a combination of recent trends (2009 to 2019) and long-term targets. However, unlike the Population Projections for Canada (2018 to 2068), Provinces and Territories (2018 to 2043), the short-term trends were calculated at the Canada level rather than at the provincial and territorial level, which means that is assumed that fertility will change in the same way in all provinces and all territories during the projection.
The assumptions were developed considering the current context referred to above, i.e., the observed decline in fertility and the upheavals likely caused by the pandemic. According to the medium assumption, the TFR will reach 1.45 in 2021, decrease slightly to 1.44 in 2024, and then increase steadily to reach the target of 1.59 in 2041 (Chart 5).

Data table for Chart 5
| Year | Estimated | Low assumption | Medium assumption | High assumption |
|---|---|---|---|---|
| children per woman | ||||
| 2016 | 1.59 | Note ..: not available for a specific reference period | Note ..: not available for a specific reference period | Note ..: not available for a specific reference period |
| 2017 | 1.54 | Note ..: not available for a specific reference period | Note ..: not available for a specific reference period | Note ..: not available for a specific reference period |
| 2018 | 1.50 | Note ..: not available for a specific reference period | Note ..: not available for a specific reference period | Note ..: not available for a specific reference period |
| 2019 | 1.47 | Note ..: not available for a specific reference period | Note ..: not available for a specific reference period | Note ..: not available for a specific reference period |
| 2020 | 1.40 | Note ..: not available for a specific reference period | Note ..: not available for a specific reference period | Note ..: not available for a specific reference period |
| 2021 | Note ..: not available for a specific reference period | 1.35 | 1.45 | 1.51 |
| 2022 | Note ..: not available for a specific reference period | 1.32 | 1.44 | 1.52 |
| 2023 | Note ..: not available for a specific reference period | 1.30 | 1.44 | 1.53 |
| 2024 | Note ..: not available for a specific reference period | 1.29 | 1.44 | 1.54 |
| 2025 | Note ..: not available for a specific reference period | 1.28 | 1.44 | 1.55 |
| 2026 | Note ..: not available for a specific reference period | 1.28 | 1.45 | 1.57 |
| 2027 | Note ..: not available for a specific reference period | 1.28 | 1.45 | 1.58 |
| 2028 | Note ..: not available for a specific reference period | 1.28 | 1.46 | 1.59 |
| 2029 | Note ..: not available for a specific reference period | 1.28 | 1.46 | 1.60 |
| 2030 | Note ..: not available for a specific reference period | 1.29 | 1.47 | 1.62 |
| 2031 | Note ..: not available for a specific reference period | 1.29 | 1.48 | 1.63 |
| 2032 | Note ..: not available for a specific reference period | 1.30 | 1.49 | 1.64 |
| 2033 | Note ..: not available for a specific reference period | 1.31 | 1.50 | 1.66 |
| 2034 | Note ..: not available for a specific reference period | 1.32 | 1.51 | 1.67 |
| 2035 | Note ..: not available for a specific reference period | 1.33 | 1.52 | 1.69 |
| 2036 | Note ..: not available for a specific reference period | 1.34 | 1.53 | 1.70 |
| 2037 | Note ..: not available for a specific reference period | 1.35 | 1.54 | 1.72 |
| 2038 | Note ..: not available for a specific reference period | 1.36 | 1.55 | 1.74 |
| 2039 | Note ..: not available for a specific reference period | 1.37 | 1.56 | 1.75 |
| 2040 | Note ..: not available for a specific reference period | 1.39 | 1.58 | 1.77 |
| 2041 | Note ..: not available for a specific reference period | 1.40 | 1.59 | 1.79 |
|
.. not available for a specific reference period Note: The total fertility rates shown in this figure are theoretical targets. In practice, changes in the composition of the population could cause the projected values to diverge. Source: Statistics Canada, Centre for Demography. |
||||
The high assumption assumes a substantial fertility rebound from 2021 with a TFR of 1.51 and a steady increase to a target of 1.79 in 2041. Finally, the low assumption assumes that the TFR will decline to 1.28 in 2027 and then rise to the target of 1.40 set in 2041. Taking as a starting point the low level of the TFR estimated in 2020 (1.40) and assuming a continuation of recent downward trends and the potential effects of the pandemic, this assumption is a downward revision of the low fertility assumption proposed in the 2019 Canadian population projections (Statistics Canada 2019-2).
Only one assumption has been used for relative fertility differences based on certain characteristics, including racialized group, place of birth, immigrant status and time elapsed since immigration, generation status, immigration admission category, Indigenous group, Registered Indian status, marital status, education, mother tongue and detailed place of residence. Under this assumption, the fertility gaps between groups as estimated in 2015/2016 will continue. The decision to use only one assumption was based on an analysis of past trends that reveals that fertility differences between the groups are quite stable over time (Morency and Caron-Malenfant 2014) (see Chart 6 for an example of changes in fertility for different racialized groups). Among the individual characteristics most correlated with fertility, it is noted that people living as a couple (married or common-law), recent immigrants and persons in the Arab racialized group have a higher probability of giving birth to a child. In contrast, people who are not in a relationship, and those belonging to the Chinese or Korean racialized groups, have a lower probability of giving birth (Statistics Canada 2017; Bélanger and Gilbert 2003; Caron-Malenfant and Bélanger 2006).
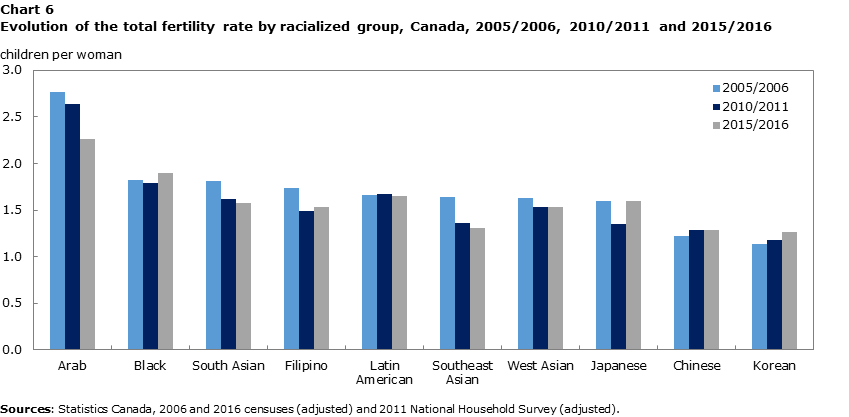
Data table for Chart 6
| Racialized group | 2005/2006 | 2010/2011 | 2015/2016 |
|---|---|---|---|
| children per woman | |||
| Arab | 2.77 | 2.64 | 2.26 |
| Black | 1.82 | 1.79 | 1.90 |
| South Asian | 1.81 | 1.62 | 1.58 |
| Filipino | 1.74 | 1.49 | 1.53 |
| Latin American | 1.66 | 1.67 | 1.65 |
| Southeast Asian | 1.64 | 1.36 | 1.31 |
| West Asian | 1.63 | 1.53 | 1.53 |
| Japanese | 1.60 | 1.35 | 1.60 |
| Chinese | 1.22 | 1.29 | 1.29 |
| Korean | 1.14 | 1.18 | 1.27 |
| Sources: Statistics Canada, 2006 and 2016 censuses (adjusted) and 2011 National Household Survey (adjusted). | |||
Assignment of a racialized group to newborns
Children whose mothers belong to a racialized group also belong, for the most part, to the same group. However, the probability that the mother “transmits” this characteristic to her child is not 100%. In reality, intergenerational differences are mostly related to mixed unions. That said, since information about the father is often missing and less reliable, and since it is possible to replicate past trends by considering only the mother’s characteristics, children born in the simulation are considered as belonging to a racialized group based on the mother’s characteristics only.
The probability of transmission of the racialized group is the subject of a single assumption in these projections. The assignment of a racialized group to newborns is based on the assumption that transmission patterns remain the same as those estimated between mothers and the youngest children in the 2016 Census. The decision to use only one assumption is based on the high stability of racialized group transmission rates from mother to child (Chart 7).
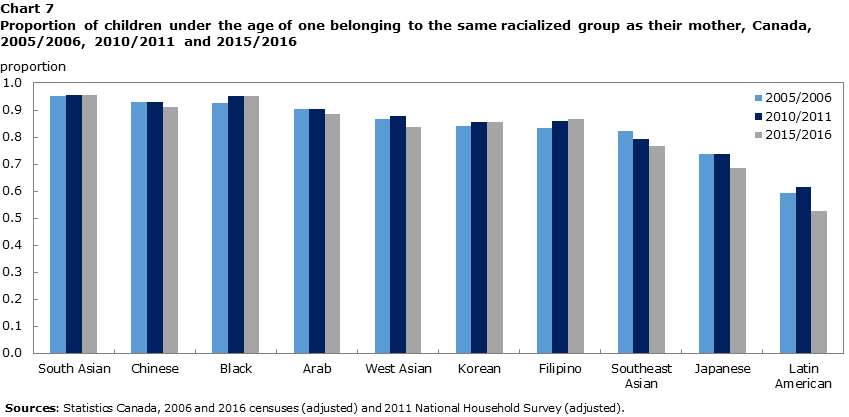
Data table for Chart 7
| Racialized group | 2005/2006 | 2010/2011 | 2015/2016 |
|---|---|---|---|
| proportion | |||
| South Asian | 0.95 | 0.95 | 0.96 |
| Chinese | 0.93 | 0.93 | 0.91 |
| Black | 0.93 | 0.95 | 0.95 |
| Arab | 0.90 | 0.91 | 0.89 |
| West Asian | 0.87 | 0.88 | 0.84 |
| Korean | 0.84 | 0.86 | 0.86 |
| Filipino | 0.83 | 0.86 | 0.87 |
| Southeast Asian | 0.82 | 0.79 | 0.77 |
| Japanese | 0.74 | 0.74 | 0.68 |
| Latin American | 0.59 | 0.62 | 0.53 |
| Sources: Statistics Canada, 2006 and 2016 censuses (adjusted) and 2011 National Household Survey (adjusted). | |||
Mortality
Over the past few decades, the life expectancy of the Canadian population has increased steadily (Statistics Canada 2019-2; Shumanty 2018; Nagnur 1986). In contrast, in 2020, due to the COVID-19 pandemic, life expectancy in Canada and many other countries declined (Aburto et al. 2022). Thus, compared with 2019, life expectancy measured in Canada in 2020Note was half a year shorter. This is the largest year-over-year decline since 1921, when the collection of national vital statistics was initiated (Statistics Canada 2022-4). In 2020, COVID-19 was the third leading cause of death in Canada with 16,151 Canadians who died directly from the disease (Statistics Canada 2022-4). The decline in life expectancy may also be due in part to the indirect impacts of the pandemic, due in particular to the reluctance of some people to seek medical care in such a context or the reduced capacity of health systems to accommodate patients. Given the substantial number of deaths caused by COVID-19 in 2021 and 2022 (Public Health Agency of Canada 2022) and the episodes of excess mortality observed in 2021 (Statistics Canada 2022-4), it is highly likely that the impact of the pandemic on the evolution of life expectancy will be felt beyond 2020.
In light of the above, three assumptions have been developed with respect to the future evolution of mortality rates (and therefore life expectancy) to reflect secular trends in life expectancy, while taking into account the potential impact of the pandemic on the evolution of mortality in Canada in the coming years.
These three assumptions were developed in two phases. First, it is assumed that mortality rates by age and sex in Canada for the low, medium and high assumptions progress in the same way as those of the equivalent assumptions in the Population Projections for Canada (2018 to 2068), Provinces and Territories (2018 to 2043) (Statistics Canada 2019-2).Note It should be noted that for the years 2016 to 2021, a calibration was carried out so that the projection generates a number of deaths by province and territory corresponding to that estimated by the DEP. Second, to consider the potential impact of COVID-19 in the years to come (i.e., from 2022 onward) on mortality in Canada, COVID-specific mortality rates (distinct for each of the three assumptions), which are broken down by age, sex and province or territory of residence, are added to the first series of rates. See Box 3 for more details on the derivation of these COVID mortality rates.
Start of text box 3
Box 3. Description of the approach to develop the three assumptions to account for mortality caused by COVID-19
The COVID-19 pandemic could have a more or less significant impact on mortality in the coming years. This will depend on how the virus evolves. Many researchers, immunologists and virologists believe that SARS-CoV-2 will become endemic, i.e., it will continue to circulate, but that the number of infections will be relatively stable over time. However, this endemic nature does not mean that the virus will become harmless. Even if it enters an endemic phase, the virus could still cause outbreaks; for example, as is observed with influenza (Callaway 2021). To take into account the impact the virus had and may have in the future on mortality in Canada, “COVID” mortality rates by age, sex and province or territory of residence that differ for each assumption are added to the mortality rates obtained from population projections for Canada (Statistics Canada 2019-2). The addition of these rates is intended to reflect, among other things, the transition from a pandemic to an endemic situation and changes the intensity of mortality caused by the disease over time.
- The medium assumption of mortality caused by COVID assumes that COVID mortality rates converge from the rates observed in 2021 and part of 2022 to an “endemic” level by 2024. This assumes that the virus will reach an endemic phase with impacts proportional to those observed in the past for influenza (based on the average number of deaths attributed to influenza between 2014 and 2020 [Statistics Canada 2022-5]).
- The low COVID mortality assumption involves a rapid convergence toward the endemic level (reached in 2022) followed by zero COVID mortality from 2023. It highlights the potential for public health measures to have a protective effect, especially for those most at risk of dying from COVID and the possibility that COVID will no longer have a long-term impact.
- Under the high COVID mortality assumption, COVID mortality will gradually converge from recently observed rates to targets that are twice the endemic level described above within four years (reached in 2024).
End of text box 3
In short, under the low assumption, life expectancy at birth would reach 83.5 years and 87.4 years for men and women, respectively, in 2041.Note Under the medium assumption, it would reach 84.8 years for men and 88.4 years for women in 2041, while it would reach 85.8 years for men and 89.6 years for women under the high assumption.
Finally, only one assumption was used to account for differences in mortality among the various projected population groups. Under this assumption, differences in mortality observed in the 2006 and 2011 Canadian Census Health and Environment Cohorts (CanCHECs) data are kept constant during the projection. CanCHECs are databases that combine information from the detailed census questionnaire (or the 2011 National Household Survey) with administrative health data (e.g., on deaths) and annual mailing address postal codes.Note
Differences between groups, calculated separately for each sex, were obtained by applying proportional hazards regression model (Cox models) to these data. CanCHEC data show that the mortality of immigrants is lower than that of Canadian-born individuals, particularly recent immigrants, and that this gap tends to decrease with the time elapsed since immigration. These results are consistent with those observed in the literature (Lu and Ng 2019; Vang et al. 2015; Omariba et al. 2014; Trovato and Odynak 2011). Furthermore, the data also show that mortality is lower among the most educated (Bushnik et al. 2020; Tjepkema et al. 2012) and among those belonging to racialized group, both among men and women. Under this assumption, differential mortality would remain unchanged throughout the projection period.
Other assumptions
Some components of the projections, such as education, change in marital status, or the acquisition of Canadian citizenship, do not have a direct impact on population growth but affect population composition. Table 4 summarizes the assumptions developed for these components.
| Component | Assumption |
|---|---|
| Education | Gradual capping of the upward trend in education attainment. |
| Differences between projected groups are kept constant. | |
| Change in marital status | Gradual slowing of marital status trends for the entire population. |
| Acquisition of Canadian citizenship | Rates of Canadian citizenship acquisition by immigrants are kept constant at the level estimated for 2016. |
| Source: Statistics Canada, Centre for Demography. | |
Although these projections are not intended to provide a portrait of Indigenous populations, they nevertheless incorporate assumptions that apply exclusively to these populations and that were developed for the Projections of the Indigenous populations and households in Canada, 2016 to 2041 (Statistics Canada 2021). Table 5 summarizes these assumptions.
| Component | Assumption |
|---|---|
| Fertility | Fertility differences between Indigenous and non-Indigenous populations are kept constant until 2041. |
| Mortality | Differences in life expectancy between Indigenous and non-Indigenous populations are kept constant. |
| International migration | No international migration (immigration and emigration). |
| Intergenerational transmission of certain characteristics specific to Indigenous populations | Rates of intergenerational transmission of the Indigenous group are kept constant to their 2015/2016 levels. |
| Rates of intergenerational transmission of the Registered or Treaty Indian status and of the registration category are kept constant to their 2015/2016 levels, but trends observed from 2011 to 2016 for mixed unions (by Registered or Treaty Indian status) are continued. | |
| Intragenerational ethnic mobility | At the start of the projection, transition rates are those estimated for the period from 2011 to 2016 but they converge at the end of the projection on the average rates estimated for the period from 1996 to 2016. |
|
Note: In almost all scenarios of these projections, the assumptions that apply exclusively to the growth and composition of Indigenous populations are the same as those in the scenario of medium growth of the Indigenous populations in the Projections of the Indigenous populations and households in Canada, 2016 to 2041 (Statistics Canada 2021). There are only two exceptions to this rule. The low-growth scenario combines the low-fertility and high-mortality assumptions (from the scenario of low growth of the Indigenous populations) whereas the high-growth scenario combines the high-fertility and low-mortality assumptions (from the scenario of high growth of the Indigenous populations). See the “Scenario” section for more details. Source: Statistics Canada, Centre for Demography. |
|
Scenarios
A projection scenario can be developed by combining the assumptions relating to each component. In this projection exercise, 11 separate projection scenarios are proposed (Table 6).
| Scenarios | Immigration level | Provincial and territorial distribution of immigrants upon arrival | Composition of immigration by place of birth | Emigration | Number of non-permanent residents | Fertility | Life expectancy | Internal migration |
|---|---|---|---|---|---|---|---|---|
| 1. Reference | Rate reaching 8.3 immigrants per 1,000 inhabitants in 2041 | Progressive convergence of the distribution observed in 2021 towards the average distribution observed from 2007 to 2021 by 2041 | Progressive convergence of the average composition observed between 2017 and 2021 towards the average composition observed from 2007 to 2021 by 2041 | - Gross migraproduction rate reaching 1.5 emigrants per 1,000 inhabitants in 2041 - Differential emigration: constant |
Number reaching 1,557,000 persons in 2041 | - Total fertility rate reaching 1.59 children per woman in 2041 - Differential fertility: constant |
- Growth : Medium - Differential mortality: constant |
- Composition: average of the periods 2000/2001, 2005/2006, 2010/2011 and 2015/2016 - Level: average of the periods 1996/2001, 2001/2006, 2006/2011 and 2011/2016 |
| 2. Low immigration | Rate reaching 6.5 immigrants per 1,000 inhabitants in 2041 | Identical to the reference scenario | Identical to the reference scenario | Identical to the reference scenario | Identical to the reference scenario | Identical to the reference scenario | Identical to the reference scenario | Identical to the reference scenario |
| 3. High immigration | Rate maintained at 11.9 immigrants per 1,000 inhabitants between 2025 and 2041 | Identical to the reference scenario | Identical to the reference scenario | Identical to the reference scenario | Identical to the reference scenario | Identical to the reference scenario | Identical to the reference scenario | Identical to the reference scenario |
| 4. Alternative geographical distribution of immigrants upon arrival | Identical to the reference scenario | Progressive convergence of the distribution observed in 2021 towards the average distribution observed from 2017 to 2021 by 2041 | Identical to the reference scenario | Identical to the reference scenario | Identical to the reference scenario | Identical to the reference scenario | Identical to the reference scenario | Identical to the reference scenario |
| 5. Alternative composition of immigration by place of birth | Identical to the reference scenario | Identical to the reference scenario | Average composition observed from 2017 to 2021 maintained constant until 2041 | Identical to the reference scenario | Identical to the reference scenario | Identical to the reference scenario | Identical to the reference scenario | Identical to the reference scenario |
| 6. Low growth | Rate reaching 6.5 immigrants per 1,000 inhabitants in 2041 | Identical to the reference scenario | Identical to the reference scenario | - Gross migraproduction rate reaching 1.7 emigrants per 1,000 inhabitants in 2041 - Differential emigration: constant |
Number reaching 1,031,000 persons in 2041 | - Total fertility rate reaching 1.40 children per woman in 2041 - Differential fertility: constant |
- Growth: low - Differential mortality: constant |
Identical to the reference scenario |
| 7. High growth | Rate maintained at 11.9 immigrants per 1,000 inhabitants between 2025 and 2041 | Identical to the reference scenario | Identical to the reference scenario | - Gross migraproduction rate reaching 1.2 emigrants per 1,000 inhabitants in 2041 - Differential emigration: constant |
Number reaching 1,947,000 persons in 2041 | - Total fertility rate reaching 1.79 children per woman in 2041 - Differential fertility: constant |
- Growth: high - Differential mortality: constant |
Identical to the reference scenario |
| 8. Alternative internal migration (2011 to 2016) | Identical to the reference scenario | Identical to the reference scenario | Identical to the reference scenario | Identical to the reference scenario | Identical to the reference scenario | Identical to the reference scenario | Identical to the reference scenario | - Composition: average of the periods 2000/2001, 2005/2006, 2010/2011 and 2015/2016 - Level: 2011/2016 |
| 9. Alternative internal migration (2006 to 2011) | Identical to the reference scenario | Identical to the reference scenario | Identical to the reference scenario | Identical to the reference scenario | Identical to the reference scenario | Identical to the reference scenario | Identical to the reference scenario | - Composition: average of the periods 2000/2001, 2005/2006, 2010/2011 and 2015/2016 - Level: 2006/2011 |
| 10. Alternative internal migration (2001 to 2006) | Identical to the reference scenario | Identical to the reference scenario | Identical to the reference scenario | Identical to the reference scenario | Identical to the reference scenario | Identical to the reference scenario | Identical to the reference scenario | - Composition: average of the periods 2000/2001, 2005/2006, 2010/2011 and 2015/2016 - Level: 2001/2006 |
| 11. Alternative internal migration (1996 to 2001) | Identical to the reference scenario | Identical to the reference scenario | Identical to the reference scenario | Identical to the reference scenario | Identical to the reference scenario | Identical to the reference scenario | Identical to the reference scenario | - Composition : average of the periods 2000/2001, 2005/2006, 2010/2011 and 2015/2016 - Level: 1996/2001 |
|
Note: Distinct assumptions can be applied to Indigenous populations (see Table 5). Source: Statistics Canada, Centre for Demography. |
||||||||
Scenarios 1 to 5 primarily assess the influence of various immigration characteristics on the future ethnocultural diversity of the Canadian population. Scenario 1 is referred to as the reference scenario because it is the central scenario from which all others are developed. Thus, scenarios 2 to 5 combine the same assumptions, except for one, whose impact can be measured by comparing the results with the reference scenario: (2) low immigration, (3) high immigration, (4) alternative geographical distribution of immigrants upon arrival, and (5) alternative composition of immigration by place of birth.
The reference scenario combines the following assumptions:
- A medium immigration rate reaching 8.3 immigrants per 1,000 inhabitants at the end of the projection;
- A provincial or territorial distribution of new immigrants upon arrival corresponding to the values observed in 2021 at the beginning of the projection and gradually converging towards the average distribution estimated between 2007 and 2021, reaching it at the end of the projection;
- A distribution of new immigrants by place of birth corresponding to the values observed on average between 2017 and 2021 and gradually converging to the average distribution estimated for 2007 to 2021, reaching it at the end of the projection;
- A medium gross migraproduction rate of net emigration reaching 1.5 emigrants per 1,000 inhabitants at the end of the projection;
- A medium increase in the number of non-permanent residents to 1,556,000 at the end of the projection;
- A total fertility rate of 1.40 children per woman in 2020, which rises to 1.59 children per woman at the end of the projection;
- A constantly increasing life expectancy, reaching 84.8 years for men and 88.4 years for women in 2041;
- Internal migration patterns representative of the estimated average over the following five-year periods: 1996 to 2001, 2001 to 2006, 2006 to 2011 and 2011 to 2016.
In the low-immigration scenario (2), the immigration rate reaches 6.5 immigrants per 1,000 inhabitants in 2041, whereas in the high immigration scenario (3), the immigration rate is kept constant at 11.9 immigrants per 1,000 inhabitants. The scenario of an alternative geographic distribution of immigrants upon arrival (4) assumes a convergence toward the average distribution estimated over the period from 2017 to 2021. Finally, the scenario of an alternative composition of immigration by place of birth (5) assumes that the geographical origin of immigrants will be representative of the average distribution observed between 2017 and 2021 throughout the projection.
Scenarios 1 to 5 are primarily intended to produce plausible variations within components that directly affect immigration. The low-growth (6) and high-growth (7) scenarios are intended to illustrate the uncertainty of all components affecting population growth. They combine distinct assumptions about immigration, emigration, number of non-permanent residents, fertility and mortality to provide a maximum range of evolution in the size of the Canadian population.
The following assumptions distinguish the low-growth scenario from the reference scenario:
- A low immigration rate reaching 6.5 immigrants per 1,000 inhabitants at the end of the projection;
- A high gross migraproduction rate of net emigration reaching 1.7 emigrants per 1,000 inhabitants at the end of the projection;
- An increase in the number of non-permanent residents at the beginning of the projection followed by a slow decrease thereafter reaching 1,031,000 at the end of the projection;
- A total fertility rate of 1.40 children per woman in 2020, which decreases to 1.28 children per woman in 2027 and then increases to 1.40 children per woman at the end of the projection;
- A relatively slow rise in life expectancy, reaching 83.5 years for men and 87.4 years for women in 2041.
The following assumptions distinguish the high-growth scenario from the reference scenario:
- A high immigration rate maintained at 11.9 immigrants per 1,000 inhabitants;
- A low gross migraproduction rate of net emigration reaching 1.2 emigrants per 1,000 inhabitants at the end of the projection;
- A high increase in the number of non-permanent residents reaching 1,947,000 at the end of the projection;
- A total fertility rate of 1.40 children per woman in 2020, which rises to 1.79 children per woman at the end of the projection;
- A relatively rapid rise in life expectancy, reaching 85.8 years for men and 89.6 years for women in 2041.
Finally, scenarios 8 to 11 aim to highlight the high uncertainty associated with internal migration and to illustrate the sensitivity of the results for this component, especially with respect to the future geographic distribution of the population. Each of these scenarios proposes internal migration rates and migrant distribution patterns representative of a distinct five-year period: 2011 to 2016 (8), 2006 to 2011 (9), 2001 to 2006 (10), and 1996 to 2001 (11).
Cautionary note
Results from Demosim are subject to substantial uncertainty. There are generally three distinct sources of uncertainty susceptible to affect the results of any kind of demographic projections (United Nations Economic Commission for Europe 2018):
- 1. Uncertainty about the future has to do with how the projection assumptions will accurately reflect future demographic trends. The recent COVID-19 pandemic has exacerbated this type of uncertainty, especially in the short-term.Note Uncertainty about the future is most often dealt with by developing more than one scenario of projections, showing users that there is more than one possible future. These scenarios are built by modifying assumptions about future demographic levels and trends. This type of uncertainty tends to increase over time in a projection.
- 2. Structural uncertainty comes from limitations in our ability to model population dynamics. Those limitations can have several causes such as a lack of scientific knowledge, limitations of the mathematical models used, or shortcomings in the indicators used in the modeling process. This type of uncertainty is generally hard to measure and tends to be underestimated.
- 3. Uncertainty related to data is due to the imprecisions inherent to the data used for the computation of projection parameters or inaccuracies in the base population and the adjustments made to it. Variance of the data may be due, for example, to sampling or to imperfect collection tools. Because Demosim makes use of several distinct data sources, including surveys, this source of uncertainty is likely not negligible. However, while the variance of an estimate due to sampling can often be computed, its impact on projection results cannot easily be integrated in Demosim, especially if multiple sources are used. Uncertainty related to data is higher with small samples, and consequently, estimates for small population groups are usually more uncertain in Demosim.
In addition to these three sources of uncertainty, there is a fourth one that is specific to microsimulation: Monte-Carlo variance:
- 4. Monte Carlo variance stems from the use of a random sampling algorithm to draw values (waiting times) for each individual in regard to the potential events that the individual can experiment (Van Imhoff and Post 1998). The impact of this variance on the results, although relatively small compared with other sources of uncertainty present in the model, tends to increase as the projection moves through time and is more significant among highly modelled populations (for example, children born during the simulation).
Because of all these types of uncertainty and to avoid giving a false impression of accuracy, all projection results presented publicly are rounded to the nearest thousand.
Moreover, the choice of assumptions and scenarios is not intended to predict the future, but rather to provide data users with a portrait of the Canadian population if certain conditions were met. Since it is impossible to know the future, several scenarios were developed to capture a broad range of plausible possibilities in light of past data and trends, among others things. For this reason, users of these projections are encouraged to consider the full range of results provided by the various scenarios, rather than to look for a single scenario that appears more likely.
Projection users who want to know more about the Demosim model or obtain customized data can contact Statistics Canada’s Centre for Demography at the following email address: statcan.demography-demographie.statcan@statcan.gc.ca.
Appendix A – Methodological supplements
The main methodological aspects relating to these projections are explained in the following report: Projections of the Indigenous populations and households in Canada, 2016 to 2041: Overview of data sources, methods, assumptions and scenarios (Statistics Canada 2021). However, since the release of this report, the modelling of the emigration component has been updated. A description of the new methodology used to project this component is briefly presented in this appendix. In addition, methodological aspects relating to the acquisition of Canadian citizenship component, not presented in the above report, are also described here.
Emigration
The purpose of the emigration module is to project the net result of three components related to emigration per se: emigration, returning emigration, and temporary emigration (measured as a net number, i.e., the difference between temporary emigrants and temporary emigrants returning to the country). The modelling used to project this component is done in two stages:
- Base rates broken down by year of age and year of projection at the national level, corresponding to the net number of emigrants divided by the population at risk (excluding non-permanent residents), as estimated by the DEP. Based on historical data from the DEP, various assumptions about future trends in age-specific base rates were made to create low, medium and high (net) emigration assumptions.
- Relative risks obtained using a proportional hazard regression (Cox models) applied to the data of the Longitudinal Administrative Databank linked to the Longitudinal Immigration Database from 1995 to 2016.Note Combined with the base rates, relative risks enable disaggregating the adult population’s propensity to emigrate by country/region of birth, time elapsed since immigration,Note region of residence and sex.
Acquisition of Canadian citizenship
In the Demosim model, it is considered that all children born during the simulation obtain Canadian citizenship at the time of birth. The Canadian citizenship acquisition module therefore refers only to the process through which immigrants become naturalized citizens after arriving in the country. This event was modelled by applying a logistic regression model to the 2016 Census data (adjusted) to estimate the likelihood of having acquired Canadian citizenship on the basis of the number of years elapsed since immigration, place of birth, immigrant admission category, racialized group and age at immigration. Because of the rules for acquiring citizenship through naturalization, individuals who obtain immigrant status during the simulation cannot become citizens within the first five years of obtaining this status. In addition, citizenship acquisition rates are considered null after 15 years of residence in Canada, reflecting what is observed in census data (the proportion of immigrants with Canadian citizenship no longer rises 15 years after immigration status was obtained).
Bibliography
ABURTO, José Manuel, Jonas SCHÖLEY, Ilya KASHNITSKY, Luyin ZHANG, Charles RAHAL, Trifon I. MISSOV, Melinda C. MILLS, Jennifer B. DOWD and Ridhi KASHYAP. 2022. “Quantifying impacts of the COVID-19 pandemic through life-expectancy losses: a population-level study of 29 countries”. International Journal of Epidemiology. Volume 51, number 1.
ALDEROTTI, Giammarco, Daniele VIGNOLI, Michela BACCINI and Anna MATYSIAK. 2019. “Employment Uncertainty and Fertility: A Network Meta-Analysis of European Research Findings”. Econometrics Working Papers Archive 2019_06. Universita’ degli Studi di Firenze, Dipartimento di Statistica, Informatica, Applicazioni “G. Parenti”.
AYDEMIR, Abdurrahman and Chris ROBINSON. 2006. Return and Onward Migration Among Working Age Men. Statistics Canada catalogue number 11F0019.
BC STAT. 2022. Births by Community Health Service Area. [accessed March 23, 2022].
BÉLANGER, Alain and Stéphane GILBERT. 2003. “The Fertility of Immigrant Women and their Canadian-Born Daughters”. Report on the Demographic Situation in Canada, 2002. Statistics Canada catalogue number 91-209.
BÉRARD-CHAGNON, Julien. 2018. “Measuring Emigration in Canada: Review of Available Data Sources and Methods”. Demographic Documents. Statistics Canada catalogue number 91F0015M-14.
BÉRARD-CHAGNON, Julien and Marie-Noëlle PARENT. 2021. “Coverage of the 2016 Census: Level and trends”. Demographic Documents. Statistics Canada catalogue number 91F0015M.
BÉRARD-CHAGNON, Julien, Stacey HALLMAN and Geneviève CARON. 2019. “Recent immigrants and non-permanent residents missed in the 2011 Census”. Ethnicity, Language and Immigration Thematic Series. Statistics Canada catalogue number 89-657-X2019.
BOHNERT, Nora and Patrice DION. 2015. “Chapter 5: Projection of international immigration”, in BOHNERT, Nora, Jonathan CHAGNON, Simon COULOMBE, Patrice DION and Laurent MARTEL (editors). Population Projections for Canada (2013 to 2063), Provinces and Territories (2013 to 2038): Technical Report on Methodology and Assumptions. Statistics Canada catalogue number 91-620.
BOUCHER, Alexandre, Norbert ROBITAILLE and Eric GUIMOND. 2009. “La mobilité ethnique intergénérationnelle des enfants de moins de 5 ans chez les populations autochtones, Canada, 1996 et 2001”. Cahiers québécois de démographie. Volume 38, number 2.
BUSHNIK, Tracey, Michael TJEPKEMA and Laurent MARTEL. 2020. “Socioeconomic disparities in life and health expectancy among the household population in Canada”. Health Reports. Statistics Canada catalogue number 82-003.
CALLAWAY, Ewen. 2021. “Beyond Omicron: what’s next for COVID’s viral evolution”. Nature 600, 204-207.
CARON-MALENFANT, Éric and Alain BÉLANGER. 2006. “The Fertility of Visible Minority Women in Canada”. Report on the Demographic Situation in Canada, 2003 and 2004. Statistics Canada catalogue number 91-209.
CARON-MALENFANT, Éric, Patrice DION, André LEBEL and Dominic GRENIER. 2011. “Immigration et structure par âge de la population canadienne : quelles relations?”. Cahiers québécois de démographie. Volume 40, number 2.
CHASTKO, Karl. 2021. “Internal migration: Overview, 2016/2017 to 2018/2019”. Report on the Demographic Situation in Canada. Statistics Canada catalogue number 91-209.
DION, Patrice and Elham SIRAG. 2019. “Chapter 1: General Approach to Assumption Building“. In CHAGNON, Jonathan, Patrice DION, Nora GALBRAITH, Elham SIRAG and Yu ZHANG (editors). Population Projections for Canada (2018 to 2068), Provinces and Territories (2018 to 2043): Technical Report on Methodology and Assumptions. Statistics Canada catalogue number 91-620.
DION, Patrice and Simon COULOMBE. 2008. “Portrait of the mobility of Canadians in 2006: Trajectories and characteristics of Migrants”. Report on the Demographic Situation in Canada, 2005 and 2006. Statistics Canada catalogue number 91-209.
DION, Patrice, Nora GALBRAITH and Elham SIRAG. 2019. “Chapter 2: 2018 Survey of Experts on Future Demographic Trends”. In CHAGNON, Jonathan, Patrice DION, Nora GALBRAITH, Elham SIRAG and Yu ZHANG (editors). Population Projections for Canada (2018 to 2068), Provinces and Territories (2018 to 2043): Technical Report on Methodology and Assumptions. Statistics Canada Catalogue number 91-620.
EMPLOYMENT AND SOCIAL DEVELOPMENT CANADA. 2022. Government of Canada announces Workforce Solutions Road Map – further changes to the Temporary Foreign Worker Program to address labour shortages across Canada. News release: April 4. [accessed June 1, 2022].
FOSTIK, Ana and Nora GALBRAITH. 2021. “Changes in fertility intentions in response to COVID-19 pandemic”. Statcan COVID-19: Data to Insights for a better Canada. Statistics Canada catalogue number 45-28-0001.
GALBRAITH, Nora. 2019. “Chapter 5: Projection of Immigration”. In CHAGNON, Jonathan, Patrice DION, Nora GALBRAITH, Elham SIRAG and Yu ZHANG (editors). Population Projections for Canada (2018 to 2068), Provinces and Territories (2018 to 2043): Technical Report on Methodology and Assumptions. Statistics Canada catalogue number 91-620.
GALBRAITH, Nora, Patrice DION and Elham SIRAG. 2019. “Chapter 3: Projection of Fertility”. In CHAGNON, Jonathan, Patrice DION, Nora GALBRAITH, Elham SIRAG and Yu ZHANG (editors). Population Projections for Canada (2018 to 2068), Provinces and Territories (2018 to 2043): Technical Report on Methodology and Assumptions. Statistics Canada catalogue number 91-620.
GOVERNMENT OF ONTARIO. 2022. Ontario Demographic Quarterly: Highlights of first quarter. (accessed March 23, 2022).
GRIFFITH, Andrew. 2022. “How the government used the pandemic to sharply increase immigration”, Institute for Research on Public Policy: April 25. [accessed June 24, 2022].
GUIMOND, Eric, Norbert ROBITAILLE and Sacha SENÉCAL. 2007. “Définitions floues et explosion démographique chez les populations autochtones du Canada de 1986 à 2001”. Paper presented at the Statistiques sociales et diversité ethniqueconference, organized jointly by the Quebec Inter-university Centre for Social Statistics (QICSS) and the Institut national d’études démographiques (INED).
IMMIGRATION, REFUGEES AND CITIZENSHIP CANADA. 2022-1. 2021 Annual Report to Parliament on Immigration shortage.
IMMIGRATION, REFUGEES AND CITIZENSHIP CANADA. 2022-2. Canada – Study permit holders with a valid permit on December 31st by Province/Territory of intended destination and study level, 2000 - 2021. Open Government dataset. [accessed June 2, 2022].
IMMIGRATION, REFUGEES AND CITIZENSHIP CANADA. 2022-3. Canada – International Mobility Program work permit holders by gender, occupational skill level and year in which permit(s) became effective, January 2015 – March 2022. Open Government dataset. [accessed June 2, 2022].
IMMIGRATION, REFUGEES AND CITIZENSHIP CANADA. 2022-4. Canada – Temporary Foreign Worker Program work permit holders by gender, occupational skill level and year in which permit(s) became effective, January 2015 – March 2022. Open Government dataset. [accessed June 2, 2022].
IMMIGRATION, REFUGEES AND CITIZENSHIP CANADA. 2022-5. New measures to address Canada’s labour shortage. News release: April 22. [accessed June 24, 2022].
IMMIGRATION, REFUGEES AND CITIZENSHIP CANADA. 2022-6. Canada launches new temporary residence pathway to welcome those fleeing the war in Ukraine. News release: March 17.
INSTITUT DE LA STATISTIQUE DU QUÉBEC. 2022. Births, deaths and marriages by month and quarter, 2010-2022. (accessed March 23, 2022).
INSTITUT NATIONAL DE LA STATISTIQUE ET DES ÉTUDES ÉCONOMIQUES. 2022. Les naissances par mois en 2021 et 2022.(accessed March 23, 2022).
LU, Chaohui and Edward NG. 2019. “Healthy immigrant effect by immigrant category in Canada”. Health Reports. Statistics Canada catalogue number 82-003.
MINISTÈRE DE L’IMMIGRATION, DE LA FRANCISATION ET DE L’INTÉGRATION DU QUÉBEC. 2021. Plan d’immigration du Québec 2022.
MORENCY, Jean-Dominique and Éric CARON-MALENFANT. 2014. “Variations de la fécondité selon diverses caractéristiques au recensement”. Presented at the seminar of the Association des démographes du Québec, Congrès de l’ACFAS 2014 (Montréal).
NAGNUR, Dhruva N. 1986. Longevity and historical life tables: 1921-1981 (abridged): Canada and the provinces. Statistics Canada catalogue number CS89-506/1986-PDF.
OMARIBA, D. Walter Rasugu, Edward NG and Bilkis VISSANDJÉE. 2014. “Differences between immigrants at various durations of residence and host population in all-cause mortality, Canada, 1991-2006”. Population Studies, A Journal of Demography.
PUBLIC HEALTH AGENCY OF CANADA. 2022. COVID-19 epidemiology update. (accessed February 28, 2022).
SHUMANTY, Rufteen. 2018. “Mortality: Overview, 2014 to 2016”. Report on the Demographic Situation in Canada. Statistics Canada catalogue number 91-209.
SIRAG, Elham and Patrice DION. 2019. “Chapter 6: Projection of Emigration”. In CHAGNON, Jonathan, Patrice DION, Nora GALBRAITH, Elham SIRAG and Yu ZHANG (editors). Population Projections for Canada (2018 to 2068), Provinces and Territories (2018 to 2043): Technical Report on Methodology and Assumptions. Statistics Canada catalogue number 91-620.
SMITH, Stanley K. 1986. “Accounting for migration in cohort-component projections of state and local populations”. Demography. Volume 23, number 1.
SOBOTKA, Tomas, Vegard SKIRBEKK and Dimiter PHILIPOV. 2011. “Economic recession and fertility in the developed world”. Population and Development Review. Volume 37, number 2.
STATISTICS CANADA. 2016. Population and Family Estimation Methods at Statistics Canada. Statistics Canada catalogue number 91-528.
STATISTICS CANADA. 2017. Immigration and Diversity: Population Projections for Canada and Its Regions, 2011 to 2036. Statistics Canada catalogue number 91-551.
STATISTICS CANADA. 2018. Dictionary, Census of Population, 2016. Statistics Canada catalogue number 98-301-X2016001.
STATISTICS CANADA. 2019-1. Population Projections for Canada (2018 to 2068), Provinces and Territories (2018 to 2043). Statistics Canada catalogue number 91-520.
STATISTICS CANADA. 2019-2. Population Projections for Canada (2018 to 2068), Provinces and Territories (2018 to 2043): Technical Report on Methodology and Assumptions. Statistics Canada catalogue number 91-620.
STATISTICS CANADA. 2021. “Projections of the Indigenous populations and households in Canada, 2016 to 2041: Overview of data sources, methods, assumptions and scenarios”. Demosim: Reports and Analytical Studies. Statistics Canada catalogue number 17-20-0001.
STATISTICS CANADA. 2022-1. “Canada in 2041: A larger, more diverse population, with greater differences between regions”. The Daily. September 8.
STATISTICS CANADA. 2022-2. Table 17-10-1046-01. Projected population by racialized group, generation status and other selected characteristics.
STATISTICS CANADA. 2022-3. “Population projections on immigration and diversity: Interactive dashboard”. Statistics Canada catalogue number 71-607-x2022012.
STATISTICS CANADA. 2022-4. “Provisional death counts and excess mortality, January 2020 to October 2021”. The Daily. January 10.
STATISTICS CANADA. 2022-5. Table 13-10-0392-01. Deaths and age-specific mortality rates, by selected grouped causes.
TJEPKEMA, Michael, Russel WILLKINS and Andrea LONG. 2012. “Cause-specific mortality by education in Canada: A 16-year follow-up study”. Health Reports. Statistics Canada catalogue number 82-003, volume 23, number 3.
TROVATO, Frank and David ODYNAK, 2011. “Sex differences in life expectancy in Canada: immigrant and native born population”. Journal of Biosocial Science. Volume 43.
UNITED NATIONS ECONOMIC COMMISSION FOR EUROPE. 2018. Recommendations on Communicating Population Projections, prepared by the Task Force on Population Projections. United Nations, New York and Geneva.
VANG, Zoua, Jennifer SIGOUIN, Astrid FLENON and Alain GAGNON. 2015. “The Healthy Immigrant Effect in Canada: A Systematic Review”. Population Change and Lifecourse Strategic knowledge Cluster Discussion Paper Series/Un réseau stratégique de connaissances, changements de population et parcours de vie Document de travail. Volume 3, number 1, article 4.
VAN IMHOFF, Evert and Wendy POST. 1998. “Microsimulation Methods for population projection”. Population: An English Selection. Volume 10, number 3.
ZHANG, Yu, Nora GALBRAITH and Patrice DION. 2019. “Chapter 4: Projection of Mortality”. In CHAGNON, Jonathan, Patrice DION, Nora GALBRAITH, Elham SIRAG and Yu ZHANG (editors). Population Projections for Canada (2018 to 2068), Provinces and Territories (2018 to 2043): Technical Report on Methodology and Assumptions. Statistics Canada catalogue number 91-620.
GlossaryNote
Base population
Population used as the starting point for population projections.
Canadian citizenship
A person’s legal status as a Canadian citizen, whether by birth or by naturalization.
Census metropolitan area (CMA)
Area consisting of one or more adjacent municipalities centered on a population core. It has a population of at least 100,000, of which 50,000 or more live in the core
Cohort-component method
Method used for population estimates or projections that is based on the components of demographic change and a base population as input. The phrase “cohort-component method” is usually restricted to methods projecting the future evolution of cohorts by age and sex, as opposed to other methods, such as microsimulation, that also use components of population growth but that project the demographic destiny of individuals.
Components of population growth
Any class of event that generates population changes. For example, births, deaths and migration are components that modify either the size of the total population or its composition by age and sex.
Ethnic mobility
Refers to “the phenomenon of individuals and families changing the ethnic affiliation that they report” (Guimond et al. 2007). Ethnic mobility has two components: intragenerational (over one individual’s lifetime), which is modeled in Demosim only for the Indigenous groups, and intergenerational (from parents to their children) (Boucher et al. 2009).
Fertility
A demographic phenomenon related to live births that can be considered from the point of view of women, the couple and, very occasionally, men.
Generation status
The respondent’s generation rank since the settlement of his/her family (meaning direct ascendants) in Canada. In the Demosim model, immigrants are the first generation; the second generation refers to non-immigrants (born in Canada or abroad) to at least one foreign-born parent; the generations that follow (third or more) comprise non-immigrants (born in Canada or abroad) to two Canadian-born parents. A more detailed version of this variable split the first and second generations into two distinct groups: generations 1 and 1.5; and generations 2 and 2.5. According to this version of the variable, generation 1 refers to immigrants admitted at age 15 or more, while generation 1.5 refers to immigrants admitted at age 14 or less. Generation 2 refers to non-immigrants born (in Canada or abroad) to two foreign-born parents, while generation 2.5 refers to non-immigrants born (in Canada or abroad) to one foreign-born parent and one parent born in Canada. This definition of generation status differs slightly from the one used in the census, which is based only on the place of birth (without regard to immigrant status).
Gross migraproduction rate
The gross migraproduction rate is defined as the sum of age-specific (from ages 0 to 110 and over) migration rates. In these projections, it is used only for net emigration (sum of age-specific emigration rates). It can be interpreted as the number of emigrations an individual could expect to make over the course of his or her lifespan, were the current age-specific rates to apply, and assuming he or she survives to the oldest age group.
Immigrant
Person who has been granted the right to live in Canada permanently by immigration authorities.
Immigrant category of admission
The administrative category under which a person is admitted to Canada as a permanent resident under the Immigration and Refugee Protection Act. The categories are economic immigrants, immigrants admitted as members of a family, immigrants admitted as protected people (refugees) and other immigrants.
Immigration
The total number of immigrants who come to reside in Canada from another country and the number of people who acquire immigration status among those already residing in Canada with temporary status.
Indigenous identity
Refers to people identifying with the Indigenous peoples in Canada. This includes those who reported being First Nations (North American Indian), Métis or Inuk (Inuit) and/or those who reported being Registered or Treaty Indians (that is, registered under the Indian Act of Canada), and/or those who reported having membership in a First Nation or Indian band on the 2016 Census.
Indigenous people
See “Indigenous identity.”
Internal migration
The sum of all movements between the geographical units within Canada’s geographical boundaries, involving a change in usual place of residence.
International migration
The sum of all movements between Canada and other countries, involving a change in the usual place of residence.
Life expectancy
A statistical measure derived from the life table indicating the average number of years of life remaining for a population at a specific age “x”, calculated on the basis of the mortality rates observed in a given year.
Microsimulation
Unlike population estimates and projections produced using the cohort-component method, microsimulation simulates the demographic destiny of each individual. The method is based on repeated random draws at the individual level rather than on aggregated data applied at the group level.
Net emigration
The number of emigrants minus the number of returning emigrants plus net temporary emigration.
Net undercoverage
Difference between the number of people who were targeted by the census but who were not enumerated (undercoverage), and the number of people who were enumerated when they should not have been, or who were enumerated more than once (overcoverage).
Non-permanent resident
People who have a work or study permit or who are refugee claimants, and the family members living in Canada with them.
Population projection
The set of results describing the size and structure of a future population, derived from a calculation that modifies a base population according to a set of assumptions about demographic and non-demographic components.
Projection scenario
A set of assumptions about the components, demographic or otherwise, used to make a population projection.
Racialized groups
The “racialized” population is measured with the “visible minority” variable. It includes the persons belonging to one of the visible minority groups defined by the Employment Equity Act. The Employment Equity Act defines visible minorities as “persons, other than Aboriginal peoples, who are non-Caucasian in race or non-white in colour.” The visible minority population consists mainly of the following groups: South Asian, Chinese, Black, Filipino, Latin American, Arab, Southeast Asian, West Asian, Korean and Japanese.
Reserve
In the context of the 2016 Census, “residence on or off reserve” refers to whether the person’s usual place of residence is in a census subdivision (CSD) that is defined as “on reserve” or “off reserve.” “On reserve” includes six census subdivision (CSD) types legally affiliated with First Nations or Indian bands, i.e., Indian reserve (IRI), Indian settlement (S-É) (except for the four Indian settlements of Champagne Landing 10, Klukshu, Two Mile and Two and One-Half Mile Village, and Kloo Lake located in Yukon), Indian government district (IGD), terres réservées aux Cris (TC), terres réservées aux Naskapis (TK) and Nisga’a land (NL). “Off reserve” includes all CSDs in Canada not defined as “on reserve.”
Total fertility rate
The sum of age-specific fertility rates in a given year. It indicates the average number of children that a generation of women would have if, throughout their reproductive lives, they experienced the age-specific fertility rates observed during that year.
Visible minority groups
The Employment Equity Act defines members of visible minorities as “persons, other than Aboriginal peoples, who are non-Caucasian in race or non-white in colour.” In this report, the term “racialized groups” is used to refer to the “visible minority groups”.
- Date modified: