Infographic 3
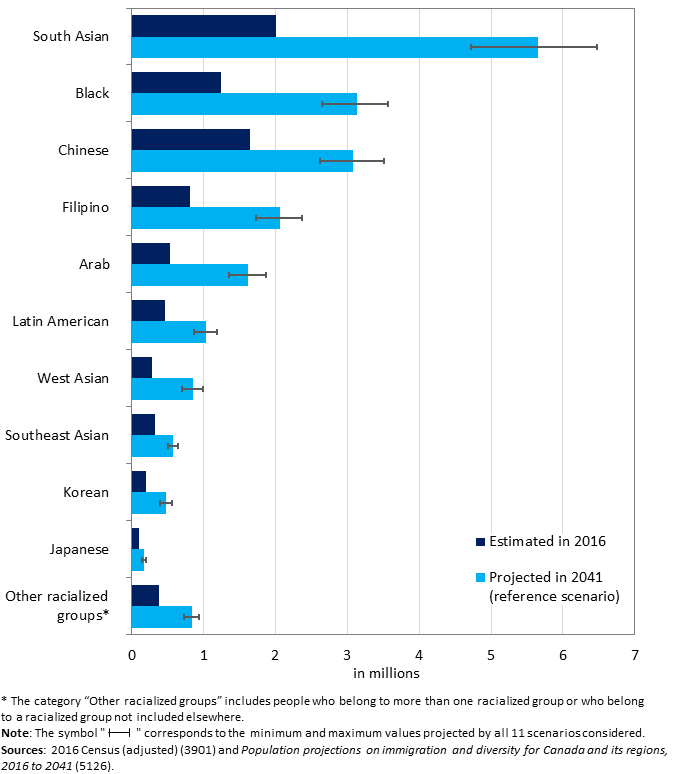
Population by racialized group, 2016 (estimated) and 2041 (projected under the reference scenario), Canada

Infographic description
The title of the infographic is "Population by racialized group, 2016 (estimated) and 2041 (projected under the reference scenario), Canada"
This is a horizontal bar chart.
The horizontal axis shows the racialized population (in million) from 0 to 7 million, by increments of 1 million.
The vertical axis shows 11 racialized groups (South Asian, Black, Chinese, Filipino, Arab, Latin American, West Asian, Southeast Asian, Korean, Japanese and Other racialized groups).
There are two series of bars. The first series of horizontal bars (in dark blue) represents the population estimated in 2016 for each racialized group.
The second series of horizontal bars (in pale blue) represents the population projected for 2041 under the reference scenario for each racialized group. Error bars appear on the second series of horizontal bars. These error bars correspond to the interval between the minimum and maximum values projected by all 11 scenarios developed in the
The first set of bars presents the population of the South Asian racialized group, estimated at 2.0 million in 2016 and projected at 5.7 million for 2041. The minimum and maximum values projected for 2041 are, respectively, 4.7 million and 6.5 million.
The second set of bars presents the population of the Black racialized group, estimated at 1.2 million in 2016 and projected at 3.1 million for 2041. The minimum and maximum values projected for 2041 are, respectively, 2.7 million and 3.6 million.
The third set of bars presents the population of the Chinese racialized group, estimated at 1.7 million in 2016 and projected at 3.1 million for 2041. The minimum and maximum values projected for 2041 are, respectively, 2.6 million and 3.5 million.
The fourth set of bars presents the population of the Filipino racialized group, estimated at 0.8 million in 2016 and projected at 2.1 million for 2041. The minimum and maximum values projected for 2041 are, respectively, 1.7 million and 2.4 million.
The fifth set of bars presents the population of the Arab racialized group, estimated at 0.5 million in 2016 and projected at 1.6 million for 2041. The minimum and maximum values projected for 2041 are, respectively, 1.4 million and 1.9 million.
The sixth set of bars presents the population of the Latin American racialized group, estimated at 0.5 million in 2016 and projected at 1.0 million for 2041. The minimum and maximum values projected for 2041 are, respectively, 0.9 million and 1.2 million.
The seventh set of bars presents the population of the West Asian racialized group, estimated at 0.3 million in 2016 and projected at 0.9 million for 2041. The minimum and maximum values projected for 2041 are, respectively, 0.7 million and 1.0 million.
The eighth set of bars presents the population of the Southeast Asian racialized group, estimated at 0.3 million in 2016 and projected at 0.6 million for 2041. The minimum and maximum values projected for 2041 are, respectively, 0.5 million and 0.6 million.
The ninth set of bars presents the population of the Korean racialized group, estimated at 0.2 million in 2016 and projected at 0.5 million for 2041. The minimum and maximum values projected for 2041 are, respectively, 0.4 million and 0.6 million.
The tenth set of bars presents the population of the Japanese racialized group, estimated at 0.1 million in 2016 and projected at 0.2 million for 2041. The minimum and maximum values projected for 2041 are, respectively, 0.1 million and 0.2 million.
The eleventh set of bars presents the population of the category "Other racialized groups", estimated at 0.4 million in 2016 and projected at 0.8 million for 2041. The minimum and maximum values projected for 2041 are, respectively, 0.7 million and 0.9 million.
Notes: The category "Other racialized groups" includes people who belong to more than one racialized group or who belong to a racialized group not included elsewhere. The error bars correspond to the minimum and maximum values projected by all 11 scenarios considered.
Sources: 2016 Census (adjusted) (3901) and
- Date modified: