
Education, learning and training: Research Paper Series
Early career quality of employment of Indigenous graduates with a bachelor’s degree, 2010 to 2018 cohorts
Skip to text
Text begins
Overview of the study
When Indigenous people earn a bachelor’s degree, their labour market participation rates are comparable to that of non-Indigenous people’s. But are they securing employment opportunities of equal quality to those obtained by their non-Indigenous counterparts after graduation? Using data from the Education and Labour Market Longitudinal Platform (ELMLP), this article compares select indicators on quality of employment two years after graduation (employment income, unionization rate and pension plan coverage rate) of First Nations and Métis graduatesNote with a bachelor’s degree with those of non-Indigenous graduates who are non-racialized and non-immigrant.
- Indigenous graduates represented 3% of graduates with a bachelor’s degree from 2010 to 2018. First Nations graduates represented 48% of Indigenous graduates, Métis represented 47% and Inuit represented 2%.
- Indigenous bachelor’s degree holders were more likely to be women than non-Indigenous graduates. They were older at graduation and more often had dependent children two years after graduation.
- Indigenous graduates earned their bachelor’s degrees in fields similar to non-Indigenous graduates. Still, they were slightly more likely to have earned it in the field of education and slightly less likely to have earned it in the field of science.
- Two years after graduation, Métis graduates with a bachelor’s degree had incomes similar to non-Indigenous graduates with a bachelor’s degree. Meanwhile, First Nations graduates with a bachelor’s degree had slightly lower incomes than their non-Indigenous counterparts. Once the differences in demographic, education and industry characteristics were taken into account, First Nations female graduates earned 4% less than non-Indigenous female graduates, and First Nations male graduates earned 7% less than non-Indigenous male graduates.
- When differences in demographic, education and industry characteristics were considered, Métis graduates had higher unionization rates than non-Indigenous graduates. Meanwhile, First Nations graduates were less likely to be unionized than their non-Indigenous counterparts. Additionally, Métis graduates had pension plan coverage rates similar to those of non-Indigenous graduates, while First Nations graduates were less likely to be covered by a pension plan.
Introduction
First Nations people, Métis and Inuit face significant gaps in high school and postsecondary completion rates compared to the non-Indigenous population.Note From 2016 to 2021, the gaps in the high school graduation rate between the Indigenous and non-Indigenous populations narrowed, while gaps in the postsecondary graduation rate widened. In 2021, 10% of Indigenous peopleNote aged 15 years and older had a bachelor’s degree or higher, compared with 27% of non-Indigenous people.Note Indigenous people face barriers to continuing their education at the postsecondary level, such as having to relocate, lack of guidance and culturally appropriate curricula, inadequate funding, difficulty in finding housing, and the impacts of residential schools and intergenerational trauma.Note In addition, many Indigenous people live in rural and remote areas: “limited access to employment in many sectors in remote communities can have a significant impact on the labour force participation and income of people living in these communities.”Note
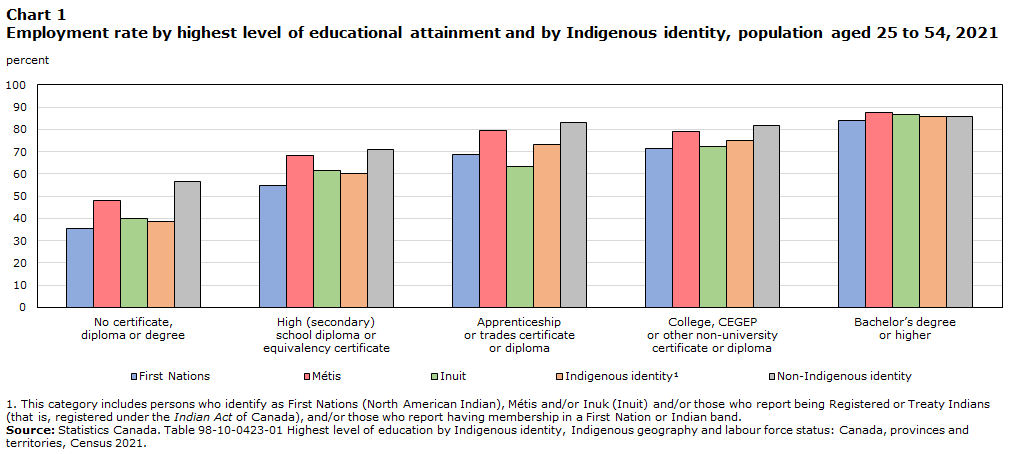
In general, educational attainment is closely linked to labour market outcomes. According to 2021 Census data,Note the employment rate for Indigenous people aged 25 to 54 ranged from 60% for those with a high school diploma (or equivalency certificate) to 86% for those with a bachelor’s degree or higher (Chart 1). A similar trend was observed for the non-Indigenous population. Gaps in the employment rate between Indigenous and non-Indigenous people narrowed as educational attainment increased for both groups. When members of Indigenous populations earned a bachelor’s degree, their employment rates were comparable to those of non-Indigenous people holding a bachelor’s degree.
Data table for Chart 1
| First Nations | Métis | Inuit | Indigenous identityData table for chart 1 Note 1 | Non-Indigenous identity | |
|---|---|---|---|---|---|
| percent | |||||
| No certificate, diploma or degree | 35.5 | 48.0 | 40.1 | 38.6 | 56.8 |
| High (secondary) school diploma or equivalency certificate | 54.9 | 68.3 | 61.6 | 60.1 | 71.1 |
| Apprenticeship or trades certificate or diploma | 68.9 | 79.3 | 63.5 | 73.0 | 83.0 |
| College, CEGEP or other non-university certificate or diploma | 71.4 | 79.2 | 72.3 | 74.8 | 81.9 |
| Bachelor’s degree or higher | 83.9 | 87.8 | 86.5 | 85.8 | 85.6 |
|
|||||
This article examines the early career quality of employment of First Nations (on- and off-reserve), and Métis graduates with a bachelor’s degree, two years after graduation. Specifically, are the labour market outcomes of recent Indigenous graduates with a bachelor’s degree comparable to those of recent bachelor’s graduates who are non-Indigenous, non-racialized, and non-immigrant? Are Indigenous graduates securing employment opportunities of equal quality to those obtained by their non-Indigenous counterparts after graduation?
These questions are important to study, as employment and working conditions are determinants of health and well-being (both physical and mental).Note They are also particularly relevant in the context of the Truth and Reconciliation Commission, which emphasizes the importance of education (and its impact on employment) in the Reconciliation process. The Commission calls for action from federal, provincial and territorial governments to work with First Nations people, Métis and Inuit to address the ongoing legacies of colonialism that have had harmful impacts on many facets of Indigenous peoples’ lives, including education and economic opportunity.Note
Additionally, Indigenous Peoples are one of the four designated groups covered by the Employment Equity Act, which aims to achieve equality in the workplace so that no person is denied employment opportunities or benefits for reasons unrelated to ability. In fulfilling this goal, the Act would correct the disadvantages certain groups experience in employment.Note As stated by the National Collaborating Centre for Indigenous Health,
“[w]hile many Indigenous people have made gains in employment outcomes in recent decades, ongoing inequities indicate that barriers to employment continue to exist. These barriers are complex and interrelated, and relate to family structure and composition, impacts of historic and contemporary manifestations of colonization, geography, and government policies. Any of these barriers, alone or in combination, can make it difficult for Indigenous peoples to find and retain jobs.”Note
Moreover, labour market disruptions related to the COVID-19 pandemic have supported the link between educational attainment and job security, as people with a bachelor’s degree or higher were less affected by unemployment during this period.Note In addition, First Nations people, Métis and Inuit are among the youngest populations in Canada, and their population continues to grow faster than the non-Indigenous population.Note Their educational pathways and labour force participation will become increasingly important to the Canadian economy, in current context of labour shortages, as the general population ages and as many workers are approaching or have already reached retirement age.Note
Using the Education and Labour Market Longitudinal Platform, a database that integrates anonymized data from the Postsecondary Student Information System (PSIS) with data from the 2016 Census, the 2021 Census, and tax data from the T1 Family File (T1FF), this article compares, for the first time, selected labour market indicators of First Nations and Métis graduates with a bachelor’s degree at the start of their careers, two years after graduation, with those of graduates who are non-Indigenous, non-racialized, and non-immigrant.Note To do so, nine cohorts of graduates with a bachelor’s degree, from 2010 to 2018, were combined.Note
The article begins with a profile of graduates. Next, it compares select quality of employment measures: employment income, the proportion with union dues, and the proportion with employer pension plan contributions. The results of this study pertain to graduates who received a bachelor’s degree from a public postsecondary institution in Canada and were employed two years after graduation. The article presents information to better understand issues associated with the labour market integration of Indigenous postsecondary graduates. It also demonstrates the analytical potential of the Education and Labour Market Longitudinal PlatformNote .
Indigenous people were underrepresented among graduates with a bachelor’s degree from 2010 to 2018
Among all graduatesNote with a bachelor’s degree from 2010 to 2018, 42,070 were IndigenousNote and 1,582,490 were non-Indigenous. Indigenous graduates accounted for 3% of all graduates, which is lower than the proportion of Indigenous people in the Canadian population aged 25 to 34 in 2021 (5%) (Table 1).
The distribution of First Nations, Métis and Inuit Indigenous identity groups in the 2010 to 2018 graduate cohorts differed from the proportion of these identity groups in the total Indigenous population aged 25 to 34 in 2021 (Table 1). Indigenous graduates from 2010 to 2018 were more likely to be Métis compared to the Indigenous population aged 25 to 34 in 2021 (47% vs. 34%), and less likely to be First Nations (48% vs. 59%) or Inuit (2% vs. 4%).
| Graduates with a bachelor's degree from 2010 to 2018 | Canadian population aged 25 to 34 (ref.) | |
|---|---|---|
| number | ||
| Total | 1,624,560 | 4,898,625 |
| percentage | ||
| Non-Indigenous identity | 97.4Note * | 94.6 |
| Indigenous identityTable 1 Note 1 | 2.6Note * | 5.4 |
| number | ||
| Indigenous identityTable 1 Note 1 | 42,070 | 263,655 |
| percentage | ||
| First Nations | 47.6Note * | 58.8 |
| Métis | 47.3Note * | 33.8 |
| Inuit | 1.5Note * | 4.1 |
| OtherTable 1 Note 2 | 3.5 | 3.3 |
Sources: Statistics Canada, integrated Postsecondary Student Information System, T1 Family File and 2016 and 2021 Census files, 2010 to 2018 cohorts, and Statistics Canada, Table 98-10-0291-01. |
||
Profile of graduates
From this section onward, the analysis looks only at bachelor’s degree graduates, aged 15 and older at graduation, who were employed two years after graduation,Note who had not returned to school full-time, and who had filed an income tax return for the two years after earning their bachelor’s degree. Racialized and immigrant graduatesNote are not included in the analysis universe. For conciseness, the non-Indigenous population will refer to the non-Indigenous, non-racialized, and Canadian-born (or non-immigrant) population. Among the bachelor’s degree holders in the analysis universe, there were 23,750 Indigenous graduates and 524,020 non-Indigenous graduates (Table 2).
| First Nations | Métis | Inuit | Indigenous identityTable 2 Note 1 | Non Indigenous, non racialized and non immigrant (ref.) | |
|---|---|---|---|---|---|
| number | |||||
| Total | 11,320 | 11,190 | 420 | 23,750 | 524,020 |
| year | |||||
| Average age at graduation | 29.9Note ** | 27.0Note ** | 30.3Note ** | 28.4Note ** | 25.9 |
| Women | 30.4Note ** | 27.2Note ** | 31.0Note ** | 28.9Note ** | 26.0 |
| Men | 28.1Note ** | 26.5Note ** | 27.6Note ** | 27.2Note ** | 25.6 |
| percentage | |||||
| Proportion of women | 75.7Note ** | 68.3Note ** | 81.0Note ** | 72.1Note ** | 61.8 |
| Distribution by region of residence two years after graduation | |||||
| Atlantic | 13.8Note ** | 7.4 | 38.1Note ** | 11.1Note ** | 8.1 |
| Quebec | 9.3Note ** | 8.8Note ** | 7.1Note ** | 9.3Note ** | 23.6 |
| Ontario | 29.1Note ** | 21.6Note ** | 11.9Note ** | 25.4Note ** | 36.5 |
| Manitoba | 8.0Note ** | 16.4Note ** | Note x: suppressed to meet the confidentiality requirements of the Statistics Act | 11.8Note ** | 3.4 |
| Saskatchewan | 10.8Note ** | 11.1Note ** | Note x: suppressed to meet the confidentiality requirements of the Statistics Act | 10.6Note ** | 3.7 |
| Alberta | 11.1Note ** | 19.5Note ** | 7.1Note ** | 14.9Note ** | 13.1 |
| British-Columbia | 16.5Note ** | 14.3Note ** | Note x: suppressed to meet the confidentiality requirements of the Statistics Act | 15.3Note ** | 11.2 |
| Territories | 1.4Note ** | 0.8Note ** | 28.6Note ** | 1.6Note ** | 0.3 |
| Lived on a reserve in 2016 or 2021 | 16.2Note ** | 0.4Note ** | Note x: suppressed to meet the confidentiality requirements of the Statistics Act | 7.9Note ** | 0.1 |
| Registered or Treaty Indian in 2016 or 2021Table 2 Note 2 | 71.3 | 6.8 | Note x: suppressed to meet the confidentiality requirements of the Statistics Act | 39.2 | Note ...: not applicable |
| Lived inside the Inuit Nunangat in 2016 or 2021 | Note x: suppressed to meet the confidentiality requirements of the Statistics Act | Note x: suppressed to meet the confidentiality requirements of the Statistics Act | 33.3Note ** | 0.8Note ** | 0.1 |
| Remoteness categoryTable 2 Note 3 in 2016 or 2021 | |||||
| Easily accessible areas | 40.3Note ** | 50.5Note ** | 21.4Note ** | 45.4Note ** | 70.6 |
| Accessible areas | 27.0Note ** | 27.6Note ** | 21.4 | 27.0Note ** | 19.6 |
| Less accessible areas | 15.4Note ** | 12.6Note ** | 7.1 | 14.0Note ** | 7.0 |
| Remote areas | 11.8Note ** | 8.0Note ** | 28.6Note ** | 10.1Note ** | 2.5 |
| Very remote areas | 5.3Note ** | 1.2Note ** | 21.4Note ** | 3.5Note ** | 0.3 |
| Presence of dependant children two years after graduation | 37.8Note ** | 22.6Note ** | Note x: suppressed to meet the confidentiality requirements of the Statistics Act | 30.4Note ** | 14.7 |
| Women | 43.4Note ** | 26.0Note ** | 50.0Note ** | 35.4Note ** | 17.2 |
| Men | 20.4Note ** | 14.9Note ** | Note x: suppressed to meet the confidentiality requirements of the Statistics Act | 17.3Note ** | 10.6 |
| Distribution by field of study | |||||
| Women | |||||
| Education | 23.9Note ** | 21.3 | 32.4Note ** | 23.0Note ** | 20.4 |
| Social and behavioural sciences and law | 19.0 | 17.0 | 11.8Note * | 18.0 | 18.3 |
| Business, management and public administration | 22.4Note ** | 19.0 | 23.5 | 20.7 | 20.3 |
| ScienceTable 2 Note 4 | 4.0Note ** | 5.6Note ** | Note x: suppressed to meet the confidentiality requirements of the Statistics Act | 4.7Note ** | 7.0 |
| Health | 18.6Note ** | 24.7Note ** | 20.6 | 21.5 | 21.1 |
| OtherTable 2 Note 5 | 12.0 | 12.2 | Note x: suppressed to meet the confidentiality requirements of the Statistics Act | 12.1Note * | 13.0 |
| Men | |||||
| Education | 12.8Note ** | 14.4Note ** | Note x: suppressed to meet the confidentiality requirements of the Statistics Act | 13.6Note ** | 10.2 |
| Social and behavioural sciences and law | 18.2Note ** | 13.5 | Note x: suppressed to meet the confidentiality requirements of the Statistics Act | 15.7 | 14.9 |
| Business, management and public administration | 23.0Note ** | 23.4Note ** | Note x: suppressed to meet the confidentiality requirements of the Statistics Act | 23.4Note ** | 27.0 |
| ScienceTable 2 Note 4 | 20.8Note ** | 27.0 | Note x: suppressed to meet the confidentiality requirements of the Statistics Act | 24.4Note ** | 29.2 |
| Health | 7.7Note * | 7.6Note * | Note x: suppressed to meet the confidentiality requirements of the Statistics Act | 7.2Note ** | 5.7 |
| OtherTable 2 Note 5 | 17.9Note ** | 13.8 | Note x: suppressed to meet the confidentiality requirements of the Statistics Act | 15.7Note ** | 13.1 |
| Worked in the public sector two years after graduation | 63.5Note ** | 60.1Note ** | 73.8Note ** | 61.9Note ** | 45.0 |
| Women | 70.5Note ** | 69.5Note ** | 79.4Note ** | 70.2Note ** | 56.7 |
| Men | 42.0Note ** | 39.7Note ** | 44.4Note ** | 40.4Note ** | 26.1 |
|
... not applicable x suppressed to meet the confidentiality requirements of the Statistics Act
Source: Statistics Canada, integrated Postsecondary Student Information System, T1 Family File and 2016 and 2021 Census files, 2010 to 2018 cohorts. |
|||||
Indigenous bachelor’s degree holders were more likely to be women
Although there are generally more women among bachelor’s degree holders in Canada, the proportion of women among Indigenous graduates was even higher (72%) than among non-Indigenous graduates (62%). Women represented 81% of Inuit graduates, 76% of First Nations graduates and 68% of Métis graduates (Table 2).
Indigenous graduates were older at graduation and more likely to have dependent children two years after graduation
The average age at graduation (bachelor’s degree) varied across the groups (Table 2). On average, Métis graduates earned their degrees at age 27, and First Nations and Inuit graduates at age 30. Non-Indigenous graduates earned their degrees at a younger age on average (26 years). Indigenous people may follow non-linear education trajectories which may lead to individuals starting postsecondary education at a more advanced age.Note
Family responsibilities and the number of dependents requiring childcare can create direct and indirect barriers to education and employment both for Indigenous and non-Indigenous people.Note Reflecting their older age at graduation, Indigenous female graduates were one-and-a-half to three times more likely than non-Indigenous female graduates to have at least one dependent child two years after graduation (Table 2). Specifically, the proportion was 17% for non-Indigenous female graduates, compared with 26% for Métis female graduates, 43% for First Nations female graduates and 50% for Inuit female graduates.
Among men, Indigenous graduates were also more likely to have at least one dependent child. This was the case for 15% of Métis male graduates and 20% of First Nations male graduates, compared with 11% of non-Indigenous male graduates.Note
Indigenous graduates were more likely to have lived in a remote region in 2016 or 2021 than non-Indigenous graduates
According to the 2021 CensusNote , Inuit lived mainly in four northern regions of Canada, known as the Inuit Nunangat. Métis lived primarily in Western Canada and Ontario, as did most First Nations people. Almost a third of the First Nations population in Canada lived on reserves.
Living on a reserve or in a remote region is often associated with a lack of access to adequate education, lower incomes and higher unemployment rates.Note Although it is unknown whether First Nations graduates were living on reserve two years after graduation, data from the 2016 and 2021 censuses can be used to identify if First Nations graduates were living on reserve at the time the census was conducted.Note Among First Nations graduates, 16% lived on reserve in 2016 or 2021 (Table 2), compared with 27% of First Nations people aged 25 to 34 according to the 2021 Census.Note Among Inuit graduates, one-third lived in Inuit Nunangat in 2016 or 2021. By comparison, 70% of Inuit aged 25 to 34 lived in Inuit Nunangat, according to the 2021 Census.Note
An alternative way of assessing whether or not a person lived in a remote community is to look at the remoteness index of their residence.Note As Table 2 shows, Inuit graduates (57%), First Nations graduates (33%) and Métis graduates (22%) were more likely to have lived in a "less accessible", "remote" or "very remote" region in 2016 or 2021 than non-Indigenous graduates (10%).
Although it represents the reality of Indigenous geographies less accurately, the province or territory of residence two years after graduation (Table 2) is available annually (and not only in census years). It will, therefore, be the main geographic variable used in the study of quality of employment indicators.
Indigenous graduates earned their bachelor’s degree in fields similar to those of non-Indigenous graduates, but there were some differences between the groups.
The graduate’s field of study is a contributing factor to multiple outcomes. It can be driven by the need to fill positions in certain professions, and it can also play a role in workers’ wages and employment conditions. While Indigenous graduates earned their bachelor’s degrees in fields similar to non-Indigenous graduates, there were still some differences between the groups.
Among women (Chart 2.a), non-Indigenous graduates were almost equally divided between the fields of health, business, management, and public administration, education, and social and behavioural sciences, and law. Around 7% of non-Indigenous female graduates were in science fields.Note Compared with their non-Indigenous counterparts, First Nations female graduates were more concentrated in education (24% vs 20% of non-Indigenous women) and in business, management, and public administration (22% vs. 20%), but less concentrated in health (19% vs. 21%) and science (4% vs. 7%). Among Métis female graduates, a larger proportion were in the health field than non-Indigenous female graduates (25% vs. 21% respectively), and a slightly smaller proportion in the science fields (6% vs. 7%). Inuit female graduates were more likely to graduate in education (32% vs. 20%) and less likely to study social and behavioural sciences and law (12% vs. 18%) than their non-Indigenous counterparts.

Data table for Chart 2.a
| First Nations | Métis | Inuit | Indigenous IdentityData table for chart 2a Note 1 | Non Indigenous, non racialized and non immigrant (ref.) | |
|---|---|---|---|---|---|
| percent | |||||
| Education | 23.9Note ** | 21.3 | 32.4Note ** | 23.0Note ** | 20.4 |
| Social and behavioural sciences and law | 19.0 | 17.0 | 11.8Note * | 18.0 | 18.3 |
| Business, management and public administration | 22.4Note ** | 19.0 | 23.5 | 20.7 | 20.3 |
| ScienceData table for chart 2a Note 2 | 4.0Note ** | 5.6Note ** | Note x: suppressed to meet the confidentiality requirements of the Statistics Act | 4.7Note ** | 7.0 |
| Health | 18.6Note ** | 24.7Note ** | 20.6 | 21.5 | 21.1 |
| OtherData table for chart 2a Note 3 | 12.0 | 12.2 | Note x: suppressed to meet the confidentiality requirements of the Statistics Act | 12.1Note * | 13.0 |
x suppressed to meet the confidentiality requirements of the Statistics Act
Source: Statistics Canada, integrated Postsecondary Student Information System, T1 Family File and 2016 and 2021 Census files, 2010 to 2018 cohorts. |
|||||
For men (Chart 2.b), the four most popular fields were the same for Indigenous and non-Indigenous graduates: science; business, management, and public administration; social and behavioural sciences and law; and education. The fields of education and health were more common among Métis (14% and 8%, respectively) and First Nations male graduates (13% and 8%, respectively) compared with 10% and 6%, respectively, for non-Indigenous male graduates. In contrast, the proportions of male Métis and First Nations graduates from business, management and public administration (both 23%) were lower than those of male non-Indigenous graduates in this field (27%). The science field was less prevalent among First Nations male graduates (21%) than among non-Indigenous male graduates (29%).

Data table for Chart 2.b
| First Nations | Métis | Inuit | Indigenous IdentityData table for chart 2b Note 1 | Non Indigenous, non racialized and non immigrant (ref.) | |
|---|---|---|---|---|---|
| percent | |||||
| Education | 12.8Note ** | 14.4Note ** | Note x: suppressed to meet the confidentiality requirements of the Statistics Act | 13.6Note ** | 10.2 |
| Social and behavioural sciences and law | 18.2Note ** | 13.5 | Note x: suppressed to meet the confidentiality requirements of the Statistics Act | 15.7 | 14.9 |
| Business, management and public administration | 23.0Note ** | 23.4Note ** | Note x: suppressed to meet the confidentiality requirements of the Statistics Act | 23.4Note ** | 27.0 |
| ScienceData table for chart 2b Note 2 | 20.8Note ** | 27.0 | Note x: suppressed to meet the confidentiality requirements of the Statistics Act | 24.4Note ** | 29.2 |
| Health | 7.7Note * | 7.6Note * | Note x: suppressed to meet the confidentiality requirements of the Statistics Act | 7.2Note ** | 5.7 |
| OtherData table for chart 2b Note 3 | 17.9Note ** | 13.8 | Note x: suppressed to meet the confidentiality requirements of the Statistics Act | 15.7Note ** | 13.1 |
x suppressed to meet the confidentiality requirements of the Statistics Act
Source: Statistics Canada, integrated Postsecondary Student Information System, T1 Family File and 2016 and 2021 Census files, 2010 to 2018 cohorts. |
|||||
Quality of employment indicators
Several studies have looked at frameworks for analyzing quality of employment, including one from the United Nations Economic Commission for Europe (UNECE),Note Note which considers seven dimensions: safety and ethics of employment, income and benefits from employment, working time and work-life balance, security of employment and social protection, social dialogue, skills development and training and employment-related relationships and work motivation. This analysis investigates three indicators of quality of employment: employment income, the proportion with union dues, and the proportion with employer pension plan contributions. These three indicators can help to quantify three of the seven dimensions of job quality: income and benefits from employment (employment income), security of employment and social protection (proportion with employer pension plan contributions) and social dialogue (proportion with union dues).
Note that quality of employment is much broader than these three indicators. While the data file used does not contain enough variables for a comprehensive study of the different aspects of quality of employment, it does shed some light on the experiences of Métis and First Nations graduatesNote with a bachelor’s degree, which are populations not previously examined in detail.
Differences in early career quality of employment among the graduates may be related to their demographic and educational characteristics. Linear and logistic regression models were estimated to address this.Note First, demographic characteristics (Indigenous identity, age at graduation, region of residenceNote , and the presence of dependent children) and attributes of the graduates’ education (graduation year and field of study) were factored into the model. This eliminates the effect of differences due to the graduates’ demographic and education characteristics.
Second, the industry sectors of the graduates’ jobs were also factored into the models, eliminating the effect of differences due to the industry.Note Incorporating the variables in two stages makes it possible to isolate the effect of adding just the industry sector.
Taking all these factors into account makes it possible to answer the following question: when specific socio-demographic characteristics of First Nations and Métis graduates are comparable to those of non-Indigenous graduates, are any differences seen in income, unionization rate, and pension plan coverage rate? If so, the remaining differences may be due to unobservable characteristics using the available data, such as occupation, work experience, company size, hours worked, overqualification, remoteness, and discrimination.
Smaller earnings gaps between men and women were observed among Indigenous graduates compared with non-Indigenous graduates
Two years after earning their bachelor’s degree, non-Indigenous women and men earned annual employment incomes of $50,900 and $58,100, respectively: non-Indigenous women earned 12% less than non-Indigenous menNote (Chart 3). Smaller earnings gaps between men and women were observed among First Nations and Métis graduates, with women earning 9% and 8% less than men, respectively. Even after factoring in the graduates’ demographic and education characteristics, these income gaps persisted.

Data table for Chart 3
| Women | Men (ref.) | |
|---|---|---|
| 2020 constant dollars | ||
| First Nations | 50,400Note ** | 55,600 |
| Métis | 54,800Note ** | 59,400 |
| Non Indigenous, non racialized and non immigrant | 50,900Note ** | 58,100 |
Source: Statistics Canada, integrated Postsecondary Student Information System, T1 Family File and 2016 and 2021 Census files, 2010 to 2018 cohorts. |
||
Despite a narrowing of the employment income gap between genders in recent decades, disparities persist and are thought to be attributable to the differences in the occupational and industry distribution of men and women, as well as to job attributes, including women’s greater likelihood to work part-time, and to other unobservable factors such as gender bias.Note The dataset used in this analysis does not include hours worked, weeks worked, or occupation.
Among graduates with a bachelor’s degree, Métis graduates had incomes similar to non-Indigenous graduates, while First Nations graduates had slightly lower incomes than non-Indigenous graduates
Two years after earning their bachelor’s degree, Métis women earned more than non-Indigenous women, whereas First Nations women had a slightly lower income than non-Indigenous graduates (Table 3). After factoring in the effect of differences due to the graduates’ demographic, education and industry characteristics, the income gap between First Nations and non-Indigenous graduates remained significant (-4%); however, the gap between Métis and non-Indigenous female graduates was no longer significant.
Among men, First Nations graduates earned less than non-Indigenous graduates. Métis graduates had employment incomes similar to non-Indigenous graduates (Table 3). The gap remained significant (-7%) among First Nations graduates after factoring in their demographic, education, and industry characteristics.
The remaining differences in income observed between First Nations graduates and non-Indigenous graduates (men and women) may be due to unobservable factors in our data.
| Average employment income | Unadjusted gap | Adjusted gapTable 3 Note 2 (Model 1) |
Adjusted gapTable 3 Note 3 (Model 2) |
|
|---|---|---|---|---|
| 2020 constant dollars | percent difference | |||
| Women | ||||
| First Nations | 50,400 | -1.0Note ** | -3.1Note ** | -3.6Note ** |
| Métis | 54,800 | 7.7Note ** | 3.6Note ** | 2.0 |
| Non Indigenous, non racialized and non immigrant (ref.) | 50,900 | (ref.) | (ref.) | (ref.) |
| Men | ||||
| First Nations | 55,600 | -4.3Note ** | -6.5Note ** | -7.0Note ** |
| Métis | 59,400 | 2.2 | -1.0 | -2.9 |
| Non Indigenous, non racialized and non immigrant (ref.) | 58,100 | (ref.) | (ref.) | (ref.) |
Source: Statistics Canada, integrated Postsecondary Student Information System, T1 Family File and 2016 and 2021 Census files, 2010 to 2018 cohorts. |
||||
Métis graduates had higher unionization rates than non-Indigenous graduates and First Nations graduates were less likely to be unionized
The unionization rate is another quality of employment indicator. In this study, the unionization rate is the proportion of employed graduates who paid union dues two years after graduation.Note In general, women’s unionization rate is higher than that of men because women are more likely to hold jobs in the public sector (i.e., education, health, and public service), where unionization is more prevalent.Note Among graduates from 2010 to 2018, 70% of Indigenous women were employed in the public sector, compared with 40% of Indigenous men (Table 2). Among non-Indigenous graduates, these proportions were 57% for women and 26% for men.
All female graduates with a bachelor’s degree, Indigenous and non-Indigenous, were more likely to be covered by a collective agreement two years after graduation than male graduates with a bachelor’s degree (Table 4).
| Unionization rate | Unadjusted gap | Adjusted gapTable 4 Note 2 (Model 1) |
Adjusted gapTable 4 Note 3 (Model 2) |
|
|---|---|---|---|---|
| percentage | percentage point difference | |||
| Women | ||||
| First Nations | 46.0 | -8.8Note ** | -13.8Note ** | -15.2Note ** |
| Métis | 64.4 | 9.6Note ** | 5.4Note ** | 1.6Note * |
| Non Indigenous, non racialized and non immigrant (ref.) | 54.8 | (ref.) | (ref.) | (ref.) |
| Men | ||||
| First Nations | 33.9 | 1.3 | -2.7Note * | -5.8Note ** |
| Métis | 42.8 | 10.3Note ** | 6.5Note ** | 2.3Note * |
| Non Indigenous, non racialized and non immigrant (ref.) | 32.7 | (ref.) | (ref.) | (ref.) |
Source: Statistics Canada, integrated Postsecondary Student Information System, T1 Family File and 2016 and 2021 Census files, 2010 to 2018 cohorts. |
||||
Among non-Indigenous female graduates, 55% were unionized, compared with 46% for First Nations female graduates and 64% for Métis female graduates. The positive gap remained significant when all the characteristics of Métis female graduates were considered, including the industry sector. The negative gap observed among First Nations graduates persisted, even after eliminating the effect of differences attributable to their characteristics.
Although unionization rates were lower for men, trends for Métis graduates were similar to those for women. The unionization rate of non-Indigenous graduates was 33%, compared with 43% for Métis graduates and 34% for First Nations graduates. The positive gap for Métis male graduates was still significant after their characteristics were considered, whereas the gap became negative for First Nations male graduates after factoring in all characteristics. As with First Nations female graduates, other factors may explain the remaining gaps, such as characteristics not accounted for in the models and those unobservable in our data.
Métis graduates had similar pension plan coverage rates to those of non-Indigenous graduates, while First Nations graduates were less likely to be covered by a pension plan
An employer pension plan (EPP) is a registered plan that provides the covered employee with a source of income during their retirement. Similar to unionization, EPP coverage is prevalent in jobs in the public sector. The employer pension plan coverage rate is derived from the T1 Family File, using the pension adjustment. This indicates whether contributions to an EPP were made on behalf of each employee, by the employees, the employers, or both.Note
Two years after graduation, Métis graduates, both women and men, had higher rates of EPP coverage than their non-Indigenous counterparts; 65% for women (compared with 59% for non-Indigenous female graduates) and 55% for men (compared with 47% for non-Indigenous male graduates). However, these differences disappeared after factoring in the demographic, education, and industry characteristics (Table 5).
First Nations female graduates had lower EPP coverage rates (45%) than non-Indigenous female graduates. This gap persisted even after accounting for differences in graduates’ characteristics, with a difference of 19 percentage points. Among First Nations men, the unadjusted gap was not significant, but it became significant after factoring in the graduates’ characteristics (-7 percentage points).
| EPP coverage rate | Unadjusted gap | Adjusted gapTable 5 Note 2 (Model 1) |
Adjusted gapTable 5 Note 3 (Model 2) |
|
|---|---|---|---|---|
| percentage | percentage point difference | |||
| Women | ||||
| First Nations | 44.8 | -14.0Note ** | -18.0Note ** | -19.1Note ** |
| Métis | 65.1 | 6.3Note ** | 3.4Note ** | 0.6 |
| Non Indigenous, non racialized and non immigrant (ref.) | 58.8 | (ref.) | (ref.) | (ref.) |
| Men | ||||
| First Nations | 46.0 | -1.5 | -4.0Note ** | -7.0Note ** |
| Métis | 55.2 | 8.0Note ** | 4.6Note ** | 0.8 |
| Non Indigenous, non racialized and non immigrant (ref.) | 47.3 | (ref.) | (ref.) | (ref.) |
Source: Statistics Canada, integrated Postsecondary Student Information System, T1 Family File and 2016 and 2021 Census files, 2010 to 2018 cohorts. |
||||
Effect of living on or off reserve, having Registered or Treaty Indian status and living in a remote region on quality of employment indicators
Information about living on or off reserve, living in a remote region (remoteness index) and whether an individual has Registered or Treaty Indian status is only available for the 2016 and 2021 Census years. It can only be used to approximate these characteristics two years after graduation. These characteristics were not included in the main multivariate models. Still, as they are highly relevant to Indigenous peoples’ realities, they were added to Model 2 to determine the effects of these approximated characteristics on each quality of employment indicator among First Nations, Métis, and non-Indigenous graduates, where relevantNote (data not shown).
Keeping all control variables constant, living on reserve in 2016 or 2021 was associated with lower income, unionization rates and pension rates for First Nations graduates (women and men). Living in a very remote area compared to a very accessible area in 2016 or 2021 was associated with higher income for First Nations female graduates and lower pension rates for male graduates. Finally, reporting Registered or Treaty Indian status in 2016 or 2021 was associated with lower income for First Nations male graduates, and lower unionization and pension rates for First Nations female graduates. Other observed differences were not statistically significant.
For Métis graduates, living in a very remote area compared to a very accessible area in 2016 or 2021 was associated with a higher pension plan coverage rate for female graduates, while no other significant differences were observed for the other quality of employment indicators.Note
Finally, for non-Indigenous graduates, living in a very remote area compared to a very accessible area in 2016 or 2021 was associated with a higher income for both female and male graduates and a higher pension plan coverage rate for female graduates. Other observed differences were not statistically significant.
Conclusion
Using data that incorporates information about graduates who earned their bachelor’s degree between 2010 and 2018 with tax data and data from the 2016 and 2021 censuses, this article provides a profile of First Nations, Métis and Inuit graduates. Next, it compares the employment income, unionization rates, and employer pension plan coverage rate of First Nations and Métis graduatesNote with a bachelor’s degree to non-Indigenous, non-racialized and Canadian-born graduates at the start of their careers, two years after graduation. These data are essential for fully understanding issues of integrating postsecondary graduates into the labour market.
The results show that the employment income, unionization rate, and employer pension coverage rate of graduates with bachelor’s degrees were often lower among First Nations graduates than among non-Indigenous, non-racialized, and non-immigrant graduates. These differences persisted even after controlling for demographic, education, and industry characteristics. Therefore, the remaining differences could be associated with variables that are unobservable or not included in the dataset, such as occupation, work experience, hours worked, and discrimination.
The results of the three quality of employment indicators for Métis graduates with a bachelor’s degree were similar to or better than those of non-Indigenous, non-racialized and non-immigrant graduates.
Some of these results may change over time because the graduates in this study are at the start of their careers. As such, the results of a number of these indicators can improve with accumulated years of experience, especially in the context of the current labour shortage.
Soon, it will also be possible to study more recent cohorts of postsecondary graduates, including those who graduated during the COVID-19 pandemic. This data will make it possible to examine long-term wage changes and select employment conditions of graduates belonging to the groups examined in this article. Further analysis can also be conducted to examine these outcomes for graduates of college-level qualifications.
Sylvie Brunet, Liliana Corak, and Diane Galarneau are all analysts at Statistics Canada’s Canadian Centre for Education Statistics.
Acknowledgements
We acknowledge the contribution of the Assembly of First Nations (AFN) and the Congress of Aboriginal Peoples (CAP) to this paper. Their knowledge, guidance and feedback are greatly appreciated.
Data sources, methods, and definitions
Limitations
It is important to note some limitations of this paper so that the findings and data from this paper can be used appropriately.
First, readers should note that due to the small sample size, it was not possible to provide a detailed analysis separately for Inuit. Many Inuit-specific statistics could not be published due to purposeful suppression to meet the confidentiality requirements of the Statistics Act.
Secondly, the analysis assumes that those who identify as First Nations, Métis or Inuit will maintain their choice of identity throughout the censuses.
Third, the information about living on or off reserve is only available from the 2016 and 2021 censuses. Thus, the variable from the 2016 and 2021 censuses is used as an approximation of living on reserve two years after graduation. This approximation also applies to the variables that measure whether an individual lives inside or outside Inuit Nunangat or in a remote region (remoteness index) and the Registered or Treaty Indian status.
Finally, data on income is based on reported tax returns, which do not include occupation or account for full-time or part-time status and is vulnerable to inaccurate or missing data due to incorrect reporting and non-filing.
Data sources and weighting
The Education and Labour Market Longitudinal Platform (ELMLP) allows for the integration of anonymized data from the Postsecondary Student Information System (PSIS) administrative file with other data sources to enhance the PSIS socioeconomic information, as well as to provide insight into students’ pathways and their labour market outcomes after graduation. Note that the PSIS collects information from public and private (not for profit) institutions funded by a Ministry of Education. Indigenous-run postsecondary institutions are, therefore, not part of the PSIS universe.Note
The results of this study are based on the PSIS file, integrated with the T1 Family File (T1FF) and the 2016 and 2021 long-form Census data. The rate of integration between the PSIS –T1FF file and the 2016 and 2021 Censuses was comparable to the proportion of the Canadian population required to complete the long-form questionnaire, which is about one in four households. When a PSIS record could be linked to both long-form Censuses (around 13% of linked records), one of the two Censuses was randomly selected. It should be noted that for these doubly linked records, the information for 2016 and 2021 was mostly the same (over 95%) for the variables of interest in this analysis. To ensure that the population of interest was not significantly different in the integrated file versus the PSIS –T1FF file, graduate characteristics were studied for both files and were generally very similar. Although selection bias is always possible, this analysis showed that if there is a bias, it is weak.
This study is based on anonymized information from nine cohorts of graduates at the bachelor level (which include bachelor’s degrees earned at universities and colleges, but exclude graduates of medicine, veterinary medicine, optometry, dentistry, law, and pharmacy)Note who finished between 2010 and 2018.
To be able to extend the inference of the integrated population to the PSIS population, all data in this article were weighted to be representative of the PSIS population. The weights are mainly based on the estimated probability of a successful PSIS to census linkage in relation to a PSIS record’s characteristics. Bootstrap replicate weights, used in statistical tests in this study, were calculated by repeatedly resampling non-linkage weights.
Selection criteria
The census file is used to determine the Indigenous identity, the Registered or Treaty Indian status, whether or not the graduate lived on a reserve, inside the Inuit Nunangat or in a more or less remote region (remoteness index) and whether or not the graduate belonged to a racialized group or was an immigrant. Full-time student status, province of residence, presence of dependent children, employment income, unionization rate and employer pension plan coverage rate, as well as industry sector code (NAICS), were extracted from the T1FF , whereas age at graduation,Note gender, Canadian or international student status, and field of study came from the PSIS . Only graduates aged 15 and older at graduation who did not return to full-time studies within two years after receiving their degree were retained,Note on the condition that they were matched to the T1FF the two years after the graduation and to the 2016 or 2021 Census files. Two years after graduates received their degrees, their characteristics were studied, and only graduates who had paid employment and who resided in Canada were retained for the profile and the labour market indicators.
Racialized and immigrant graduates were excluded from the analysis, as these population groups achieve, on average, less favorable labor market outcomes than non-racialized and non-immigrant individuals. If these population groups were included in the analysis universe, the results of the reference group might appear less favourable and skew the gaps relative to the Indigenous groups.
Graduates who were registered as international students were also excluded. The PSIS differentiates graduates by whether they registered in their program as international students (from abroad) or as Canadian students (Canadian citizens or permanent residents). The transition from school to the labour market is often different for these two groups because international students more often have the option of leaving Canada if they receive job offers from their country of origin. In addition, it is not recommended to study the international student population with the integrated PSIS -T1FF -Census file due to differences in reference periods. The census collects data on non-permanent residents (includes international students) living in private households in Canada on Census Day, (i.e. May 10, 2016 and May 11, 2021), and this population experiences movement in and out of Canada between census years.Note
To avoid outliers in employment income, graduates were excluded if their employment income was over $500,000.
Methods
Employment income: Simple linear regression models on the log of the income were used to estimate employment income and the corresponding gaps in percentage (continuous variable). Separate models were estimated for men and women. First, demographic and educational characteristics were included as control variables, namely age, age squared, graduation year, field of study, Indigenous identity, region of residence and the presence of children (Model 1). In a second phase, the NAICS code variable was added to the rest of the variables to account for differences related to the industry sector (Model 2). Bootstrap weights were used to calculate the variance.
Unionization rates and employer pension plan coverage rates: Simple logistic regression models were used to estimate the likelihood of being covered by a collective agreement or employer pension plan (yes or no). Separate models were estimated for men and women. First, demographic and educational characteristics were included as control variables, namely age, age squared, graduation year, field of study, Indigenous identity, region of residence and the presence of children (Model 1). In a second phase, the NAICS code variable was added to the rest of the variables (Model 2). Bootstrap weights were used to calculate the variance.
Auxiliary analyses on the correlations between the quality of employment indicators
The three selected quality of employment indicators (employment income, unionization and EPP coverage) are correlated with each other to some degree. Auxiliary analyses were conducted to include the other two quality of employment indicators into each indicator’s model. More specifically, unionization and EPP coverage included in the employment income model, employment income and unionization in the EPP coverage model and employment income and EPP coverage in the unionization model.
These interactions between the quality of employment indicators were not included in the main multivariate models as our main research question was to investigate if Indigenous graduates were securing employment opportunities of equal quality to those obtained by their non-Indigenous counterparts after graduation, and not if Indigenous graduates, when having jobs of equal quality as those obtained by their non-Indigenous counterparts, had similar employment income, unionization rate and EPP coverage rate.
These auxiliary analyses showed that the direction and significance of the observed differences for all the quality of employment indicators remained the same, except when comparing the employment income for First Nations female graduates to the employment income for non-Indigenous female graduates. In that case, adding unionization and EPP coverage to the control variables of the employment income model, resulted in a positive and significant difference in favor of First Nations female graduates.
Definitions
Indigenous identity: refers to whether the person identified with the Indigenous Peoples of Canada. This includes those who identify as First Nations (North American Indian), Métis and/or Inuk (Inuit), and/or those who report being Registered or Treaty Indians (that is, registered under the Indian Act of Canada), and/or those who have membership in a First Nation or Indian band. Aboriginal peoples of Canada (referred to here as Indigenous Peoples) are defined in the Constitution Act, 1982, Section 35 (2) as including the Indian, Inuit and Métis peoples of Canada.
First Nations (North American Indian) people with and without Registered or Treaty Indian status were included in this analysis as well as First Nations people living on and off reserve.
Registered or Treaty Indians: Registered Indians are persons who are registered under the Indian Act of Canada. Treaty Indians are persons who belong to a First Nation or Indian band that signed a treaty with the Crown. Registered or Treaty Indians are sometimes also called Status Indians.
Non-racialized individuals: People not belonging to a group designated as visible minorities. The Employment Equity Act defines visible minorities as “persons, other than Aboriginal peoples, who are non-Caucasian in race or non-white in colour.” The visible minority population consists mainly of the following groups: South Asian, Chinese, Black, Filipino, Arab, Latin American, Southeast Asian, West Asian, Korean and Japanese.
Persons who are Canadian-born (or non-immigrants): Persons who are not, or have not been, a landed immigrant, a permanent resident or a non-permanent resident.
Presence of dependent children: Since this information is derived from the T1FF , some graduates may not be considered parents even if they have one or more children.
Employment income: Employment income (before income taxes and deductions) consists of amounts that are received as salary, wages, commissions, bonuses, tips, gratuities, and honoraria (line 10100 of the T1 form or line 101 before tax year 2019). It also includes other employment income (line 10400 of the T1 form or line 104 before tax year 2019) and tax-exempt employment income earned by registered Indians (derived from the information provided on the Determination of Exemption of an Indian’s Employment Income form). Graduates who did not have any employment income or were self-employed were excluded.
The average employment income presented in this article is the average of the nine cohorts of graduates (from 2010 to 2018) presented two years after receiving their bachelor’s degree (between 2012 and 2020). This average was adjusted for inflation, using the Consumer Price Index, annual average, not seasonally adjusted. The CPI for all products was used (Table 18-10-0005-01 Consumer Price Index, annual average, not seasonally adjusted). Incomes over $500,000 were excluded to avoid outliers. Income estimates are presented in 2020 constant dollars.
Unionization rate: The unionization rate was derived from the union dues variable in the T1 Family File. If the amount reported for union dues is greater than $0, the individual is considered to be covered by a collective agreement.
Employer pension plan (EPP) coverage rate: The EPP coverage rate was derived from the pension adjustment variable in the T1 file. The pension adjustment factor calculates the retirement savings accumulated by or on behalf of the member in one year in one or more Registered Pension Plans (RPPs) or Deferred Profit Sharing Plans (DPSPs) and in some non-registered pension plans or arrangements. This includes both defined-benefit and defined-contribution plans. The pension adjustment factor for one year reduces the maximum amount that the employee can contribute to a Registered Retirement Saving Plan (RRSP) or to a Pooled Registered Pension Plan (PRPP) for the following year. Unlike the TP4RP variable, which represents the amount of the tax filer’s contributions to their employer’s pension plan, the pension adjustment variable allows both employee and employer contributions to be taken into account in the event that the employee does not contribute to an EPP or profit-sharing plan. If the amount of the pension adjustment factor is greater than $0, the person is considered to be covered by an EPP .
References
Arriagada, Paula. 2021. “The achievements, experiences and labour market outcomes of First Nations, Métis and Inuit women with bachelor’s degrees or higher.” Insights on Canadian Society, Statistics Canada Catalogue no. 75-006-X.
Bérard-Chagnon, Julien, Stacey Hallman, and Geneviève Caron. 2019. “Recent immigrants and non-permanent residents missed in the 2011 Census.” Ethnicity, Language and Immigration Thematic Series, Statistics Canada Catalogue no. 89-657-X.
Galarneau, Diane, Sylvie Brunet and Liliana Corak. 2023. “Early career job quality of racialized Canadian graduates with a bachelor’s degree, 2014 to 2017 cohorts.” Insights on Canadian Society, Statistics Canada Catalogue no. 75-006-X.
Layton, Jaclyn. 2023. “Distance as a Factor for First Nations, Métis, and Inuit High School Completion.” Education, learning and training: Research Paper Series, Statistics Canada Catalogue no. 81-595-M.
O’Donnell, Vivian and Paula Arriagada. 2019. “Upgrading and high school equivalency among the Indigenous population living off reserve”.Insights on Canadian Society, Statistics Canada Catalogue no. 75-006-X.
Pelletier, Rachelle, Martha Patterson and Melissa Moyser. 2019. “The gender wage gap in Canada: 1998 to 2018.” Labour Statistics: Research Papers, Statistics Canada Catalogue no. 75-004-M.
National Collaborating Centre for Indigenous Health, 2017. “Employment as a social determinant of First Nations, Inuit and Métis health.”
Statistics Canada. 2022 (1). “Canada leads the G7 for the most educated workforce, thanks to immigrants, young adults and a strong college sector, but is experiencing significant losses in apprenticeship certificate holders in key trades.” The Daily, November 30, 2022.
Statistics Canada. 2022 (2). Table 98-10-0414-01, “Highest level of education by major field of study and Indigenous identity: Canada, provinces and territories, census metropolitan areas and census agglomerations with parts.”
Statistics Canada. 2022 (3). “Study: Indigenous women and girls: Socioeconomic conditions in remote communities compared with more accessible areas.” The Daily, June 20, 2022.
Statistics Canada. 2022 (4). Table 98-10-0423-01, “Highest level of education by Indigenous identity, Indigenous geography and labour force status: Canada, provinces and territories.”
Statistics Canada. 2022 (5). “Indigenous population continues to grow and is much younger than the non-Indigenous population, although the pace of growth has slowed.” The Daily, September 21, 2022.
Statistics Canada. 2022 (6). “Overview of the Education and Labour Market Longitudinal Platform and Associated Datasets, 2022.” Technical Reference Guides for the Education and Labour Market Longitudinal Platform (ELMLP), Statistics Canada Catalogue no. 37-20-0001.
Statistics Canada. 2022 (7). Table 98-10-0281-01, “Income statistics by Indigenous identity and residence by Indigenous geography: Canada, provinces and territories.”
Statistics Canada. 2022 (8). Table 98-10-0264-01, “Indigenous identity by Registered or Treaty Indian status and residence by Indigenous geography: Canada, provinces and territories.”
Statistics Canada. 2022 (9). “Introduction to the Statistical Framework on Quality of Employment.” Quality of Employment in Canada, Statistics Canada Catalogue no. 14-28-0001.
Statistics Canada. 2022 (10). “Trade union density rate, 1997 to 2021.” Quality of Employment in Canada, Statistics Canada Catalogue no. 37-20-0001.
Statistics Canada. 2023. “Labour market outcomes for college and university graduates, 2010 to 2019.” Technical Reference Guides for the Education and Labour Market Longitudinal Platform (ELMLP), Statistics Canada Catalogue no. 37-20-0001.
Subedi, Rajendra, Shirin Roshanafshar and T. Lawson Greenberg. 2020. “Developing Meaningful Categories for Distinguishing Levels of Remoteness in Canada”, Analytical Studies: Methods and References, Statistics Canada Catalogue no. 11-633-X.
Truth and Reconciliation Commission of Canada, 2015. “What We Have Learned: Principles of Truth and Reconciliation.”
United Nations Economic Commission for Europe (UNECE), 2015. “Handbook on Measuring Quality of Employment.”
Yassad, Lahouaria and Andrew Fields. 2018. “The Canadian Immigrant Labour Market: Recent Trends from 2006 to 2017.” The Immigrant Labour Force Analysis Series, Statistics Canada Catalogue no. 71-606-X.
- Date modified: