
Correction Notice
On July 5, 2023, the word “l’extérieur” was corrected to “l’intérieur” in the first paragraph of the introduction in the French version of the publication.
Skip to text
Text begins
Introduction
First Nations people, Metis and Inuit are comprised of diverse populations with their own unique cultures, traditions, and languages. Overall educational attainment for Indigenous populations is lower than that of their non-Indigenous counterparts. Previous research,Note as well as the findings of the Truth and Reconciliation Commission,Note have shown that the legacy of residential schools, the impact of intergenerational trauma, and the absence of culturally relevant curricula have had a profound impact on the educational outcomes of Indigenous peoples in Canada. Further, First Nations people living on reserve and Inuit living inside Inuit Nunangat are less likely to have access to a high school within their community, requiring those individuals to leave their communities to pursue education, often at a young age.Note
More broadly, geography plays an important role in the social, health, and economic outcomes of Indigenous and non-Indigenous peoples living in Canada. Proximity to labour market opportunities and educational institutions are known determinants of whether an individual successfully secures employment or pursues higher education.Note Previous work has suggested that being in closer proximity to an educational institution is positively associated with educational attainment of people from lower income families and female students.Note This advantage of proximity has been linked to reduced financial costs of schooling, continued access to community support, or the presence of role models and mentors who have also pursued education.Note In the absence of these supports, students may leave school early – to enter the labour force, to help out at home, or to care for a child, for example.
There are many additional factors at the individual, family, and community level that contribute to whether an individual pursues education. Some of these are not measurable within this analysis, including cultural, academic, and aspirational factors.Note Distance, as a result, may be a proxy for some of these characteristics. This study can, however, demonstrate the impact of distance relative to factors such as low-income status, whether an individual is a parent, sex at birth, and other geographic indicators, which tend to affect educational attainment.
Using data from the 2016 Census of Population and the Remoteness Index Classification, this fact sheet will examine the relationship between remoteness and high school completion for First Nations people living on and off reserve, Métis and Inuit aged 19 to 45. This age group was chosen to be inclusive of life-long learners, while limiting the analysis to the contemporary educational context.
The effects of distance
Indigenous peoples are more likely than non-Indigenous people to live in rural and remote communities. For First Nations people and Inuit, these settlement patterns are linked to their historical relocation by the Canadian government.Note Today, the most remote communities in Northern Canada may only be reachable by air or by road for a few months of the year. As a result, remote communities incur higher costs in the provision of essential services, including education, resulting in outdated infrastructure, poor retention of school staff and higher staff turnover rates.Note In addition, if students must travel long distances to attend high school, transportation options such as walking, public transit, and parent-provided transportation may not be available.
The Remoteness Index assigned each 2016 census subdivision into one of five categories (easily accessible; accessible; less accessible; remote; very remote areas) based on their proximity to large urban centres that provide services to smaller communities.Note Using this classification, this study examines the degree to which remoteness is associated with educational attainment.
Map 1 shows the relative remoteness of CSDs across Canada. The majority of Canada’s landmass is classified as remote or very remote. However, 71% of Canadians aged 19 to 45 live in easily accessible areas, largely concentrated along the southern border. The remaining population lives in areas that are largely undeveloped and relatively inaccessible.
Map 1 Relative remoteness of census subdivisions in Canada, using the manual classification of the remoteness index

Description for Map 1
Map 1 represents the distribution of Canadian census subdivisions (CSDs) based on the manual classification of the continuous remoteness index (RI) into five discrete categories. The dark purple, purple, light purple, light orange, and orange colours represent the “easily accessible,” “accessible,” “less accessible,” “remote”, and “very remote” areas, respectively. The light blue area represents CSDs for which the RI values were not available, either because they were not connected to any transportation network or because they did not report any population in the 2016 Census of Population.
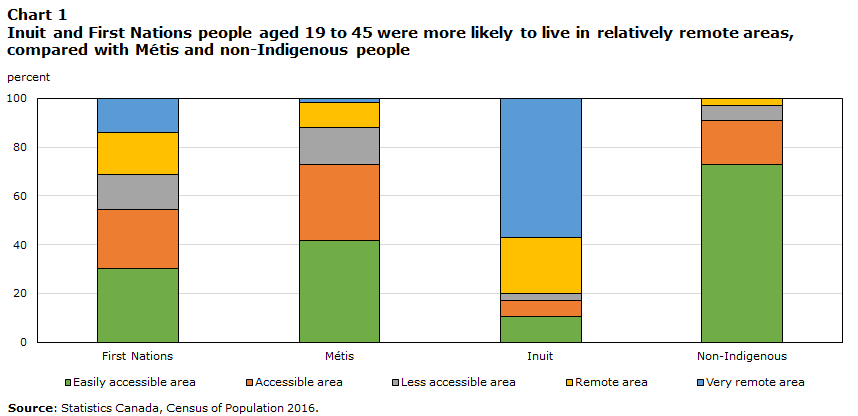
In 2016, Inuit were far more likely to live in very remote areas, followed by First Nations, Métis, and non-Indigenous people
In 2016, one-quarter of Indigenous peoples aged 19 to 45 (26%) lived in relatively remote areas of Canada, compared with just three percent of the non-Indigenous population.Note Among the Indigenous identities, there was variation in the proportion of people living in relatively remote areas.
Inuit were the most likely to live in very remote (57%) and remote areas (23%), which characterizes all communities in Inuit Nunangat. This region is the traditional homeland of Inuit, and encompasses Nunatsiavut (Labrador), Nunavik (northern Quebec), Nunavut and the Inuvialuit Region (Northwest Territories). Over 70% of all Inuit lived within these 4 regions, which makes up 35% of Canada’s landmass.Note
In 2016, one-third (33%) of First Nations people aged 19 to 45 lived on reserves. Most First Nations people living on reserve had Registered or Treaty Indian status (98%). While there are reserves in more accessible areas, 60 percent were in remote or very remote areas, with limited access to larger urban centres, and therefore, fewer services available to the communities. Of note, 75% of census subdivisions that are classified as ‘on reserve’ had fewer than 500 residents.Note
First Nations people without Registered or Treaty Indian status, however, were likely to live in easily accessible or accessible areas (79%).Note Similarly, Métis were more likely to live in easily accessible or accessible areas (73%), indicating that there were more services available to them, compared with First Nations people with Registered or Treaty Indian status and Inuit. Despite this, over 25,000 Métis lived in remote or very remote areas.
Data table for Chart 1
| First Nations | Métis | Inuit | Non-Indigenous | |
|---|---|---|---|---|
| percent | ||||
| Easily accessible area | 30 | 42 | 10 | 73 |
| Accessible area | 24 | 31 | 6 | 18 |
| Less accessible area | 15 | 15 | 3 | 6 |
| Remote area | 17 | 10 | 23 | 3 |
| Very remote area | 14 | 2 | 57 | 0 |
| Source: Statistics Canada, Census of Population 2016. | ||||
The remoteness index is highly correlated with measures of accessibility, indicating that the index is a reasonable approximation for the availability of services, including retail business, healthcare, and education facilities.Note
While these essential services are far less prevalent in relatively remote areas, these communities may benefit from a stronger sense of connection to their culture, tradition, languages, and land.Note In Inuit Nunangat, for instance, nearly two thirds (60%) of Inuit were able to conduct a conversation in InuktutNote and many participated in traditional activities such as hunting for seal, narwhal and caribou to feed their communities.Note This sense of connection to culture has been linked to improved education and health outcomes.Note
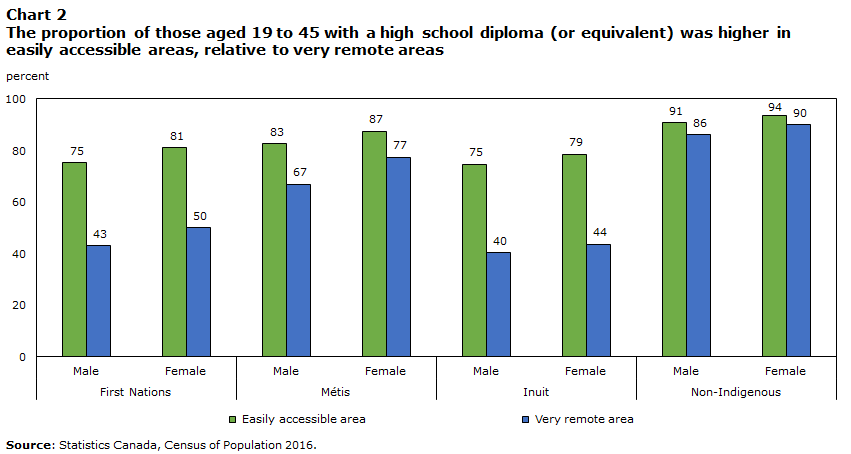
Overall high school completion was higher in relatively accessible areas, particularly for First Nations people and Inuit
Those aged 19 to 45 who lived in easily accessible areas completed high school in much higher proportions than those in very remote areas. In addition, across all identity groups, women were more likely than men to have completed high school.
First Nations people who lived in easily accessible communities were nearly twice as likely to have a high school diploma (or equivalent) as those who lived in very remote areas (32-percentage-point and 31-percentage-point difference for men and women, respectively). For Inuit, the difference was similar (35-percentage-point difference). The difference in high school completion for the Métis population living in easily accessible areas, relative to those living in very remote areas, was less pronounced (16-percentage-point and 10-percentage-point difference for men and women, respectively).
For non-Indigenous people, conversely, there was less than a five-percentage point gap between those who lived in the most remote area, relative to those who lived in the most accessible area.
Data table for Chart 2
| First Nations | Métis | Inuit | Non-Indigenous | |||||
|---|---|---|---|---|---|---|---|---|
| Male | Female | Male | Female | Male | Female | Male | Female | |
| percent | ||||||||
| Easily accessible area | 75 | 81 | 83 | 87 | 75 | 79 | 91 | 94 |
| Very remote area | 43 | 50 | 67 | 77 | 40 | 44 | 86 | 90 |
| Source: Statistics Canada, Census of Population 2016. | ||||||||
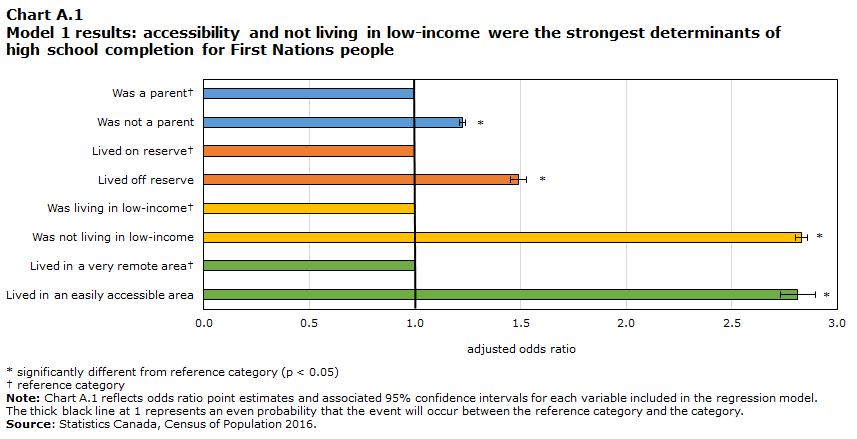
While holding all other factors constant, First Nations people living in an easily accessible area were more likely to complete high school than those living in a relatively remote areaNote
In 2016, living in an easily accessible area and being in a higher income household had the strongest association with higher rates of high school completion for First Nations people aged 19 to 45, even while controlling for other factors.
The odds of completing high school were three times higher for those who lived in easily accessible areas (Odds Ratio (OR) 2.8, see Chart A.4 in the Appendix). This association was stronger than the estimate for non-Indigenous people (OR 2.1, see Chart A.7 in the Appendix).
Additionally, there was a significant relationship between living in a higher income household and completing high school across identity groups. For First Nations people, the odds of completing high school for those living in higher income households were nearly three times higher than those who were living in low-income households (OR 2.8). A greater proportion of First Nations people live in low-income households, relative to their non-Indigenous counterparts, which has been linked to poorer educational attainment.Note
Other factors were associated with high school completion. First Nations people living off reserve were more likely to complete high school than those living on reserve (OR 1.4). However, residing off reserve is less predictive of high school completion than one’s remoteness (OR 2.8) and financial stability (OR 2.8). This is also the case for whether a person is without Registered or Treaty Indian status (OR 1.2).
Finally, First Nations people who did not have children were slightly more likely to complete high school (OR 1.2).
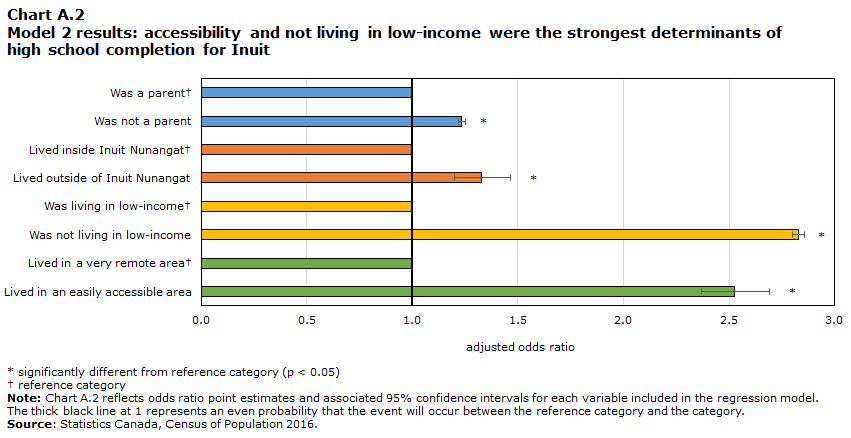
Inuit with increased access to services were more likely to complete high school
For Inuit learners, living in a higher income household has the strongest relationship with high school completion (OR 2.8, see Chart A.5 in the Appendix), more so than being a parent (OR 1.2) or living in Inuit Nunangat (OR 1.3).Note
Living in an easily accessible area has the second strongest association with high school completion (OR 2.5). The odds of finishing high school were two and a half times higher for Inuit aged 19 to 45 who live in easily accessible areas compared to very remote areas. Again, this relationship was more pronounced for Inuit than for non-Indigenous people. As most Inuit live within Inuit Nunangat, which is predominantly remote, improved access to education could benefit these communities.
Additionally, internet access is an important factor in the success of students. However, there is a digital divide between Inuit Nunangat and the rest of Canada. According to the 2017 Indigenous Peoples Survey,Note 68% of Inuit households in Inuit Nunangat had access to internet at home, compared to 91% of Inuit households outside of Inuit Nunangat.Note Although internet access was not directly measured within this fact sheet, it is likely an important factor encompassed in the relationship between remoteness and high school completion.
Métis living in higher income households were more likely to complete high school
Métis had the highest proportion of those who obtain their high school diploma (or equivalent) after non-Indigenous people. For Métis, living in a higher income household was the strongest determinant of high school completion (OR 2.9, see Chart A.6 in the Appendix). The odds of completing high school were three times higher for those who do not live in low income, compared with those who do.
For Métis, living in an easily accessible area was the second strongest determinant of high school completion (OR 2.3). The traditional homeland of the Métis encompasses Alberta, Saskatchewan, and Manitoba. One in five (21%) of Canada’s very remote communities were in Manitoba alone. However, in easily accessible areas, 8 of 10 Métis aged 19 to 45 had completed high school.
Finally, Métis who did not have children were slightly more likely to graduate (OR 1.2).
Conclusion
There is a strong relationship between geography and education. Urban communities that have more services (e.g., a high school within their community, even a postsecondary institution), or smaller communities that have access to a larger urban centre – benefit from access to educational services and facilities. This result is linked to lower costs for education, increased emotional support provided by friends and family, or the presence of role models and mentors who have also pursed education.Note These factors have the weakest effect on educational outcomes for non-Indigenous people and varying degrees of strength across Indigenous identity groups.
For First Nations people, the relative accessibility of one’s community was the most important factor in completing high school. Simply living in an easily accessible community triples the odds of high school completion for First Nations learners. For Inuit and Métis, living in a higher income household was the most important determinant of high school completion. The odds of completing high school were three times higher for those living in higher incomes households, relative to those living in low-income. These factors are interwoven, as youth who leave home to attend high school may bear a financial and emotional cost.Note Taken together, these results indicate that improving access to education within one’s own community is an important factor in decreasing the differences between First Nations, Métis, Inuit, and non-Indigenous educational attainment. This finding is in line with previous work that noted an increase in postsecondary participation after the establishment of new postsecondary institutions in remote areas.Note
However, there are other factors relevant to education which could not be explored in this analysis that could help to explain the gap in education between First Nations people, Inuit, Métis, and non-Indigenous people. For example, First Nations people, Métis and Inuit have advocated for an equitable education system, emphasizing access to quality and culturally appropriate education and targeted post-secondary supports within their communities. Future research could consider what supports are available to First Nations, Métis, and Inuit learners, as well as the efficacy of those supports.
Additionally, Indigenous measures of educational success such as ancestral language proficiency, cultural connectedness and their relationship to broader well-being outcomes could also be examined.
Finally, with the upcoming release of the 2021 Census of Population, this analysis can be replicated to assess how First Nations, Métis and Inuit education has evolved over the past 5 years.
Data sources, methods, and limitations
The data used in this fact sheet are from the long-form 2016 Census of Population. The Census is the primary source of sociodemographic data for Indigenous people in Canada.Note This survey reports Indigenous identity, educational attainment, and a host of sociodemographic characteristics that are determinants of educational outcomes.
The Remoteness Index, developed by researchers at Statistics Canada, is also utilized.Note The remoteness index assigns a relative remoteness value to each census subdivision (CSD), based on proximity to census metropolitan areas (CMAs).Note This accounts for differences between small urban centres and metropolitan areas and for proximity to large urban centres that provide services to smaller communities. The remoteness index can be classified into 5 meaningful categories:Note
- Easily accessible area
- Accessible area
- Less accessible area
- Remote area
- Very remote area
The population of interest is restricted to single identity First Nations people living on and off reserve, Inuit, Métis, and non-Indigenous people aged 19 to 45. This age group was chosen to be inclusive of life-long learners, while limiting the analysis to the contemporary educational context.
Three logistic regression models were constructed for First Nations people, Métis, and Inuit using a distinctions-based approach. In this paper, whether an individual has their high school diploma (or equivalent) is the dependent variable. The first model is run for First Nations people aged 19 to 45, using non-Indigenous people as the reference group. The second and third models are run for Métis and Inuit, respectively, maintaining the same reference category as the first. In each model, all covariates were chosen based on existing literature and had a statistically significant relationship to high school completion at the 99% confidence level.
In 2016, there were 14 incompletely enumerated reserves and settlements. As a result, population and dwelling counts are not available for these reserves and settlements and are not included in 2016 Census tabulations. While the impact of the missing data for higher-level geographic areas is small, the impact can be significant for lower-level geographies such as CSDs, as the incompletely enumerated population will account for a larger proportion of the population.Note
Additionally, this analysis is limited to the observable characteristics included in the 2016 Census of Population, excluding factors that could be relevant for Indigenous people such as gender and a family history of residential school attendance.
Finally, the outcome measured in this study is limited to whether an individual has earned their high school diploma (or equivalent). This may not fully encompass educational success for First Nations people, Métis, and Inuit, which may also include measures of ancestral language efficacy and connection to traditional activities.Note
References
Arriagada, Paula. 2015. Participation in Extracurricular Activities and High School Completion Among Off-Reserve First Nations People. Statistics Canada Catalogue no. 75-006-X.
Åslund, Olof, Östh, John, and Yves Zenou. 2010. How Important is Access to Jobs? Old Question—Improved Answer. Journal Of Economic Geography. 10, 3.
Assembly of First Nations. 2007. Redefining How Success is Measured in First Nations, Inuit and Métis Learning, Report on Learning in Canada. Ottawa.
Assembly of First Nations. 2022. First Nations Education Transportation Needs Assessment. Ottawa.
Alasia, Alessandro, et al. 2017. Measuring Remoteness and Accessibility: A Set of Indices for Canadian Communities. Reports on Special Business Products. Statistics Canada Catalogue no. 18-001-X.
Bleakney, Amanda and Alexandria Melvin. 2022. Indigenous Women and Girls: Socioeconomic Conditions in Remote Communities Compared with More Accessible Areas. Insights on Canadian Society. Statistics Canada Catalogue no. 75-006-X.
Chandler, Michael, J. and Christopher Lalonde. 1998. Cultural Continuity as a Hedge against Suicide in Canada’s First Nations. Transcultural Psychiatry. 35, 2.
Dussault, René and George Erasmus. 1994. The High Arctic Relocation: A Report on the 1953–55 Relocation. Royal Commission on Aboriginal Peoples. Toronto: Canadian Government Publishing.
Frenette, Marc. 2002. Too Far to Go on? Distance to School and University Participation. Analytical Studies Branch Research Paper Series. Statistics Canada Catalogue no. 11-F00-19M2002191.
Inuit Tapiriit Kanatami. 2022. About Canadian Inuit. Ottawa, Ontario.
Lopoo, Leonard M. and Andrew S. London. 2016. Household Crowding During Childhood and Long-Term Education Outcomes. Demography 53, 3.
Murray, Leigh, Nguyen, Hien, Lee, Yu-Feng, Remmenga, Marta D., and David W. Smith. 2012. Variance Inflation Factors In Regression Models With Dummy Variables. Conference on Applied Statistics in Agriculture.
National Collaborating Centre for Indigenous Health. 2017. Education as a Social Determinant of First Nations, Inuit and Métis Health. Social Determinants of Health.
Oster, R.T., Angela Grier, Rick Lightning, Maria J. Mayan and Ellen L. Toth. 2014. Cultural Continuity, Traditional Indigenous Language, and Diabetes in Alberta First Nations: A Mixed Methods Study. International Journal for Equity in Health 13, 92. https://doi.org/10.1186/s12939-014-0092-4
Reading, Christine and Fred Wien. 2009. Health Inequalities and Social Determinants of [Indigenous] Peoples’ Health. National Collaborating Centre for Indigenous Health. Prince George, British Columbia.
Sisco, Ashley, Margaret Caron-Vuotari, Carole Stonebridge, Greg Sutherland, and Gilles Rhéaume. 2012. Lessons Learned: Achieving Positive Educational Outcomes in Northern Communities. Insights You Can Count On. The Conference Board of Canada.
Statistics Canada. 2017a. Aboriginal Peoples in Canada: Key Results from the 2016 Census. The Daily. Statistics Canada Catalogue no. 11-001-X.
Statistics Canada. 2017b. Aboriginal Peoples Reference Guide, Census of Population, 2016. Statistics Canada Catalogue no. 98-304-X2016001.
Statistics Canada. 2017c. Labour Market Experiences of Inuit: Key findings from the 2017 Aboriginal Peoples Survey. Statistics Canada Catalogue no. 89-653-X.
Statistics Canada. 2017d. Guide to the Census of Population, 2016. Statistics Canada Catalogue no. 98-500-X2016009.
Statistics Canada. 2020. Index of Remoteness. Statistics Canada Catalogue no. 17-26-0001.
Subedi, Rajendra, Shirin Roshanafshar, and T. Lawson Greenberg. 2020. Developing Meaningful Categories for Distinguishing Levels of Remoteness in Canada. Analytical Studies: Methods and References. Statistics Canada Catalogue no. 11-663-X.
Truth and Reconciliation Commission of Canada. 2015. Canada’s Residential Schools: Reconciliation: The Final Report of the Truth and Reconciliation Commission of Canada, Volume 6. McGill-Queen’s University Press.
Zarifa, David, Darcy Hango, and Roger Pizarro Milian. 2017. Proximity, Prosperity, and Participation: Examining Access to Postsecondary Education Among Youth in Canada’s Provincial North. Rural Sociology, 83, 2.
Appendix
| First Nations | Métis | Inuit | Non-Indigenous | |||||
|---|---|---|---|---|---|---|---|---|
| Male | Female | Male | Female | Male | Female | Male | Female | |
| percent | ||||||||
| Education | ||||||||
| Had high school diploma (or equivalent) | 60.6 | 69.3 | 78.5 | 85.1 | 43.3 | 50.7 | 88.4 | 92.3 |
| Did not have high school diploma (or equivalent) | 39.3 | 30.7 | 21.5 | 14.9 | 56.8 | 49.3 | 11.6 | 7.7 |
| Age | ||||||||
| 19-24 | 28.4 | 26.1 | 26.3 | 24.5 | 28.4 | 28.2 | 22.1 | 20.7 |
| 25-29 | 20.0 | 20.1 | 19.5 | 19.7 | 21.8 | 22.0 | 18.7 | 18.4 |
| 30-34 | 17.0 | 17.9 | 17.7 | 18.5 | 17.6 | 17.2 | 18.9 | 19.2 |
| 35-39 | 15.8 | 16.5 | 16.9 | 17.0 | 14.9 | 15.1 | 18.4 | 19.1 |
| 40-45 | 18.8 | 19.5 | 19.6 | 20.3 | 17.4 | 17.6 | 22.0 | 22.7 |
| Registered or Treaty Indian status | ||||||||
| With Registered or Treaty Indian status | 77.7 | 77.6 | Note ...: not applicable | Note ...: not applicable | Note ...: not applicable | Note ...: not applicable | Note ...: not applicable | Note ...: not applicable |
| Without Registered or Treaty Indian status | 22.4 | 22.4 | Note ...: not applicable | Note ...: not applicable | Note ...: not applicable | Note ...: not applicable | Note ...: not applicable | Note ...: not applicable |
| Low-income status | ||||||||
| Lived in low income (after tax) | 29.9 | 35.2 | 12.7 | 17.6 | 20.7 | 22.2 | 12.2 | 14.0 |
| Lived outside of low-income | 70.1 | 64.8 | 87.3 | 82.4 | 79.3 | 77.9 | 87.8 | 86.0 |
| Parental status | ||||||||
| Parent | 36.6 | 57.2 | 33.9 | 50.7 | 43.8 | 62.6 | 35.9 | 48.6 |
| Non-parent | 63.4 | 42.8 | 66.1 | 49.3 | 56.3 | 37.4 | 64.1 | 51.4 |
| Residence on/off reserve | ||||||||
| Lived on reserve | 34.6 | 30.9 | Note ...: not applicable | Note ...: not applicable | Note ...: not applicable | Note ...: not applicable | Note ...: not applicable | Note ...: not applicable |
| Lived off reserve | 65.4 | 69.1 | Note ...: not applicable | Note ...: not applicable | Note ...: not applicable | Note ...: not applicable | Note ...: not applicable | Note ...: not applicable |
| Residence outside/inside Inuit Nunangat | ||||||||
| Lived outside of Inuit Nunangat | Note ...: not applicable | Note ...: not applicable | Note ...: not applicable | Note ...: not applicable | 25.4 | 29.3 | Note ...: not applicable | Note ...: not applicable |
| Lived in Inuit Nunangat | Note ...: not applicable | Note ...: not applicable | Note ...: not applicable | Note ...: not applicable | 74.6 | 70.7 | Note ...: not applicable | Note ...: not applicable |
|
... not applicable Source: Statistics Canada, Census of Population 2016. |
||||||||
| Remoteness Index Score | Population share (aged 19 to 45) | CSD share | |
|---|---|---|---|
| percent | |||
| Easily accessible area | <0.1500 | 70.89 | 15.12 |
| Accessible area | 0.1500 to 0.2888 | 18.30 | 21.46 |
| Less accessible area | 0.2889 to 0.3898 | 6.80 | 27.51 |
| Remote area | 0.3899 to 0.5532 | 3.26 | 24.00 |
| Very remote area | >0.5532 | 0.74 | 11.90 |
| Source: The data for this table come from the data table from the remoteness index of Canadian census subdivisions (Alasia et al. 2017). | |||
| First Nations | Métis | Inuit | Non-Indigenous | |||||
|---|---|---|---|---|---|---|---|---|
| Male | Female | Male | Female | Male | Female | Male | Female | |
| percent | ||||||||
| Easily accessible area | 75 | 81 | 83 | 87 | 75 | 79 | 91 | 94 |
| Accessible area | 72 | 77 | 84 | 89 | 87 | 82 | 90 | 93 |
| Less accessible area | 69 | 75 | 80 | 87 | 85 | 74 | 88 | 92 |
| Remote area | 60 | 66 | 78 | 85 | 59 | 66 | 86 | 90 |
| Very remote area | 43 | 50 | 67 | 77 | 40 | 44 | 86 | 90 |
| Source: Statistics Canada, Census of Population 2016 | ||||||||
| High school diploma (or equivalent) | |||
|---|---|---|---|
| Adjusted odds ratio | 95% Confidence Limits | ||
| to | from | ||
| Remoteness | |||
| Easily accessible area | 2.8Note * | 2.7 | 2.9 |
| Accessible area | 2.2Note * | 2.1 | 2.2 |
| Less accessible area | 1.8Note * | 1.7 | 1.8 |
| Remote area | 1.4Note * | 1.4 | 1.5 |
| Very remote area† | 1.0 | Note ...: not applicable | Note ...: not applicable |
| Residence on reserve | |||
| Lived on reserve† | 1.0 | Note ...: not applicable | Note ...: not applicable |
| Lived off reserve | 1.4Note * | 1.4 | 1.5 |
| Indigenous identity | |||
| Non-Indigenous† | 1.0 | Note ...: not applicable | Note ...: not applicable |
| First Nations | 0.4Note * | 0.4 | 0.4 |
| Registered or Treaty Indian status | |||
| With registered or Treaty Indian status† | 1.0 | Note ...: not applicable | Note ...: not applicable |
| Without registered or Treaty Indian status | 1.2Note * | 1.2 | 1.3 |
| Sex at birth | |||
| Male† | 1.0 | Note ...: not applicable | Note ...: not applicable |
| Female | 1.6Note * | 1.6 | 1.6 |
| Age | 1.0Note * | 1.0 | 1.0 |
| Low-income status | |||
| Lived in low income (after tax)† | 1.0 | Note ...: not applicable | Note ...: not applicable |
| Lived outside of low-income | 2.8Note * | 2.8 | 2.9 |
| Parental status | |||
| Parent† | 1.0 | Note ...: not applicable | Note ...: not applicable |
| Non-parent | 1.2Note * | 1.2 | 1.2 |
| Adjusted R-squared | 0.1 | ||
... not applicable
Source: Statistics Canada, Census of Population 2016 |
|||
Data table for Chart A.1
| Adjusted odds ratio | 95% confidence interval | ||
|---|---|---|---|
| from | to | ||
| Was a parent† | 1.00 | Note ...: not applicable | Note ...: not applicable |
| Was not a parent | 1.22Note * | 1.21 | 1.24 |
| Lived on reserve† | 1.00 | Note ...: not applicable | Note ...: not applicable |
| Lived off reserve | 1.49Note * | 1.45 | 1.53 |
| Was living in low-income† | 1.00 | Note ...: not applicable | Note ...: not applicable |
| Was not living in low-income | 2.83Note * | 2.80 | 2.86 |
| Lived in a very remote area† | 1.00 | Note ...: not applicable | Note ...: not applicable |
| Lived in an easily accessible area | 2.81Note * | 2.73 | 2.90 |
... not applicable
Note: Chart A.1 reflects odds ratio point estimates and associated 95% confidence intervals for each variable included in the regression model. The thick black line at 1 represents an even probability that the event will occur between the reference category and the category. Source: Statistics Canada, Census of Population 2016. |
|||
| High school diploma (or equivalent) | |||
|---|---|---|---|
| Adjusted odds ratio | 95% Confidence Limits | ||
| to | from | ||
| Remoteness | |||
| Easily accessible area | 2.5Note * | 2.4 | 2.7 |
| Accessible area | 2.0Note * | 1.8 | 2.1 |
| Less accessible area | 1.6Note * | 1.5 | 1.7 |
| Remote area | 1.3Note * | 1.2 | 1.3 |
| Very remote area† | 1.0 | Note ...: not applicable | Note ...: not applicable |
| Residence in Inuit Nunangat | |||
| Lived inside Inuit Nunangat† | 1.0 | Note ...: not applicable | Note ...: not applicable |
| Lived outside Inuit Nunangat | 1.3Note * | 1.2 | 1.5 |
| Indigenous identity | |||
| Non-Indigenous† | 1.0 | Note ...: not applicable | Note ...: not applicable |
| Inuit | 0.3Note * | 0.2 | 0.3 |
| Sex at birth | |||
| Male† | 1.0 | Note ...: not applicable | Note ...: not applicable |
| Female | 1.6Note * | 1.6 | 1.6 |
| Age | 1.0Note * | 1.0 | 1.0 |
| Low-income status | |||
| Lived in low income (after tax)† | 1.0 | Note ...: not applicable | Note ...: not applicable |
| Lived outside of low-income | 2.8Note * | 2.8 | 2.9 |
| Parental status | |||
| Parent† | 1.0 | Note ...: not applicable | Note ...: not applicable |
| Non-parent | 1.2Note * | 1.2 | 1.3 |
| Adjusted R-squared | 0.1 | ||
... not applicable
Source: Statistics Canada, Census of Population 2016 |
|||
Data table for Chart A.2
| Adjusted odds ratio | 95% confidence interval | ||
|---|---|---|---|
| from | to | ||
| Was a parent† | 1.00 | Note ...: not applicable | Note ...: not applicable |
| Was not a parent | 1.24Note * | 1.22 | 1.25 |
| Lived inside Inuit Nunangat† | 1.00 | Note ...: not applicable | Note ...: not applicable |
| Lived outside of Inuit Nunangat | 1.33Note * | 1.20 | 1.47 |
| Was living in low-income† | 1.00 | Note ...: not applicable | Note ...: not applicable |
| Was not living in low-income | 2.83Note * | 2.80 | 2.86 |
| Lived in a very remote area† | 1.00 | Note ...: not applicable | Note ...: not applicable |
| Lived in an easily accessible area | 2.52Note * | 2.37 | 2.69 |
... not applicable
Note: Chart A.2 reflects odds ratio point estimates and associated 95% confidence intervals for each variable included in the regression model. The thick black line at 1 represents an even probability that the event will occur between the reference category and the category. Source: Statistics Canada, Census of Population 2016. |
|||
| High school diploma (or equivalent) | |||
|---|---|---|---|
| Adjusted odds ratio | 95% Confidence Limits | ||
| to | from | ||
| Remoteness | |||
| Easily accessible area | 2.3Note * | 2.1 | 2.5 |
| Accessible area | 1.8Note * | 1.7 | 2.0 |
| Less accessible area | 1.5Note * | 1.4 | 1.6 |
| Remote area | 1.2Note * | 1.1 | 1.3 |
| Very remote area† | 1.0 | Note ...: not applicable | Note ...: not applicable |
| Indigenous identity | |||
| Non-Indigenous† | 1.0 | Note ...: not applicable | Note ...: not applicable |
| Métis | 0.5Note * | 0.5 | 0.5 |
| Sex at birth | |||
| Male† | 1.0 | Note ...: not applicable | Note ...: not applicable |
| Female | 1.6Note * | 1.6 | 1.6 |
| Age | 1.0Note * | 1.0 | 1.0 |
| Low-income status | |||
| Lived in low income (after tax)† | 1.0 | Note ...: not applicable | Note ...: not applicable |
| Lived outside of low-income | 2.9Note * | 2.8 | 2.9 |
| Parental status | |||
| Parent† | 1.0 | Note ...: not applicable | Note ...: not applicable |
| Non-parent | 1.2Note * | 1.2 | 1.2 |
| Adjusted R-squared | 0.1 | ||
... not applicable
Source: Statistics Canada, Census of Population 2016 |
|||
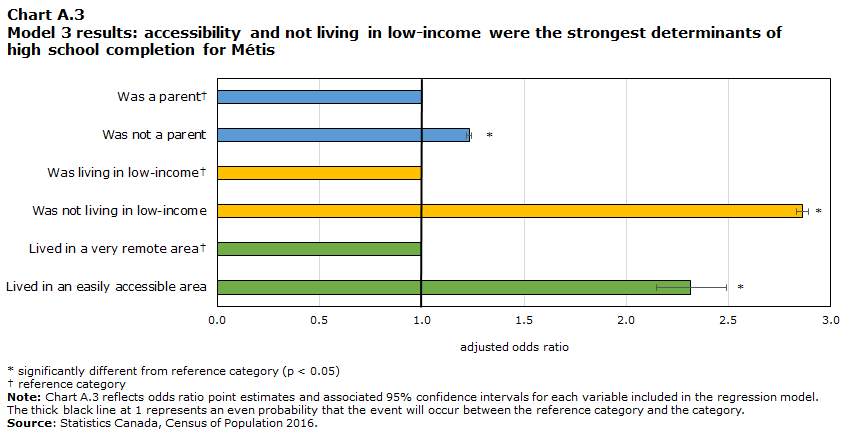
Data table for Chart A.3
| Adjusted odds ratio | 95% confidence interval | ||
|---|---|---|---|
| from | to | ||
| Was a parent† | 1.00 | Note ...: not applicable | Note ...: not applicable |
| Was not a parent | 1.23Note * | 1.22 | 1.25 |
| Was living in low-income† | 1.00 | Note ...: not applicable | Note ...: not applicable |
| Was not living in low-income | 2.86Note * | 2.83 | 2.89 |
| Lived in a very remote area† | 1.00 | Note ...: not applicable | Note ...: not applicable |
| Lived in an easily accessible area | 2.31Note * | 2.15 | 2.49 |
... not applicable
Note: Chart A.3 reflects odds ratio point estimates and associated 95% confidence intervals for each variable included in the regression model. The thick black line at 1 represents an even probability that the event will occur between the reference category and the category. Source: Statistics Canada, Census of Population 2016. |
|||
| High school diploma (or equivalent) | |||
|---|---|---|---|
| Adjusted odds ratio | 95% Confidence Limits | ||
| to | from | ||
| Remoteness | |||
| Easily accessible area | 2.1Note * | 2.0 | 2.3 |
| Accessible area | 1.7Note * | 1.5 | 1.8 |
| Less accessible area | 1.3Note * | 1.2 | 1.5 |
| Remote area | 1.1 | 1.0 | 1.2 |
| Very remote area† | 1.0 | Note ...: not applicable | Note ...: not applicable |
| Sex at birth | |||
| Male† | 1.0 | Note ...: not applicable | Note ...: not applicable |
| Female | 1.6Note * | 1.6 | 1.6 |
| Age | 1.0Note * | 1.0 | 1.0 |
| Low-income status | |||
| Lived in low income (after tax)† | 1.0 | Note ...: not applicable | Note ...: not applicable |
| Lived outside of low-income | 2.8Note * | 2.8 | 2.9 |
| Parental status | |||
| Parent† | 1.0 | Note ...: not applicable | Note ...: not applicable |
| Non-parent | 1.2Note * | 1.2 | 1.3 |
| Adjusted R-squared | 0.0 | ||
... not applicable
Source: Statistics Canada, Census of Population 2016 |
|||
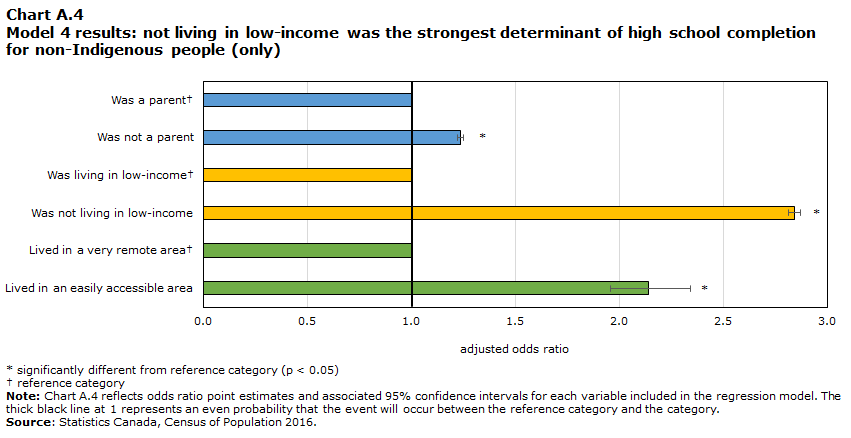
Data table for Chart A.4
| Adjusted odds ratio | 95% confidence interval | ||
|---|---|---|---|
| from | to | ||
| Was a parent† | 1.00 | Note ...: not applicable | Note ...: not applicable |
| Was not a parent | 1.24Note * | 1.22 | 1.25 |
| Was living in low-income† | 1.00 | Note ...: not applicable | Note ...: not applicable |
| Was not living in low-income | 2.84Note * | 2.81 | 2.87 |
| Lived in a very remote area† | 1.00 | Note ...: not applicable | Note ...: not applicable |
| Lived in an easily accessible area | 2.14Note * | 1.96 | 2.34 |
... not applicable
Note: Chart A.4 reflects odds ratio point estimates and associated 95% confidence intervals for each variable included in the regression model. The thick black line at 1 represents an even probability that the event will occur between the reference category and the category. Source: Statistics Canada, Census of Population 2016. |
|||
- Date modified: