
Income Research Paper Series
Market Basket Measure research paper: Examining shelter and transportation costs within census metropolitan area Market Basket Measure regions
Text begins
The Market Basket Measure (MBM) establishes poverty thresholds based on the cost of a basket of food, clothing, shelter, transportation and other items for a family of four that reflects a modest, basic standard of living. According to the MBM, a familyNote with a disposable income below the appropriate MBM threshold for its size and region of residence is living in poverty.Note
During the second comprehensive review of the MBM, stakeholder feedback emphasized the need to study whether transportation and shelter costs vary within a census metropolitan area (CMA) and whether there is a rationale for the MBM methodology to better account for these variations in costs.
According to the current MBM methodology, the transportation and shelter component costs for CMANote MBM regions (e.g., Toronto, Vancouver) are the same regardless of where a person lives within that region. For example, those living in the downtown core of a CMA would have the same shelter and transportation costs assigned to them as those living in a suburban area of the same CMA.
Exploring basket component costs within MBM regions can improve our understanding of potential issues and inconsistencies in cost measurement. In turn, this can lead to potential new refinements to the MBM methodology that could help estimate poverty rates more accurately over time. To examine shelter and transportation costs within CMAs, this discussion paper begins by describing a proposed methodology for delineating urban and suburban subregions within a CMA MBM region.Note It then recalculates the shelter and transportation costs based on the new delineations and assesses the extent to which differences in costs between urban and suburban subregions are evident. The analysis concludes by examining how the new delineations would impact the estimation of poverty rates had they been implemented. This paper also provides an opportunity for the public and stakeholders to provide feedback and comments.
Start of text boxPoverty rates
The poverty rates included in this paper were created using 2016 Census data. Therefore, they might differ from the official published poverty rates calculated using the Canadian Income Survey (CIS), the official source for poverty statistics. For example, the poverty rate in Toronto in 2015 using the CIS was 19.2%, whereas based on 2016 Census data and the 2018-base methodology, the poverty rate was estimated to be 18.9%.
Delineating urban versus suburban subregions
The first step in examining variations in shelter and transportation costs within CMA MBM regions (MBM regions that correspond to a CMA) is to identify nuanced urban and suburban subregions. To do this, it is proposed to delineate such subregions among selected CMAs using census boundaries based on 2016 Census data, since the 2016 Census was used to construct the current 2018-base MBM methodology.
When determining an appropriate delineation rule, it is necessary to balance the need for every new subregion to have enough population to properly estimate costs with the need to ensure that urban subregions encompass neighbourhoods within an “easy” commuting distance to the downtown core. To accomplish this, it is proposed that the “urban” subregion would consist of the downtownNote and the urban fringeNote of a CMA, which corresponds to every census tract (CT)Note that is accessible by a short car drive from the downtown (i.e., less than a 10-minute drive). Map 1, Map 2 and Map 3 provide a visual representation of the downtowns, as well as the urban and suburban subregions, for the CMAs of Vancouver, Montréal and Toronto.
Since this analysis focuses on shelter and transportation costs in select CMAs, only the costs of these two components were recalculated for those previously mentioned CMAs. The costs for the remaining MBM components (i.e., food, clothing and other necessities) and the calculation of disposable income remained unchanged.
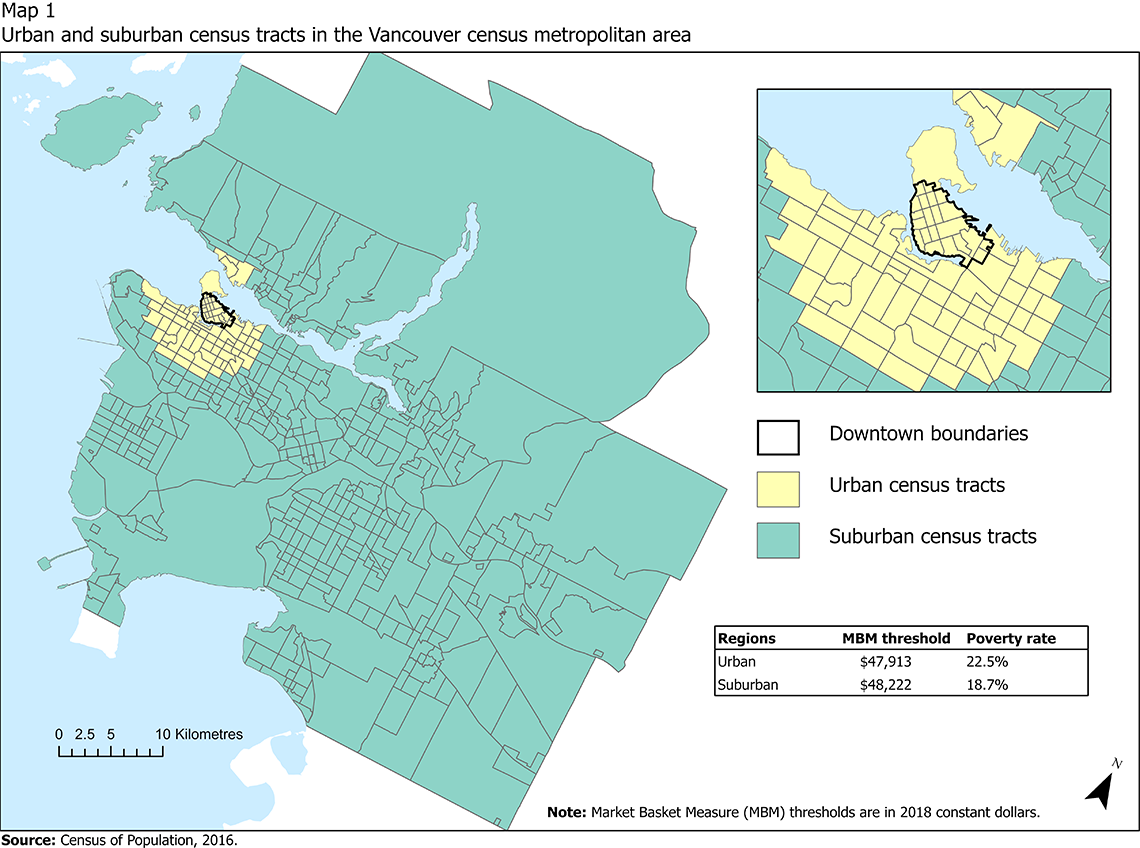
Description for Map 1
There is a map of Vancouver census tracts divided into two discrete categories. Each category has a unique color. The yellow represent urban census tracts and the green represents suburban census tracts. The boundary of the Vancouver downtown is outlined using a thick black line. There is a table on the map with MBM thresholds and poverty rates for the urban and suburban regions. The urban MBM threshold is $47,913, the suburban MBM threshold is 48,222. The urban MBM poverty rate is 22.5% and the suburban MBM poverty rate is 18.7%.

Description for Map 2
There is a map of Montreal census tracts divided into two discrete categories. Each category has a unique color. The yellow represent urban census tracts and the green represents suburban census tracts. The boundary of the Montreal downtown is outlined using a thick black line. There is a table on the map with MBM thresholds and poverty rates for the urban and suburban regions. The urban MBM threshold is $40,889, the suburban MBM threshold is $40,183. The urban MBM poverty rate is 25.4% and the suburban MBM poverty rate is 12.0%.

Description for Map 3
There is a map of Toronto census tracts divided into two discrete categories. Each category has a unique color. The yellow represent urban census tracts and the green represents suburban census tracts. The boundary of the Toronto downtown is outlined using a thick black line. There is a table on the map with MBM thresholds and poverty rates for the urban and suburban regions. The urban MBM threshold is $49,984, the suburban MBM threshold is $47,943. The urban MBM poverty rate is 24.2% and the suburban MBM poverty rate is 18.3%.
The process of dividing CMAs into urban and suburban subregions was done for all MBM regions that represent a CMA, while the remaining MBM regions were left unchanged. Therefore, the CMAs that were subdivided were St. John’s, Halifax, Saint John, Moncton, Québec, Montréal, Ottawa–Gatineau, Hamilton, Toronto, Winnipeg, Saskatoon, Regina, Edmonton, Calgary and Vancouver.
Recalculating new shelter and transportation costs
Since this analysis focuses on shelter and transportation costs in select CMAs, only the costs of these two components were recalculated for those previously mentioned CMAs. The costs for the remaining MBM components (i.e., food, clothing and other necessities) and the calculation of disposable income remained unchanged.Note Tenure type adjustments (TTAs) were recalculated using the urban and suburban subregion delineation for the select CMAs included in the analysis.
Shelter component
The MBM thresholds are defined for a reference family of two adults and two children (a girl aged 9 years and a boy aged 13 years). The standard used for costing the housing component is the Canada Mortgage and Housing Corporation’s (CMHC) National Occupancy Standard (NOS). Therefore, based on the sex and age of the children in the MBM reference family, a three-bedroom rental is costed.Table A.1 in the appendix shows the difference between published shelter costs and recalculated shelter costs after urban versus suburban delineations were implemented.Note The recalculation of shelter costs for urban and suburban subregions used a combination of either a quantile regression model or an empirical median to estimate the shelter cost, depending on the number of observations available for each subregion. To derive new TTAs, shelter costs were estimated independently for each tenure type within an MBM region (e.g., non-subsidized and subsidized renters, homeowners with or without a mortgage).
Table 1 presents the annual shelter costs for each new subregion with their confidence intervals, as well as cost differences between subregions. The results from Table 1 indicate that there is a statistically significant difference in shelter costs between urban and suburban subregions for most CMA MBM regions. Urban subregions had statistically significant higher shelter costs in St. John’s, Montréal and Toronto. Urban subregions had statistically significant lower shelter costs in Moncton, Ottawa–Gatineau, Hamilton/Burlington, Winnipeg, Saskatoon, Regina, Edmonton and Calgary.
| CMA | Shelter as a % of the 2018-base MBM threshold | 2018-base MBM shelter costs | Urban | Suburban | Difference (urban-suburban) | LCI of the difference | UCI of the difference |
|---|---|---|---|---|---|---|---|
| % | 2018 dollars | ||||||
| St. John's, Newfoundland and Labrador | 31.3 | 14,041 | 14,116 | 13,579 | 537Note * | 425 | 649 |
| Halifax, Nova Scotia | 33.9 | 15,312 | 15,084 | 15,859 | -775 | -1,674 | 123 |
| Saint John, New Brunswick | 26.7 | 11,151 | 11,251 | 11,201 | 50 | -54 | 154 |
| Moncton, New Brunswick | 29.4 | 12,368 | 12,393 | 12,719 | -326Note * | -491 | -162 |
| Québec, Quebec | 27.4 | 10,864 | 10,778 | 10,901 | -123 | -473 | 227 |
| Montréal, Quebec | 28.2 | 11,333 | 12,503 | 11,148 | 1,356Note * | 1,130 | 1,582 |
| Ottawa–Gatineau, Ontario part | 37.7 | 17,822 | 17,398 | 18,459 | -1,062Note * | -1,553 | -570 |
| Hamilton/Burlington, Ontario | 34.4 | 14,950 | 14,637 | 16,086 | -1,449Note * | -2,013 | -885 |
| Toronto, Ontario | 40.0 | 19,259 | 21,357 | 19,009 | 2,348Note * | 562 | 4,134 |
| Winnipeg, Manitoba | 34.4 | 15,147 | 14,147 | 15,598 | -1,451Note * | -2,182 | -719 |
| Saskatoon, Saskatchewan | 36.1 | 16,473 | 15,849 | 17,084 | -1,236Note * | -2,045 | -426 |
| Regina, Saskatchewan | 35.2 | 15,774 | 15,799 | 17,359 | -1,560Note * | -1,982 | -1,138 |
| Edmonton, Alberta | 39.8 | 19,055 | 18,081 | 19,629 | -1,547Note * | -2,230 | -865 |
| Calgary, Alberta | 40.1 | 19,367 | 18,955 | 19,953 | -998Note * | -1,667 | -330 |
| Vancouver, British Columbia | 39.3 | 19,125 | 18,924 | 18,496 | 428 | -145 | 1,001 |
Source: Statistics Canada, 2016 Census of Population, custom tabulation. |
|||||||
Table A.1 in the appendix shows the difference between published shelter costs and recalculated shelter costs after urban versus suburban delineations were implemented.Note The difference in costs ranged from no change to an increase of $168, with an average increase of $40.
The results reported in this paper are specific to three-bedroom rentals in the second income decile without a need for major repairs. Compositional effects can lead to challenges when comparing shelter costs between urban and suburban regions. Dwelling types, the number of rooms, larger properties and amenities such as a pool or parking spaces included in rentals in suburban neighbourhoods could also increase the value of or demand for certain suburban properties, contributing to higher shelter costs in certain CMAs. For example, accounting for dwelling type in the shelter model led to statistically significant higher shelter costs in urban areas for the CMAs of Halifax, Saint John, Québec and Vancouver, in addition to the CMAs that were reported as having statistically significant higher shelter costs in urban areas in this analysis.
Transportation component
In the 2018-base MBM methodology, the transportation component in urban MBM regions with a comprehensive transit system is costed using a weighted average of public transportation costs and private transportation costs. The transportation costs are derived from direct pricing, while the weights are derived from the 2016 Census. Specifically, for each MBM region, the weights represent the proportion of families where at least one person in the family is commuting by car. The new calculation of transportation costs would involve holding the costs derived from direct pricing constant, while new weights would be calculated for each of the new urban and suburban subregions.
Following this approach, Table 2 shows the new transportation component costs for each of the subdivided CMAs. The differences in annual costs between the urban and suburban regions would vary between a slight difference of $22 in Regina to a larger difference of $737 in Vancouver. Transportation costs were higher in suburban subregions for all CMAs. With the exception of Regina, the results were statistically significant for all CMAs.
| CMA | Transportation as a % of the 2018-base threshold | 2018-base MBM transportation costs | Urban | Suburban | Difference (urban-suburban) | LCI of the difference | UCI of the difference |
|---|---|---|---|---|---|---|---|
| % | 2018 dollars | ||||||
| St. John's, Newfoundland and Labrador | 9.5 | 4,248 | 3,993 | 4,708 | -716Note * | -794 | -638 |
| Halifax, Nova Scotia | 8.5 | 3,852 | 3,589 | 4,159 | -569Note * | -606 | -533 |
| Saint John, New Brunswick | 9.6 | 4,004 | 3,825 | 4,290 | -465Note * | -518 | -412 |
| Moncton, New Brunswick | 9.2 | 3,887 | 3,732 | 4,265 | -533Note * | -589 | -477 |
| Québec, Quebec | 9.8 | 3,875 | 3,721 | 4,060 | -340Note * | -360 | -320 |
| Montréal, Quebec | 9.4 | 3,787 | 3,346 | 3,995 | -650Note * | -659 | -640 |
| Ottawa–Gatineau, Ontario part | 9.6 | 4,538 | 4,434 | 4,638 | -204Note * | -214 | -194 |
| Hamilton/Burlington, Ontario | 11.2 | 4,854 | 4,667 | 5,100 | -432Note * | -467 | -398 |
| Toronto, Ontario | 11.6 | 5,602 | 5,345 | 5,652 | -307Note * | -312 | -303 |
| Winnipeg, Manitoba | 9.9 | 4,359 | 4,268 | 4,549 | -281Note * | -304 | -257 |
| Saskatoon, Saskatchewan | 9.4 | 4,272 | 4,219 | 4,501 | -282Note * | -337 | -226 |
| Regina, Saskatchewan | 9.7 | 4,333 | 4,330 | 4,352 | -22 | -112 | 68 |
| Edmonton, Alberta | 8.8 | 4,236 | 4,110 | 4,323 | -213Note * | -227 | -198 |
| Calgary, Alberta | 8.7 | 4,228 | 4,106 | 4,293 | -187Note * | -199 | -175 |
| Vancouver, British Columbia | 9.2 | 4,476 | 3,913 | 4,650 | -737Note * | -759 | -714 |
Source: Statistics Canada, custom tabulation. |
|||||||
Potential impact on poverty rate estimates (unofficial)
This section focuses on examining the sensitivity of poverty rate estimates to the introduction of urban and suburban subregions in selected CMAs. Table 3 compares the official poverty rates at the CMA level with estimates produced using urban versus suburban subregions for the 2015 income year (2016 Census data). For each CMA, the poverty rate estimates of the urban subregions are higher than the suburban subregion rates, suggesting a higher incidence of poverty within the urban fringe of CMAs. Furthermore, there was a statistically significant difference between the 2018-base methodology poverty rate estimate and the CMA subregion methodology estimate for 11 out of 15 CMAs. Statistically significant differences ranged from -0.18 percentage points in the Saskatoon CMA to +0.22 percentage points in Montréal. As seen in Table A.3 in the appendix, there is no statistically significant difference in provincial-level estimates and the Canada-level estimate produced with the two methods. To see the number of people in poverty using the two methods, see Table A.4 in the appendix.
| CMA | Poverty rates | Differences (CMA level) | |||||
|---|---|---|---|---|---|---|---|
| Urban | Suburban | 2018-base methodology | CMA subregion methodology | Difference | LCI of the difference | UCI of the difference | |
| percent | percentage points | ||||||
| St. John's, Newfoundland and Labrador | 18.7 | 8.2 | 13.0 | 13.0 | -0.03 | -0.06 | 0.01 |
| Halifax, Nova Scotia | 26.6 | 12.9 | 17.5 | 17.6 | 0.07Note * | 0.03 | 0.11 |
| Saint John, New Brunswick | 27.3 | 9.1 | 16.0 | 16.1 | 0.11Note * | 0.05 | 0.16 |
| Moncton, New Brunswick | 18.2 | 9.8 | 14.8 | 14.8 | 0.00 | -0.06 | 0.05 |
| Québec, Quebec | 16.4 | 6.0 | 9.0 | 9.1 | 0.04Note * | 0.02 | 0.06 |
| Montréal, Quebec | 25.4 | 12.0 | 14.3 | 14.5 | 0.22Note * | 0.21 | 0.23 |
| Ottawa–Gatineau, Ontario part | 22.6 | 10.1 | 13.7 | 13.9 | 0.15Note * | 0.13 | 0.17 |
| Hamilton/Burlington, Ontario | 19.1 | 8.8 | 12.6 | 12.7 | 0.11Note * | 0.07 | 0.14 |
| Toronto, Ontario | 24.2 | 18.3 | 18.9 | 19.0 | 0.03Note * | 0.02 | 0.03 |
| Winnipeg, Manitoba | 19.4 | 10.7 | 15.1 | 14.9 | -0.15Note * | -0.18 | -0.12 |
| Saskatoon, Saskatchewan | 16.5 | 7.9 | 14.0 | 13.8 | -0.18Note * | -0.22 | -0.13 |
| Regina, Saskatchewan | 14.1 | 5.4 | 12.6 | 12.6 | 0.02 | -0.01 | 0.05 |
| Edmonton, Alberta | 18.1 | 9.6 | 11.6 | 11.6 | 0.02 | 0.00 | 0.04 |
| Calgary, Alberta | 16.8 | 10.2 | 11.5 | 11.6 | 0.10Note * | 0.09 | 0.12 |
| Vancouver, British Columbia | 22.5 | 18.7 | 19.5 | 19.4 | -0.17Note * | -0.18 | -0.15 |
Source: 2016 Census of Population. Statistics Canada. Custom tabulation. |
|||||||
Conclusion
This paper describes a method for delineating urban and suburban subregions within CMA MBM regions to explore variations in the cost of the shelter and transportation components of the MBM basket. The exploratory analysis demonstrated that there are differences in transportation and shelter costs between urban and suburban subregions of a CMA. It also demonstrated that the method of delineating CMA subregions would yield poverty rate estimates that are statistically different from 2018-base estimates in 11 of the 15 CMA MBM regions, with differences ranging from -0.18 percentage points to +0.22 percentage points. Overall, these results suggest that the additional delineation of CMA regions does not address a systematic miscalculation of MBM thresholds and poverty rates. Furthermore, important considerations regarding increased methodological complexity, as well as the limited granularity of the household survey data used to calculate annual MBM indicators, all point to questionable merit in further delineating CMA regions.
The fundamental purpose of this research paper series is to engage with the public and with stakeholders. We encourage users to ask questions, provide feedback and make suggestions for future work. Those who are interested in contacting us are encouraged to do so by sending an email to statcan.market.basket.measure-mesure.du.panier.de.consommation.statcan@statcan.gc.ca.
Appendix A
| Subregion methodology | 2018-base methodology | Difference | |
|---|---|---|---|
| 2018 dollars | |||
| Newfoundland and Labrador, rural | 10,345 | 10,282 | 62 |
| Newfoundland and Labrador, population under 30,000 | 10,669 | 10,669 | 0 |
| Newfoundland and Labrador, population 30,000 to 99,999 | 12,543 | 12,480 | 62 |
| St. John's, Newfoundland and Labrador, CMA | Note ...: not applicable | 14,041 | Note ...: not applicable |
| St. John's, Newfoundland and Labrador, urban | 14,116 | Note ...: not applicable | Note ...: not applicable |
| St. John's, Newfoundland and Labrador, suburban | 13,579 | Note ...: not applicable | Note ...: not applicable |
| Prince Edward Island, rural | 10,473 | 10,436 | 38 |
| Prince Edward Island, population under 30,000 | 11,274 | 11,199 | 75 |
| Charlottetown, Prince Edward Island | 12,774 | 12,687 | 88 |
| Nova Scotia, rural | 9,919 | 9,842 | 77 |
| Nova Scotia, population under 30,000 | 10,832 | 10,747 | 85 |
| Nova Scotia, population 30,000 to 99,999 | 11,645 | 11,516 | 129 |
| Halifax, Nova Scotia, CMA | Note ...: not applicable | 15,312 | Note ...: not applicable |
| Halifax, Nova Scotia, urban | 15,084 | Note ...: not applicable | Note ...: not applicable |
| Halifax, Nova Scotia, suburban | 15,859 | Note ...: not applicable | Note ...: not applicable |
| Cape Breton, Nova Scotia | 11,933 | 11,764 | 168 |
| New Brunswick, rural | 9,019 | 9,019 | 0 |
| New Brunswick, population under 30,000 | 10,612 | 10,537 | 75 |
| New Brunswick, population 30,000 to 99,999 | 10,386 | 10,311 | 75 |
| Fredericton, New Brunswick | 12,907 | 12,845 | 63 |
| Saint John, New Brunswick, CMA | Note ...: not applicable | 11,151 | Note ...: not applicable |
| Saint John, New Brunswick, urban | 11,251 | Note ...: not applicable | Note ...: not applicable |
| Saint John, New Brunswick, suburban | 11,201 | Note ...: not applicable | Note ...: not applicable |
| Moncton, New Brunswick, CMA | Note ...: not applicable | 12,368 | Note ...: not applicable |
| Moncton, New Brunswick, urban | 12,393 | Note ...: not applicable | Note ...: not applicable |
| Moncton, New Brunswick, suburban | 12,719 | Note ...: not applicable | Note ...: not applicable |
| Quebec, rural | 8,843 | 8,843 | 0 |
| Quebec, population under 30,000 | 8,436 | 8,436 | 0 |
| Quebec, population 30,000 to 99,999 | 8,991 | 8,991 | 0 |
| Quebec, population 100,000 to 499,999 | 9,385 | 9,385 | 0 |
| Québec, Quebec, CMA | Note ...: not applicable | 10,864 | Note ...: not applicable |
| Québec, Quebec, urban | 10,778 | Note ...: not applicable | Note ...: not applicable |
| Québec, Quebec, suburban | 10,901 | Note ...: not applicable | Note ...: not applicable |
| Montréal, Quebec, CMA | Note ...: not applicable | 11,333 | Note ...: not applicable |
| Montréal, Quebec, urban | 12,503 | Note ...: not applicable | Note ...: not applicable |
| Montréal, Quebec, suburban | 11,148 | Note ...: not applicable | Note ...: not applicable |
| Ontario, rural | 12,139 | 12,139 | 0 |
| Ontario, population under 30,000 | 12,814 | 12,814 | 0 |
| Ontario, population 30,000 to 99,999 | 13,176 | 13,176 | 0 |
| Ontario, population 100,000 to 499,999 | 14,263 | 14,263 | 0 |
| Ontario, population 500,000 and over | 16,099 | 16,099 | 0 |
| Ottawa–Gatineau, Ontario part, CMA | Note ...: not applicable | 17,822 | Note ...: not applicable |
| Ottawa–Gatineau, Ontario part, urban | 17,398 | Note ...: not applicable | Note ...: not applicable |
| Ottawa–Gatineau, Ontario part, suburban | 18,459 | Note ...: not applicable | Note ...: not applicable |
| Hamilton/Burlington, Ontario, CMA | Note ...: not applicable | 14,950 | Note ...: not applicable |
| Hamilton/Burlington, Ontario, urban | 14,637 | Note ...: not applicable | Note ...: not applicable |
| Hamilton/Burlington, Ontario, suburban | 16,086 | Note ...: not applicable | Note ...: not applicable |
| Toronto, Ontario, CMA | Note ...: not applicable | 19,259 | Note ...: not applicable |
| Toronto, Ontario, urban | 21,357 | Note ...: not applicable | Note ...: not applicable |
| Toronto, Ontario, suburban | 19,009 | Note ...: not applicable | Note ...: not applicable |
| Manitoba, rural | 10,321 | 10,271 | 50 |
| Manitoba, population under 30,000 | 12,159 | 12,096 | 62 |
| Manitoba, population 30,000 to 99,999 | 12,196 | 12,159 | 37 |
| Brandon, Manitoba | 12,434 | 12,396 | 37 |
| Winnipeg, Manitoba, CMA | Note ...: not applicable | 15,147 | Note ...: not applicable |
| Winnipeg, Manitoba, urban | 14,147 | Note ...: not applicable | Note ...: not applicable |
| Winnipeg, Manitoba, suburban | 15,598 | Note ...: not applicable | Note ...: not applicable |
| Saskatchewan, rural | 10,969 | 10,906 | 62 |
| Saskatchewan, population under 30,000 | 12,741 | 12,629 | 112 |
| Saskatchewan, population 30,000 to 99,999 | 13,590 | 13,502 | 87 |
| Saskatoon, Saskatchewan, CMA | Note ...: not applicable | 16,473 | Note ...: not applicable |
| Saskatoon, Saskatchewan, urban | 15,849 | Note ...: not applicable | Note ...: not applicable |
| Saskatoon, Saskatchewan, suburban | 17,084 | Note ...: not applicable | Note ...: not applicable |
| Regina, Saskatchewan, CMA | Note ...: not applicable | 15,774 | Note ...: not applicable |
| Regina, Saskatchewan, urban | 15,799 | Note ...: not applicable | Note ...: not applicable |
| Regina, Saskatchewan, suburban | 17,359 | Note ...: not applicable | Note ...: not applicable |
| Alberta, rural | 14,587 | 14,587 | 0 |
| Alberta, population under 30,000 | 15,698 | 15,698 | 0 |
| Alberta, population 30,000 to 99,999 | 15,223 | 15,111 | 112 |
| Alberta, population 100,000 to 499,999 | 15,498 | 15,498 | 0 |
| Edmonton, Alberta, CMA | Note ...: not applicable | 19,055 | Note ...: not applicable |
| Edmonton, Alberta, urban | 18,081 | Note ...: not applicable | Note ...: not applicable |
| Edmonton, Alberta, suburban | 19,629 | Note ...: not applicable | Note ...: not applicable |
| Calgary, Alberta, CMA | Note ...: not applicable | 19,367 | Note ...: not applicable |
| Calgary, Alberta, urban | 18,955 | Note ...: not applicable | Note ...: not applicable |
| Calgary, Alberta, suburban | 19,953 | Note ...: not applicable | Note ...: not applicable |
| British Columbia, rural | 11,836 | 11,837 | 0 |
| British Columbia, population under 30,000 | 12,982 | 12,982 | 0 |
| British Columbia, population 30,000 to 99,999 | 13,913 | 13,914 | 0 |
| British Columbia, population 100,000 to 499,999 | 16,922 | 16,922 | 0 |
| Vancouver, British Columbia, CMA | Note ...: not applicable | 19,125 | Note ...: not applicable |
| Vancouver, British Columbia, urban | 18,924 | Note ...: not applicable | Note ...: not applicable |
| Vancouver, British Columbia, suburban | 18,496 | Note ...: not applicable | Note ...: not applicable |
|
... not applicable Note: CMA = census metropolitan area. Source: Statistics Canada, 2016 Census of Population, custom tabulation. |
|||
| Subregion methodology | 2018-base methodology | Difference | |
|---|---|---|---|
| 2018 dollars | |||
| Newfoundland and Labrador, rural | 42,601 | 42,539 | 62 |
| Newfoundland and Labrador, population under 30,000 | 42,926 | 42,926 | 0 |
| Newfoundland and Labrador, population 30,000 to 99,999 | 44,229 | 44,167 | 62 |
| St. John's, Newfoundland and Labrador, CMA | Note ...: not applicable | 44,808 | Note ...: not applicable |
| St. John's, Newfoundland and Labrador, urban | 44,627 | Note ...: not applicable | Note ...: not applicable |
| St. John's, Newfoundland and Labrador, suburban | 44,806 | Note ...: not applicable | Note ...: not applicable |
| Prince Edward Island, rural | 41,558 | 41,520 | 37 |
| Prince Edward Island, population under 30,000 | 42,358 | 42,283 | 75 |
| Charlottetown, Prince Edward Island | 43,293 | 43,205 | 88 |
| Nova Scotia, rural | 41,666 | 41,588 | 77 |
| Nova Scotia, population under 30,000 | 42,579 | 42,494 | 85 |
| Nova Scotia, population 30,000 to 99,999 | 42,929 | 42,800 | 129 |
| Halifax, Nova Scotia, CMA | Note ...: not applicable | 45,197 | Note ...: not applicable |
| Halifax, Nova Scotia, urban | 44,706 | Note ...: not applicable | Note ...: not applicable |
| Halifax, Nova Scotia, suburban | 46,050 | Note ...: not applicable | Note ...: not applicable |
| Cape Breton, Nova Scotia | 41,701 | 41,533 | 168 |
| New Brunswick, rural | 40,766 | 40,766 | 0 |
| New Brunswick, population under 30,000 | 42,359 | 42,284 | 75 |
| New Brunswick, population 30,000 to 99,999 | 42,133 | 42,058 | 75 |
| Fredericton, New Brunswick | 43,969 | 43,906 | 63 |
| Saint John, New Brunswick, CMA | Note ...: not applicable | 41,700 | Note ...: not applicable |
| Saint John, New Brunswick, urban | 41,621 | Note ...: not applicable | Note ...: not applicable |
| Saint John, New Brunswick, suburban | 42,036 | Note ...: not applicable | Note ...: not applicable |
| Moncton, New Brunswick, CMA | Note ...: not applicable | 42,026 | Note ...: not applicable |
| Moncton, New Brunswick, urban | 41,896 | Note ...: not applicable | Note ...: not applicable |
| Moncton, New Brunswick, suburban | 42,755 | Note ...: not applicable | Note ...: not applicable |
| Quebec, rural | 37,803 | 37,804 | 0 |
| Quebec, population under 30,000 | 37,397 | 37,397 | 0 |
| Quebec, population 30,000 to 99,999 | 37,441 | 37,442 | 0 |
| Quebec, population 100,000 to 499,999 | 37,940 | 37,940 | 0 |
| Québec, Quebec, CMA | Note ...: not applicable | 39,601 | Note ...: not applicable |
| Québec, Quebec, urban | 39,359 | Note ...: not applicable | Note ...: not applicable |
| Québec, Quebec, suburban | 39,822 | Note ...: not applicable | Note ...: not applicable |
| Montréal, Quebec, CMA | Note ...: not applicable | 40,160 | Note ...: not applicable |
| Montréal, Quebec, urban | 40,889 | Note ...: not applicable | Note ...: not applicable |
| Montréal, Quebec, suburban | 40,183 | Note ...: not applicable | Note ...: not applicable |
| Ontario, rural | 40,576 | 40,576 | 0 |
| Ontario, population under 30,000 | 41,250 | 41,250 | 0 |
| Ontario, population 30,000 to 99,999 | 40,769 | 40,769 | 0 |
| Ontario, population 100,000 to 499,999 | 42,933 | 42,933 | 0 |
| Ontario, population 500,000 and over | 44,851 | 44,851 | 0 |
| Ottawa–Gatineau, Ontario part, CMA | Note ...: not applicable | 47,233 | Note ...: not applicable |
| Ottawa–Gatineau, Ontario part, urban | 46,705 | Note ...: not applicable | Note ...: not applicable |
| Ottawa–Gatineau, Ontario part, suburban | 47,970 | Note ...: not applicable | Note ...: not applicable |
| Hamilton/Burlington, Ontario, CMA | Note ...: not applicable | 43,517 | Note ...: not applicable |
| Hamilton/Burlington, Ontario, urban | 43,018 | Note ...: not applicable | Note ...: not applicable |
| Hamilton/Burlington, Ontario, suburban | 44,899 | Note ...: not applicable | Note ...: not applicable |
| Toronto, Ontario, CMA | Note ...: not applicable | 48,142 | Note ...: not applicable |
| Toronto, Ontario, urban | 49,984 | Note ...: not applicable | Note ...: not applicable |
| Toronto, Ontario, suburban | 47,943 | Note ...: not applicable | Note ...: not applicable |
| Manitoba, rural | 39,004 | 38,954 | 50 |
| Manitoba, population under 30,000 | 40,842 | 40,780 | 62 |
| Manitoba, population 30,000 to 99,999 | 40,880 | 40,842 | 37 |
| Brandon, Manitoba | 40,442 | 40,404 | 37 |
| Winnipeg, Manitoba, CMA | Note ...: not applicable | 44,030 | Note ...: not applicable |
| Winnipeg, Manitoba, urban | 42,940 | Note ...: not applicable | Note ...: not applicable |
| Winnipeg, Manitoba, suburban | 44,671 | Note ...: not applicable | Note ...: not applicable |
| Saskatchewan, rural | 40,343 | 40,280 | 62 |
| Saskatchewan, population under 30,000 | 42,115 | 42,003 | 112 |
| Saskatchewan, population 30,000 to 99,999 | 42,296 | 42,208 | 87 |
| Saskatoon, Saskatchewan, CMA | Note ...: not applicable | 45,652 | Note ...: not applicable |
| Saskatoon, Saskatchewan, urban | 44,976 | Note ...: not applicable | Note ...: not applicable |
| Saskatoon, Saskatchewan, suburban | 46,493 | Note ...: not applicable | Note ...: not applicable |
| Regina, Saskatchewan, CMA | Note ...: not applicable | 44,833 | Note ...: not applicable |
| Regina, Saskatchewan, urban | 44,855 | Note ...: not applicable | Note ...: not applicable |
| Regina, Saskatchewan, suburban | 46,437 | Note ...: not applicable | Note ...: not applicable |
| Alberta, rural | 45,047 | 45,047 | 0 |
| Alberta, population under 30,000 | 46,158 | 46,158 | 0 |
| Alberta, population 30,000 to 99,999 | 44,987 | 44,874 | 112 |
| Alberta, population 100,000 to 499,999 | 45,468 | 45,468 | 0 |
| Edmonton, Alberta, CMA | Note ...: not applicable | 47,869 | Note ...: not applicable |
| Edmonton, Alberta, urban | 46,770 | Note ...: not applicable | Note ...: not applicable |
| Edmonton, Alberta, suburban | 48,530 | Note ...: not applicable | Note ...: not applicable |
| Calgary, Alberta, CMA | Note ...: not applicable | 48,349 | Note ...: not applicable |
| Calgary, Alberta, urban | 47,815 | Note ...: not applicable | Note ...: not applicable |
| Calgary, Alberta, suburban | 49,000 | Note ...: not applicable | Note ...: not applicable |
| British Columbia, rural | 41,463 | 41,463 | 0 |
| British Columbia, population under 30,000 | 42,608 | 42,608 | 0 |
| British Columbia, population 30,000 to 99,999 | 42,829 | 42,829 | 0 |
| British Columbia, population 100,000 to 499,999 | 47,111 | 47,111 | 0 |
| Vancouver, British Columbia, CMA | Note ...: not applicable | 48,677 | Note ...: not applicable |
| Vancouver, British Columbia, urban | 47,913 | Note ...: not applicable | Note ...: not applicable |
| Vancouver, British Columbia, suburban | 48,222 | Note ...: not applicable | Note ...: not applicable |
|
... not applicable Note: CMA = census metropolitan area. Source: Statistics Canada, custom tabulation. |
|||
| Region | Poverty rates | |||||
|---|---|---|---|---|---|---|
| CMA subregion methodology | 2018-base methodology | |||||
| Estimate | LCI | UCI | Estimate | LCI | UCI | |
| % | ||||||
| Canada | 14.5 | 14.5 | 14.5 | 14.5 | 14.5 | 14.5 |
| Newfoundland and Labrador | 13.2 | 13.0 | 13.3 | 13.1 | 13.0 | 13.3 |
| Prince Edward Island | 16.7 | 16.4 | 17.0 | 16.5 | 16.2 | 16.8 |
| Nova Scotia | 17.6 | 17.5 | 17.8 | 17.6 | 17.5 | 17.7 |
| New Brunswick | 15.6 | 15.5 | 15.7 | 15.6 | 15.5 | 15.7 |
| Quebec | 12.5 | 12.4 | 12.5 | 12.3 | 12.3 | 12.4 |
| Ontario | 15.6 | 15.5 | 15.6 | 15.5 | 15.5 | 15.6 |
| Manitoba | 14.2 | 14.1 | 14.3 | 14.3 | 14.2 | 14.4 |
| Saskatchewan | 12.8 | 12.7 | 12.9 | 12.9 | 12.8 | 13.0 |
| Alberta | 11.4 | 11.4 | 11.5 | 11.4 | 11.3 | 11.5 |
| British Columbia | 17.5 | 17.4 | 17.5 | 17.6 | 17.5 | 17.6 |
|
Note: CMA = census metropolitan area; LCI = lower confidence interval; UCI = upper confidence interval. Source: Statistics Canada, 2016 Census of Population, custom tabulation. |
||||||
| CMA | Urban | Suburban | 2018-base methodology | CMA subregion methodology | Difference |
|---|---|---|---|---|---|
| number of people in poverty | |||||
| St. John's, Newfoundland and Labrador | 17,419 | 8,994 | 26,465 | 26,413 | -52 |
| Halifax, Nova Scotia | 35,998 | 33,829 | 69,557 | 69,827 | 270 |
| Saint John, New Brunswick | 12,943 | 6,914 | 19,724 | 19,857 | 133 |
| Moncton, New Brunswick | 15,287 | 5,647 | 20,936 | 20,934 | -2 |
| Québec, Quebec | 38,111 | 32,397 | 70,197 | 70,508 | 311 |
| Montréal, Quebec | 195,316 | 387,776 | 574,368 | 583,092 | 8,724 |
| Ottawa–Gatineau, Ontario part | 66,559 | 68,700 | 133,831 | 135,259 | 1,428 |
| Hamilton/Burlington, Ontario | 53,279 | 40,199 | 92,699 | 93,478 | 779 |
| Toronto, Ontario | 158,154 | 954,110 | 1,110,627 | 1,112,264 | 1,637 |
| Winnipeg, Manitoba | 71,300 | 42,314 | 114,755 | 113,614 | -1,141 |
| Saskatoon, Saskatchewan | 32,940 | 6,961 | 40,406 | 39,901 | -505 |
| Regina, Saskatchewan | 27,100 | 2,194 | 29,243 | 29,294 | 51 |
| Edmonton, Alberta | 54,962 | 95,002 | 149,723 | 149,964 | 241 |
| Calgary, Alberta | 48,291 | 110,339 | 157,218 | 158,630 | 1,412 |
| Vancouver, British Columbia | 94,241 | 374,255 | 472,515 | 468,496 | -4,019 |
|
Note: CMA = census metropolitan area. Source: Statistics Canada, 2016 Census of Population, custom tabulation. |
|||||
Appendix B
| Research topic | Short description |
|---|---|
| Child care expenses | Currently, child care costs are represented in the Market Basket Measure (MBM) as a direct deduction from disposable income. This way, a family’s needs are compared with an income measure that reflects its available resources. Experts have asked Statistics Canada whether this is the best way to deal with child care expenses in the MBM. Could child care costs instead be treated as a separate basket item? |
| Remoteness: Delineating Remote Regions for the Market Basket Measure | Statistics Canada will research whether adjustments should be made to the Market Basekt Measure to account for higher costs faced by families living in remote regions and communities to derive, for example, better estimates for the northern region of each province. |
| Market Basket Measure thresholds for remote regions | |
| Different family types | Currently, Statistics Canada estimates Market Basket Measure (MBM) thresholds for a family of four, then uses the square root equivalization scale to derive thresholds for families of different sizes. Does this method lead to the best possible thresholds for smaller families and unattached individuals? Additional study could be conducted on whether it may be appropriate to construct separate basket values for families of the same size but with different compositions (e.g., a one-parent family with three children versus a couple with two children) or other characteristics (e.g., age of family members). |
| Equivalization analysis | |
| Communications technology | Statistics Canada will look at how a separate communication component could best be added to the Market Basket Measure. Presently, this need for communication goods and services is reflected in the “other” component. |
| The other component | The “other necessities” component is meant to represent the costs of goods and services other than food, shelter, transportation and clothing. The list of items that could potentially be included in the other component is large and could vary depending on the structure, age, location or other circumstances of a family. Ongoing research on the methodology underpinning the other component could verify whether the current method for setting the value of the other component is adequate or must be improved. |
| Poverty index | Anchoring the Market Basket Measure (MBM) to specific base years while updating it regularly to reflect changes in the standards of living to ensure it remains relevant is an underlying strength of the MBM. However, periodically rebasing the MBM leads to the creation of various poverty lines, which can make it difficult to track poverty trends over longer periods. To improve transparency and help track poverty trends over longer periods, the implementation of a poverty reduction index will be considered. |
| Inverse correlation of shelter and transportation costs | Often, people in areas where shelter costs are relatively higher have transportation costs that are relatively lower and vice versa. For instance, people in rural areas typically pay lower rents or mortgages but must spend more on fuel and seldom access public transportation. We propose exploring whether the Market Basket Measure could be improved by more precisely considering these differences in costs. |
| Using the Market Basket Measure with administrative data | As it currently exists, the Market Basket Measure (MBM) poverty rates can only be accurately calculated using a combination of survey and administrative data. We propose exploring the feasibility of applying MBM thresholds to only administrative data. |
| Additional Market Basket Measure income inequality indicators | The majority of the current Market Basket Measure-based analytical products do not describe the full income distribution. Since they typically compare the Market Basket Measure threshold with disposable income, they do not fully describe income inequality. Proposed additional inequality indicators will be presented, which will allow better identification of income disparities among Canadians. |
References
Djidel, Samir, Gustajtis Burton, Heisz Andrew, Lam Keith, and McDermott Sarah (2019), “Towards an update of the Market Basket”. Catalogue no.75F0002M2019013.
Djidel, Samir, Burton Gustajtis, Andrew Heisz, Keith Lam, Isabelle Marchand and Sarah McDermott (2020), “Report on the second comprehensive review of the Market Basket Measure”. Catalogue no. 75f0002m2020002.
Employment and Social Development Canada (2018), “Opportunity for All – Canada’s First Poverty Reduction Strategy”. Catalogue no. SSD-212-08-18E.
Hatfield, Michael, Pyper Wendy, and Gustajtis Burton (2010), “First Comprehensive Review of the Market Basket Measure of Low Income”. Applied Research Branch paper, Human Resources and Skills Development Canada.
Heisz, Andrew (2019), “An update on the Market Basket Measure comprehensive review”. Catalogue no.75F0002M2019009.
Sergerie, François, Chastko Karl, Saunders Dylan, Charbonneau Patrick (2021), “Defining Canada’s Downtown Neighbourhoods: 2016 Boundaries”. Catalogue no. 91f0015m.
Statistics Canada (2022), “Canada’s large urban centres continue to grow and spread”. Component of Statistics Canada catalogue no. 11-001-X- Date modified: