
Income Research Paper Series
Market Basket Measure research paper: Applying the Market Basket Measure methodology to an administrative data source
Text begins
The Market Basket Measure (MBM) establishes poverty thresholds based on the cost of a basket of food, clothing, shelter, transportation and other necessary items for a family of four that reflects a modest, basic standard of living. According to the MBM, an individual or a familyNote with a disposable income below the applicable MBM threshold for their size and region of residence is living in poverty.Note
This discussion paper describes considerations for applying the MBM methodology to a purely administrative data source. The T1 Family File (T1FF)Note has been selected for the project because it is a reliable source of income data, is produced annually, supports census family units and covers a large proportion of the Canadian population. However, because of data limitations, the T1FF data had to be augmented using survey data (e.g., Census of Population) to support the MBM.
The paper begins by outlining a rationale for estimating MBM poverty statistics using administrative income data sources. It then explains a proposal for creating annual samples, along with the caveats of creating these samples, followed by a brief analysis using the proposed samples. The paper concludes with potential future improvements to the samples and provides an opportunity for readers’ feedback.
It should be noted that the poverty rate estimates generated strictly from administrative income data (the T1FF) and examined throughout this paper are not official. These estimates were derived for exploratory purposes and should not be used to describe the incidence of poverty or poverty trends among the Canadian population.
Rationale
Currently, cross-sectional poverty estimates can be produced using income data linked to the Canadian Income Survey (CIS) and the Census of Population long-form questionnaire. These data sources have advantages and disadvantages related to sample size and data collection frequencies. For example, the CIS can be used to produce annual poverty estimates, but its sample size can limit the production of highly disaggregated poverty estimates. Conversely, the long-form census questionnaire allows for a more refined disaggregation, at the expense of timeliness (see Table 1 for a more complete comparison).
| Data file | Relative sample size | Statistics | Relative data disaggregation | Frequency | Income source |
|---|---|---|---|---|---|
| CIS | Small (about 55,000 households in 2021) |
Cross-sectional | Low | Annual | APIM |
| Long-form census questionnaire | Large (about 8,500,000 people in 2021) |
Cross-sectional | High | Quinquennial | Census income processing |
| T1FF | Large (about 36,500,000 people in 2020) |
Cross-sectional and longitudinal | High | Annual | T1FF |
| Notes: CIS = Canadian Income Survey; T1FF = T1 Family File; and APIM = Administrative Personal Income Masterfile. | |||||
Applying the MBM methodology to a purely administrative income data source would allow for timeliness and relevance simultaneously and could make longitudinal analysis possible.
The Newfoundland and Labrador Market Basket Measure
Since 2003, the Newfoundland and Labrador Statistics Agency has produced MBM-based poverty estimates using administrative income data only, using the Newfoundland and Labrador Market Basket Measure (NLMBM). By modifying the underlying and current MBM methodology (e.g., no tenure type adjustments), the NLMBM thresholds are compared with the NLMBM definition of disposable income calculated from administrative income data. While this discussion paper explores the application of the 2018-base MBM methodology to T1FF data, significant adjustments to the foundations of the MBM methodology are required to estimate poverty rates with administrative income data only.
The need to produce precise cross-sectional and longitudinal poverty estimates in a timely manner is often raised by policy analysts and data users interested in better understanding changes in poverty rates for smaller domains and population transitions into and out of poverty. Since the two income sources currently used for poverty measurement (i.e., the CIS and the census) are cross-sectional in design, they cannot be used by themselves to produce longitudinal analyses. However, using a linked administrative data source (e.g., the T1FF) could allow for such analyses. Longitudinal estimates could inform the development of policies and programs to better target populations at risk of living in poverty and help federal, provincial and territorial governments assess impacts of poverty reduction efforts.Note
As a first step, it is proposed to research the feasibility of adding the MBM to the T1FF, which would allow the production of annual disaggregated poverty estimates, while simultaneously allowing the production of longitudinal estimates.
The T1FF was chosen because the information available on the T1FF database comes from purely administrative sources, either produced by the Canada Revenue Agency (CRA) or obtained by the CRA for tax purposes. In addition, the T1FF can produce a similar family conceptNote to the census family concept used for the long-form census questionnaire data.Note For these reasons, income data from the T1FF could be used to provide estimates more reliable than CIS estimates and timelier than census estimates. They could also potentially be used to produce poverty estimates using a consistent, albeit adjusted, MBM methodology.
The T1 Family File
The T1FF contains income data from almost all individuals who filed an individual T1 tax return in any specific year (some late filers are not covered) and includes recipients of federal child benefits. To construct the T1FF, the individual T1 file is combined with the T4 tax file and a file pertaining to federal child benefits, which are all received from the CRA. The files are processed over a four- to five-month period to create the T1FF. Newborns from the previous year, not represented on the federal child benefits file, are identified from a file of births. Families are joined, and identifiable missing spouses and children are imputed. The final T1FF contains information for tax filers and imputed family members. When complete, T1FF records are left unweighted and unadjusted.
Sample creation
Characteristics of the T1 Family File and implications for supporting the Market Basket Measure methodology
Certain elements of the 2018-base MBM methodology require information that is not collected through the T1FF. Therefore, simply applying the existing MBM methodology to the T1FF is not possible. For example, one characteristic of the 2018-base MBM is that it adjusts the disposable income of families living in housing tenures other than a non-subsidized rental dwelling through a tenure type adjustment (TTA).Note Housing tenure information is not available through the T1FF, meaning that a TTA cannot be implemented using T1FF data alone. The items below identify some key data limitations that complicate the application of the 2018-base MBM methodology to estimate poverty rates using T1FF data:
- It is not possible to recreate economic families with T1FF data.
- On the T1FF, people are grouped into families using information found in tax forms and slips. These family groupings are closer in definition to the census family than to the economic family. Using a census family concept instead of an economic family concept is expected to increase the likelihood of individuals living under the poverty line when their economic family is composed of multiple census families. One reason behind this is that the disposable income of the economic family would be larger than the disposable income of each individual census family under it.Note Please refer to Appendix B for an illustration of family unit concepts and hierarchy.
- It is not possible to create the MBM regions accurately.
- The notion of small urban regions that are not unique census agglomerations does not exist on the T1FF, preventing the distinction between rural MBM regions and small urban MBM regions, as defined in the 2018-base MBM.
- It is not possible to apply the TTA.
- The T1FF contains no information on homeownership or rental subsidization status.
- It is not possible to know the full child care or spousal support payments paid by families, since the T1FF data could underestimate costs because of the claimable limit for tax purposes.
- The 2018-base MBM uses survey information to augment the tax information to better represent these expenses.
One possibility to circumvent the limitations of the T1FF is to obtain the missing information from the long-form census questionnaire, thus creating a new and augmented administrative data sample, the T1FF–MBM. The linkage of the T1FF to the long-form census questionnaire would provide key missing information, such as the MBM region, the type of housing tenure, child care expenses and spousal support payments paid, and a sampling weight.Note
However, as a result of introducing data from the long-form census questionnaire to provide key information required by the MBM methodology, some additional data limitations would be introduced:
- Individuals and families would be assumed to remain in the same MBM region.
- Because the MBM region assigned to each person in the T1FF would come from the census and would not be updated every year, poverty rate estimates for certain geographies with high mobility may not be accurate.
- The TTA would be held constant.
- Changes in housing tenure would not be accounted for, because household tenure would not be updated every year. As a result, the TTA applied to the disposable income of an individual may not correspond to the actual housing situation of the individual.
- Child care and spousal support payments paid would be held constant for each cohort.
- Some discrepancies may be introduced when calculating poverty, because survey responses on child care or alimony expenses would not be updated every year, because no new census data would be available.
- Census survey weights would be held constant.
- While a new T1FF is available annually, the survey weights linked from the census would be held constant until a new census file is linked. This would imply that the new T1FF–MBM sample would still represent the initial cohort population.
The creation of T1 Family File–Market Basket Measure samples
For any census year (CY), the long-form census questionnaire could be linked to the T1FF of the same income year using a deterministic key (e.g., Social Insurance Number [SIN] to census unique person identifier), and the linked individuals would form a new cohort. For example, the 2016 long-form census questionnaire would be linked to the 2015 T1FF and the 2021 long-form census questionnaire would be linked to the 2020 T1FF to generate two distinct cohorts.Note Additional individuals found on the T1FF with no known SIN and for whom one or more family members completed the long-form census questionnaire would be added to the cohort to create a T1FF–MBM (CY) sample. The data would be processed to ensure that every member of a T1FF family obtains the same census characteristics. The information obtained from the long-form census questionnaire (i.e., MBM region, tenure type, and child care and spousal support payments) would be considered fixed for subsequent years (e.g., intra census years [IYs]) until the creation of a new cohort.
While the characteristics obtained from the long-form census questionnaire would be held constant, family structures and disposable income would be updated every year using the annual T1FF data when creating the T1FF–MBM (IY) samples. For more details on the creation of the annual T1FF–MBM samples, please refer to Appendix A.
| Data file | Population total |
|---|---|
| person | |
| 2015 T1FF–MBM (CY) | 29,669,034 |
| 2016 T1FF–MBM (IY) | 29,014,263 |
| 2017 T1FF–MBM (IY) | 28,743,724 |
| 2018 T1FF–MBM (IY) | 28,446,687 |
| 2019 T1FF–MBM (IY) | 28,027,812 |
| 2020 T1FF–MBM (IY) | 27,701,419 |
| 2020 T1FF–MBM (CY) | 30,160,957 |
|
Note: CY in the sample name stands for census year and indicates the birth of a new cohort, while IY stands for intra census year and indicates that the T1 Family File (T1FF) has been linked to the previous year's T1FF–Market Basket Measure (MBM) file. Source: Statistics Canada, custom tabulation. |
|
Table 2 shows the population estimates obtained from multiple T1FF–MBM samples. With the proposed methodology, we would expect to see the population counts decrease annually following the creation of a new cohort, because every person included in the T1FF–MBM (IY) samples also had to be present in the initial cohort.
Analysis
Sample distribution
Since administrative tax and income data are the basis of the annual T1FF–MBM sample, it is probable that the T1FF–MBM population differs from the CIS and long-form census questionnaire populations. As a result, poverty estimates obtained from these different source files are expected to differ. To analyze potential differences, we compared the distribution of specific characteristics across these three different sources for 2015 and 2020. We looked at the distribution of families’ total income and disposable income and the number of people by province, age group, family type and family status. All distributions examined were similar across the different files, except for the distribution by age group. Chart 1 below shows that there are more people aged younger than 19 years on the T1FF–MBM compared with the T1FF dataset and the census for two income years. Also, there are fewer people aged 20 to 54 years on the T1FF–MBM than on the T1FF and the census, for both income years.

Data table for Chart 1
| Age Groups | 2015 | 2020 | ||||
|---|---|---|---|---|---|---|
| 2016 Census | 2015 T1FF–MBM | 2015 T1FF | 2021 Census | 2020 T1FF–MBM | 2020 T1FF | |
| percent | ||||||
| 0 to 4 years | 5.4 | 6.0 | 5.7 | 5.0 | 5.5 | 5.2 |
| 5 to 9 years | 5.8 | 6.3 | 5.9 | 5.6 | 6.2 | 5.7 |
| 10 to 14 years | 5.5 | 6.1 | 5.7 | 5.8 | 6.4 | 5.8 |
| 15 to 19 years | 5.8 | 6.5 | 6.1 | 5.5 | 6.4 | 5.9 |
| 20 to 24 years | 6.4 | 5.9 | 6.1 | 6.0 | 5.5 | 5.8 |
| 25 to 29 years | 6.6 | 6.0 | 6.5 | 6.6 | 6.1 | 6.7 |
| 30 to 34 years | 6.7 | 6.3 | 6.8 | 6.9 | 6.4 | 7.0 |
| 35 to 39 years | 6.6 | 6.4 | 6.6 | 6.9 | 6.5 | 6.9 |
| 40 to 44 years | 6.5 | 6.3 | 6.5 | 6.6 | 6.3 | 6.5 |
| 45 to 49 years | 6.8 | 6.6 | 6.7 | 6.3 | 6.1 | 6.2 |
| 50 to 54 years | 7.7 | 7.5 | 7.5 | 6.5 | 6.2 | 6.2 |
| 55 to 59 years | 7.6 | 7.3 | 7.2 | 7.2 | 7.0 | 6.9 |
| 60 to 64 years | 6.6 | 6.5 | 6.3 | 7.0 | 6.9 | 6.6 |
| 65 to 69 years | 5.7 | 5.8 | 5.5 | 6.0 | 6.1 | 5.8 |
| 70 to 74 years | 4.0 | 4.1 | 3.9 | 5.0 | 5.1 | 4.9 |
| 75 to 79 years | 2.8 | 2.9 | 2.9 | 3.4 | 3.4 | 3.3 |
| 80 to 84 years | 1.9 | 2.0 | 2.1 | 2.1 | 2.2 | 2.2 |
| 85 to 89 years | 1.1 | 1.1 | 1.3 | 1.2 | 1.2 | 1.4 |
| 90 to 94 years | 0.4 | 0.4 | 0.6 | 0.5 | 0.4 | 0.7 |
| 95 to 99 years | 0.1 | 0.1 | 0.2 | 0.1 | 0.1 | 0.2 |
| 100 years and older | 0.0 | 0.0 | 0.0 | 0.0 | 0.0 | 0.0 |
| Sources: Statistics Canada, 2016 long-form census questionnaire; 2015 T1 Family File; 2015 T1 Family File–Market Basket Measure; 2021 long-form census questionnaire; 2020 T1 Family File; and 2020 T1 Family File–Market Basket Measure. Custom tabulation. | ||||||
Since individuals at risk of entering or exiting poverty tend to have a family income in the lower half of the income distribution, we also examined the proportion of individuals by age group and income decile. Chart 2-1 and 2-2 show that, compared with the two censuses, the T1FF–MBM samples tended to have more children living in families with a family income in the lower income deciles. This could increase the number of children and young adults in poverty. As for seniors (aged 65 and older), the proportions of individuals in the first and second income deciles are smaller on the T1FF–MBM samples. This could lead to an underestimation of poverty rates for that population.

Data table for Chart 2-1
| T1FF-MBM | Census | |
|---|---|---|
| percent | ||
| Individuals aged younger than 18 years | ||
| 1 | 1.42 | 0.89 |
| 2 | 1.08 | 0.75 |
| 3 | 1.55 | 1.24 |
| 4 | 1.74 | 1.54 |
| 5 | 1.95 | 1.83 |
| Individuals aged 18 to 64 years | ||
| 1 | 4.72 | 4.41 |
| 2 | 3.21 | 3.13 |
| 3 | 3.91 | 4.09 |
| 4 | 4.40 | 4.75 |
| 5 | 5.10 | 5.55 |
| Individuals aged 65 years and older | ||
| 1 | 0.41 | 0.51 |
| 2 | 2.14 | 2.20 |
| 3 | 2.25 | 2.29 |
| 4 | 2.36 | 2.17 |
| 5 | 2.08 | 1.94 |
| Notes: T1FF = T1 Family File; and MBM = Market Basket Measure. | > >||
| Sources: Statistics Canada, 2016 long-form census questionnaires; and 2015 T1 Family File–Market Basket Measure. Custom tabulation. | ||

Data table for Chart 2-2
| T1FF-MBM | Census | |
|---|---|---|
| percent | ||
| Individuals aged younger than 18 years | ||
| 1 | 1.13 | 0.67 |
| 2 | 0.72 | 0.45 |
| 3 | 1.19 | 0.86 |
| 4 | 1.55 | 1.30 |
| 5 | 1.91 | 1.74 |
| Individuals aged 18 to 64 years | ||
| 1 | 4.31 | 3.93 |
| 2 | 2.76 | 2.78 |
| 3 | 3.76 | 3.73 |
| 4 | 4.15 | 4.42 |
| 5 | 4.84 | 5.27 |
| Individuals aged 65 years and older | ||
| 1 | 0.82 | 0.98 |
| 2 | 2.54 | 2.44 |
| 3 | 2.34 | 2.47 |
| 4 | 2.41 | 2.28 |
| 5 | 2.24 | 2.17 |
| Notes: T1FF = T1 Family File; and MBM = Market Basket Measure. | > >||
| Sources: Statistics Canada, 2021 long-form census questionnaires; and 2020 T1 Family File–Market Basket Measure. Custom tabulation. | ||
Given the results obtained from this preliminary analysis, we propose to apply a simple calibration model to the data to realign the T1FF–MBM samples to census totals. Two calibration groups were defined for this exercise:
- MBM region by age group (e.g., individuals aged younger than 18 years, individuals aged 18 to 64 years, and individuals aged 65 years and older) and family income status (e.g., below or above the MBM region’s before-tax income median)
- province by family structure (e.g., couples with children aged younger than 25 years, couples with children aged 25 years and older, couples with no children, person not in a family, single parents with children aged younger than 25 years, and single parents with children aged 25 years and older) and family income status.
For the analysis that follows, the non-calibrated and calibrated estimates will be shown.
Poverty rate estimates using the T1 Family File–Market Basket Measure (unofficial)
This section will examine unofficial poverty rate estimates produced with two T1FF–MBM samples and compare them with the poverty rates estimated using the CIS and the long-form census questionnaire for the same income year. Poverty status is determined by comparing the disposable income of a family with its MBM threshold, after considering family and regional differences.Note A person or family is considered to live in poverty if their family disposable income is lower than their applicable MBM threshold.
Chart 3 shows that the T1FF–MBM data tend to yield higher poverty rate estimates for people aged younger than 65 years in both reference years (2015 and 2020), and that the overestimation is larger for people aged younger than 18 years. These results are in line with the age distribution differences previously observed in charts 1, 2-1 and 2-2.

Data table for Chart 3
| CIS | T1FF-MBM | T1FF-MBM (cal) | Census | |
|---|---|---|---|---|
| percent | ||||
| Individuals aged younger than 18 years | ||||
| 2015 | 19.89 | 30.23 | 27.47 | 20.79 |
| 2020 | 8.09 | 19.94 | 16.81 | 10.66 |
| Individuals aged 18 to 64 years | ||||
| 2015 | 18.93 | 20.62 | 20.07 | 16.64 |
| 2020 | 10.76 | 15.35 | 14.30 | 10.31 |
| Individuals aged 65 years and older | ||||
| 2015 | 15.35 | 11.73 | 12.02 | 11.13 |
| 2020 | 9.92 | 8.11 | 8.11 | 6.74 |
|
Notes: CIS = Canadian Income Survey; T1FF = T1 Family File; and MBM = Market Basket Measure. All rates were produced at the census family level. Sources: Statistics Canada, Canadian Income Survey; long-form census questionnaire; and T1 Family File–Market Basket Measure. Custom tabulation. |
||||
Charts 4-1 and 4-2 show estimates by family structure for the 2015 and 2020 reference years, respectively. The T1FF–MBM samples tend to produce higher poverty rate estimates for couples with children and single parents with children aged younger than 25 years.Note Again, this is in line with the differences previously observed in Chart 2-1 and 2-2 (i.e., that the proportion of children living in families with a family income in the first two income deciles was larger in the T1FF–MBM samples).

Data table for Chart 4-1
| Derived family type | CIS | Census | T1FF-MBM | T1FF-MBM (calibrated) |
|---|---|---|---|---|
| percent | ||||
| Couple with children aged 25 years and older | 4.96 | 5.19 | 13.24 | 9.40 |
| Couple with children aged younger than 25 years | 10.86 | 12.04 | 18.96 | 15.62 |
| Couple with no children | 8.01 | 10.84 | 11.75 | 11.43 |
| Person not in a family | 14.83 | 13.10 | 29.86 | 31.65 |
| Single parents with children aged 25 years and older | 13.10 | 14.83 | 21.54 | 19.84 |
| Single parents with children aged younger than 25 years | 38.40 | 39.15 | 50.64 | 46.92 |
|
Notes: CIS = Canadian Income Survey; T1FF = T1 Family File; and MBM = Market Basket Measure. All rates were produced at the census family level. Sources: Statistics Canada, 2015 Canadian Income Survey; 2016 long-form census questionnaire; and 2015 T1 Family File–Market Basket Measure. Custom tabulation. |
||||

Data table for Chart 4-2
| Derived family type | CIS | Census | T1FF-MBM | T1FF-MBM (calibrated) |
|---|---|---|---|---|
| percent | ||||
| Couple with children aged 25 years and older | 1.65 | 2.31 | 11.09 | 6.45 |
| Couple with children aged younger than 25 years | 3.53 | 4.77 | 12.87 | 9.47 |
| Couple with no children | 6.51 | 4.82 | 10.29 | 9.69 |
| Person not in a family | 28.05 | 24.00 | 21.20 | 22.78 |
| Single parents with children aged 25 years and older | 7.04 | 6.67 | 18.86 | 16.06 |
| Single parents with children aged younger than 25 years | 19.62 | 20.48 | 30.30 | 27.64 |
|
Notes: CIS = Canadian Income Survey; T1FF = T1 Family File; and MBM = Market Basket Measure. All rates were produced at the census family level. Sources: Statistics Canada, 2015 Canadian Income Survey; 2016 long-form census questionnaire; and 2015 T1 Family File–Market Basket Measure. Custom tabulation. |
||||
In summary, the unofficial poverty rate estimates obtained from the T1FF–MBM samples differ from those produced using official sources for poverty indicators (i.e., the CIS and the census), for the two income years analyzed. The application of a calibration model to the T1FF–MBM data tends to attenuate such differences for most demographic groups examined; however, notable overestimation and underestimation are still apparent.
Poverty trends using the T1 Family File–Market Basket Measure (unofficial)
In this section, we examine poverty trends obtained using the annual T1FF–MBM samples and compare them with the trends obtained using the CIS and the long-form census questionnaire.
Although the previous section showed that poverty rate estimates produced using the T1FF–MBM samples differ from the rates obtained from official income sources for poverty indicators, the overall trends are similar. In general, the trends are also similar for most of the demographic groups examined.
Chart 5-1, 5-2 and 5-3 present trends for different age groups. The two CIS lines show the poverty rates estimated using the CIS, only differing by the family unit concept being used. The CIS (census family) line shows the rate based on census unit disposable income, while the CIS (economic family) line shows the official poverty rates based on economic unit disposable income. The census (census family) line corresponds to the poverty rates estimated using the long-form census questionnaire at the census family level. The T1FF–MBM line shows the trend obtained using the non-calibrated T1FF–MBM samples, while the T1FF–MBM (CY) square markers show the poverty rates obtained from the T1FF–MBM for CYs (e.g., with the creation of a new cohort), at which point the MBM characteristics from the census are updated. The T1FF–MBM (calibrated) lines and square markers show the trends obtained after calibrating the data to census totals.

Data table for Chart 5-1
| CIS (EF) | CIS (CF) | Census (CF) | T1FF-MBM | T1FF-MBM (CY) | T1FF-MBM (calibrated) | T1FF-MBM (CY) (calibrated) | |
|---|---|---|---|---|---|---|---|
| percent | |||||||
| Individuals aged younger than 18 years | |||||||
| 2015 | 16.26 | 19.89 | 20.79 | 30.23 | 30.23 | 27.47 | 27.47 |
| 2016 | 13.95 | 18.38 | 18.76 | 28.54 | Note ...: not applicable | 26.20 | Note ...: not applicable |
| 2017 | 11.73 | 16.28 | 16.74 | 26.87 | Note ...: not applicable | 23.00 | Note ...: not applicable |
| 2018 | 10.58 | 14.86 | 14.71 | 26.77 | Note ...: not applicable | 24.80 | Note ...: not applicable |
| 2019 | 9.38 | 14.46 | 12.69 | 27.23 | Note ...: not applicable | 24.83 | Note ...: not applicable |
| 2020 | 4.69 | 8.09 | 10.66 | 22.35 | 19.94 | 20.97 | 16.81 |
|
... not applicable Notes: CIS (EF) indicates that the data source is the CIS and the disposable income is calculated at the economic family level. CIS (CF) indicates that the data source is the CIS and the disposable income is calculated at the census family level. Census (CF) indicates that the data source is the long-form census questionnaire and the disposable income is calculated at the census family level. T1FF–MBM indicates that the data source is the uncalibrated T1FF–MBM and it was linked to the previous year's T1FF–MBM file. T1FF–MBM (CY) indicates that the data source is the uncalibrated T1FF–MBM and that the T1FF was linked to the long-form census questionnaire. When "calibrated" appears beside the T1FF–MBM, it means that the calibrated weights were used. Sources: Statistics Canada, Canadian Income Survey, long-form census questionnaire, T1 Family File–Market Basket Measure. Custom tabulation. |
|||||||

Data table for Chart 5-2
| CIS (EF) | CIS (CF) | Census (CF) | T1FF-MBM | T1FF-MBM (CY) | T1FF-MBM(calibrated) | T1FF-MBM (CY) (calibrated) | |
|---|---|---|---|---|---|---|---|
| percent | |||||||
| Individuals aged 18 to 64 years | |||||||
| 2015 | 15.70 | 18.93 | 16.64 | 20.62 | 20.62 | 20.07 | 20.07 |
| 2016 | 14.03 | 17.95 | 15.37 | 19.38 | Note ...: not applicable | 19.10 | Note ...: not applicable |
| 2017 | 13.45 | 17.22 | 14.11 | 18.46 | Note ...: not applicable | 17.02 | Note ...: not applicable |
| 2018 | 12.76 | 16.66 | 12.84 | 17.86 | Note ...: not applicable | 17.82 | Note ...: not applicable |
| 2019 | 11.83 | 15.59 | 11.58 | 17.89 | Note ...: not applicable | 17.77 | Note ...: not applicable |
| 2020 | 7.78 | 10.76 | 10.31 | 14.26 | 15.35 | 14.38 | 14.30 |
|
... not applicable Notes: CIS (EF) indicates that the data source is the CIS and the disposable income is calculated at the economic family level. CIS (CF) indicates that the data source is the CIS and the disposable income is calculated at the census family level. Census (CF) indicates that the data source is the long-form census questionnaire and the disposable income is calculated at the census family level. T1FF–MBM indicates that the data source is the uncalibrated T1FF–MBM and it was linked to the previous year's T1FF–MBM file. T1FF–MBM (CY) indicates that the data source is the uncalibrated T1FF–MBM and that the T1FF was linked to the long-form census questionnaire. When "calibrated" appears beside the T1FF–MBM, it means that the calibrated weights were used. Sources: Statistics Canada, Canadian Income Survey, long-form census questionnaire, T1 Family File–Market Basket Measure. Custom tabulation. |
|||||||

Data table for Chart 5-3
| CIS (EF) | CIS (CF) | Census (CF) | T1FF-MBM | T1FF-MBM (CY) | T1FF-MBM(calibrated) | T1FF-MBM (CY) (calibrated) | |
|---|---|---|---|---|---|---|---|
| percent | |||||||
| Individuals aged 65 years and older | |||||||
| 2015 | 7.14 | 15.35 | 11.13 | 11.73 | 11.73 | 12.02 | 12.02 |
| 2016 | 7.08 | 15.26 | 10.25 | 11.10 | Note ...: not applicable | 11.10 | Note ...: not applicable |
| 2017 | 6.13 | 12.84 | 9.37 | 10.32 | Note ...: not applicable | 9.73 | Note ...: not applicable |
| 2018 | 5.97 | 13.33 | 8.50 | 10.14 | Note ...: not applicable | 10.02 | Note ...: not applicable |
| 2019 | 5.75 | 13.21 | 7.62 | 10.22 | Note ...: not applicable | 10.26 | Note ...: not applicable |
| 2020 | 3.11 | 9.92 | 6.74 | 7.35 | 8.11 | 7.19 | 8.11 |
|
... not applicable Notes: CIS (EF) indicates that the data source is the CIS and the disposable income is calculated at the economic family level. CIS (CF) indicates that the data source is the CIS and the disposable income is calculated at the census family level. Census (CF) indicates that the data source is the long-form census questionnaire and the disposable income is calculated at the census family level. T1FF–MBM indicates that the data source is the uncalibrated T1FF–MBM and it was linked to the previous year's T1FF–MBM file. T1FF–MBM (CY) indicates that the data source is the uncalibrated T1FF–MBM and that the T1FF was linked to the long-form census questionnaire. When "calibrated" appears beside the T1FF–MBM, it means that the calibrated weights were used. Sources: Statistics Canada, Canadian Income Survey, long-form census questionnaire, T1 Family File–Market Basket Measure. Custom tabulation. |
|||||||
These results reflect, again, the impact of the larger proportion of individuals aged younger than 18 years in lower-income deciles within the T1FF–MBM samples compared with the other two sources, since the T1FF–MBM lines are further away from the CIS and the census lines for this age group. However, it should be noted that the T1FF–MBM samples would produce similar trends over time to the ones obtained using the CIS and the census.
The difference between the square markers and the trend lines of the T1FF–MBM series for 2020 indicates the expected impact from introducing a new cohort on the overall poverty trend. For example, for the T1FF–MBM (calibrated) series for individuals aged younger than 18 years in 2020, the line shows an estimate slightly higher than 20%, while the square marker shows an estimate closer to 15%. This difference is mainly caused by the limitation of keeping 2016 Census variables constant within a cohort until a new census is used to generate a T1FF–MBM cohort.
Poverty entry and exit rates using the T1 Family File–Market Basket Measure (unofficial)
The annual T1FF–MBM could potentially be used to analyze patterns in poverty entry and exit rates, because every person with a SIN could be followed year after year. As with the other sections of this paper, the results presented below are preliminary and are meant to promote further analysis and discussion, since a final methodology has yet to be developed.
| 2015 | 2019 | |
|---|---|---|
| In poverty | Not in poverty | |
| In poverty | 10.1 | 7.6 |
| Not in poverty | 5.6 | 76.6 |
| Source: Statistics Canada, T1 Family File–Market Basket Measure. Custom tabulation. | ||
The T1FF–MBM samples could be used, for instance, to analyze poverty entry and exit rates for different demographic groups since every individual can be followed during the life of a cohort. Table 3 shows unofficial results on poverty entry and exit rates using the T1FF–MBM samples. It shows that 5.6% of individuals who were not in poverty in 2015 were in poverty in 2019. This is typically called the poverty entry rate. Similarly, among individuals who were in poverty in 2015, 7.6% were not in poverty in 2019. This is typically called the poverty exit rate.
Another potential use of the T1FF–MBM samples would be to examine how many times individuals enter or exit poverty over a specific period. Table 4 shows results from a preliminary analysis of the frequency of annual poverty transitions from 2015 to 2019. It was estimated, for instance, that 19.2% of the population transitioned at least once from one poverty status to another during this period, with an estimated average of 1.5 transitions. Again, the factors driving these estimates would require further study before a proper analysis can be performed.
| Number of transitions | Number of people | |
|---|---|---|
| number | percent | |
| 0 | 20,001,766 | 80.8 |
| 1 | 2,779,033 | 11.2 |
| 2 | 1,581,040 | 6.4 |
| 3 | 357,150 | 1.4 |
| 4 | 49,059 | 0.2 |
|
Note: The population includes everyone present in the T1 Family File–Market Basket Measure file from 2015 to 2019. Source: Statistics Canada, custom tabulation. |
||
Next steps
As indicated earlier, the construction of the annual T1FF–MBM sample requires key variables from the long-form census questionnaire, which are considered fixed in years following a CY (i.e., IYs) until a new cohort is generated (i.e., a new census is available). Since the MBM thresholds and TTA come from the long-form census questionnaire, the longer we are from the generation of the cohort, the higher the probability that a family may have moved to a different MBM region or have changed their type of housing tenure. Therefore, the thresholds and TTA that had been assigned to them may no longer apply. A first research item could focus on investigating the feasibility of deriving MBM regions directly from the T1FF, followed by an effort to appropriately account for housing tenure changes where they occur.
In addition, since the linkage between the T1FF and the long-form census questionnaire was made using the SIN as the linkage key, individuals with an unknown SIN on the T1FF could not be linked to the long-form census data. Even though these people (who are mostly children) were added to the T1FF–MBM file, they did not get their corresponding census information. A second research item could focus on potentially using the Dependant Identification Number of each dependant as a linkage key.
Finally, the use of different administrative databases could be investigated to further support the application of the MBM methodology (e.g., the address registry), and the use of a different administrative income source, like the Administrative Personal Income Masterfile (APIM),Note could be considered.
Conclusion
This discussion paper explored the feasibility of using the T1FF as a data source for estimating annual MBM poverty rates to allow for highly disaggregated and longitudinal analyses of poverty among the Canadian population. Preliminary results showed that cross-sectional poverty estimates produced using the T1FF–MBM samples are not comparable to official estimates produced using the CIS or the long-form census questionnaire. Nonetheless, poverty trends obtained from the T1FF–MBM samples seem to mirror trends calculated from official sources. Estimating MBM poverty rates using the T1FF–MBM could open the way for analyses on (1) poverty rates at more disaggregated geographical and population levels and (2) poverty entry and exit rates over time. Additional work is required to fully integrate the existing MBM methodology into the T1FF and to be able to produce robust poverty estimates (e.g., creating MBM regions from the T1FF data and identifying a source for missing housing tenure information). This paper also proposed additional research topics that could help improve the analytical potential of the T1FF–MBM file.
The fundamental purpose of this research paper series is to engage with the public and stakeholders. We encourage users to ask questions, provide feedback and make suggestions for future work. Those interested in contacting us are encouraged to send an email to statcan.market.basket.measure-mesure.du.panier.de.consommation.statcan@statcan.gc.ca.
Appendix A
Creation of the T1 Family File–Market Basket Measure samples
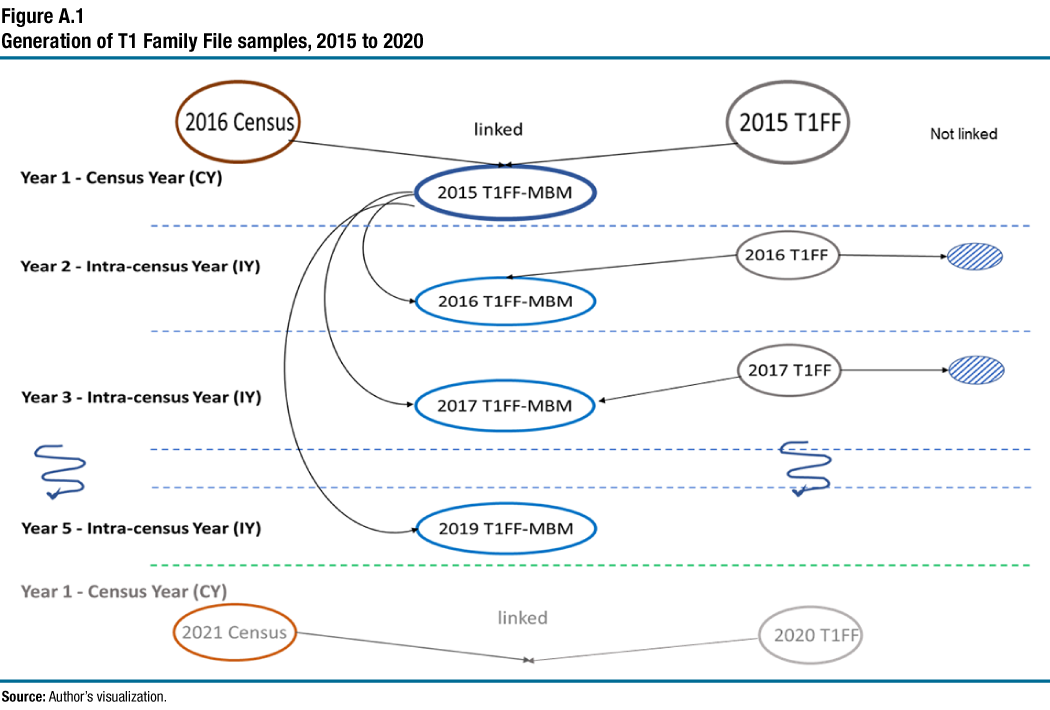
The T1 Family File–Market Basket Measure (T1FF–MBM) files used in this analysis are based on administrative tax files produced annually, the T1 Family File (T1FF). Because the T1FF was not created to support the Market Basket Measure (MBM), it is missing information on certain characteristics required to implement the MBM. We are proposing to use the Census of Population to provide these characteristics since it covers the entire Canadian population. As the census is updated every five years, characteristics from the census are assumed to be constant for the duration of a cohort. Figure A.1 describes how the T1FF–MBM samples are generated using the Census of Population and the annual T1FF files.
Figure A.1 Generation of T1 Family File samples, 2015 to 2020
Description for Figure A.1
The figure shows how the annual T1FF-MBM files are constructed. The figure is divided using dotted lines in six horizontal sections. The first section is labelled “Year 1 – Census Year (CY)”. In this section, the 2016 Census appears on the top left corner of the figure and the 2015 T1 Family File (T1FF) appears on the top right corner. Two arrows starting from each dataset points to a new dataset called 2015 T1FF-MBM. The label “linked” appears above the 2015 T1FF-MBM dataset indicating that the data correspond to the linked data between the 2016 Census and the 2015 T1FF. The label “Not linked” is displayed to the left of the 2015 T1FF dataset indicating that not all the data were linked.
The next section of the figure shows the “Year 2 – Intra-census Year (IY)” process. This section uses arrows to show that the previously created 2015 T1FF-MBM is linked to the 2016 T1FF to generate the 2016 T1FF-MBM dataset. Under the “Not linked” label, a strikethrough dataset is shown to the right of the 2016 dataset indicating that not all the data were linked.
The figure continues by showing the “Year 3 – Intra-census Year (IY)” process. This process is similar to the previous one. Using arrows, it shows that the previously created 2015 T1FF-MBM is linked to the 2017 T1FF to generate the 2017 T1FF-MBM dataset. Under the “Not linked” label, a strikethrough dataset is shown to the right of the 2017 dataset indicating that not all the data were linked.
After the “Year 3 – Intra-census Year (IY)” process, two squiggly lines pointing down towards the next section appear to the left and the right of the picture insinuating that the processes described previously continue in the same manner.
Then the figure continues by showing the “Year 5 – Intra-census Year (IY)” process. This process is similar to the previous one. It uses arrows to show that the previously created 2015 T1FF-MBM is linked to the 2019 T1FF to generate the 2019 T1FF-MBM dataset. Until now, all the colours used on the figure were bold.
The last section, at the bottom of the figure and in lighter colours, shows the start of a new cycle. The process is labelled “Year 1 – Census Year (CY)”. It shows the 2021 Census data to the left and the 2020 T1FF to the right. Two arrows are shown starting from each dataset and pointing lower. The arrows are labelled “linked” and insinuate that a new 2020 T1FF-MBM file would be created.
Source: Author's visuallization.
The initial T1FF–MBM sample corresponds to all living individuals present in the 2015 T1FF who are linked to the 2016 long-form Census of Population questionnaire data, because they share the same income year. Then, the census weight will be used as the initial survey weight. In situations where a spouse died during the reference year, the combined income of the two spouses (living and deceased) is used to calculate the family income. In 2020, this affected 102,680 individuals (0.6% of all Canadian families). Then, everyone with an unknown Social Insurance Number (SIN) on the T1FF and at least one family member linked to the long-form census questionnaire data is added to the T1FF–MBM file.
Once the T1FF has been linked to the long-form census questionnaire, each person gets a census family indicator. Because the T1FF family unit is built using information provided in multiple input files, such as information provided on the tax return (e.g., spousal SIN) and information on the child tax benefit file, combined with the geographic linkage based on addresses, it is possible that family members on the T1FF have different census family indicators.
When a T1FF family is linked to more than one census family, the characteristics of the closest census family in terms of size and presence of children, geography and total income are assigned to the T1FF family. These characteristics are the MBM region, tenure type, presence of a mortgage and subsidy indicator. The proportion of T1FF MBM families that were linked to multiple census families and for which a unique census family was chosen is around 2.5% for both 2015 and 2020.
The T1FF family is used to derive the age of the major income earner, along with all family-level income variables. Note that when more than one income earner has the same total income, the age of the oldest person is used. Furthermore, a new family composition variable is derived from the variable found on the T1FF. The new variable classifies families in four categories: individuals living alone, couples with children aged younger than 25 years, couples without children and single parents.
Every subsequent year, a new T1FF becomes available. The T1FF–MBM sample of that year would only include the individuals present in the T1FF–MBM file of the census year used when generating the cohort and their relatives with an unknown SIN. Because the family structure may have changed, the major income earner of each family is updated annually, and the disposable income of the family is recalculated.
Appendix B
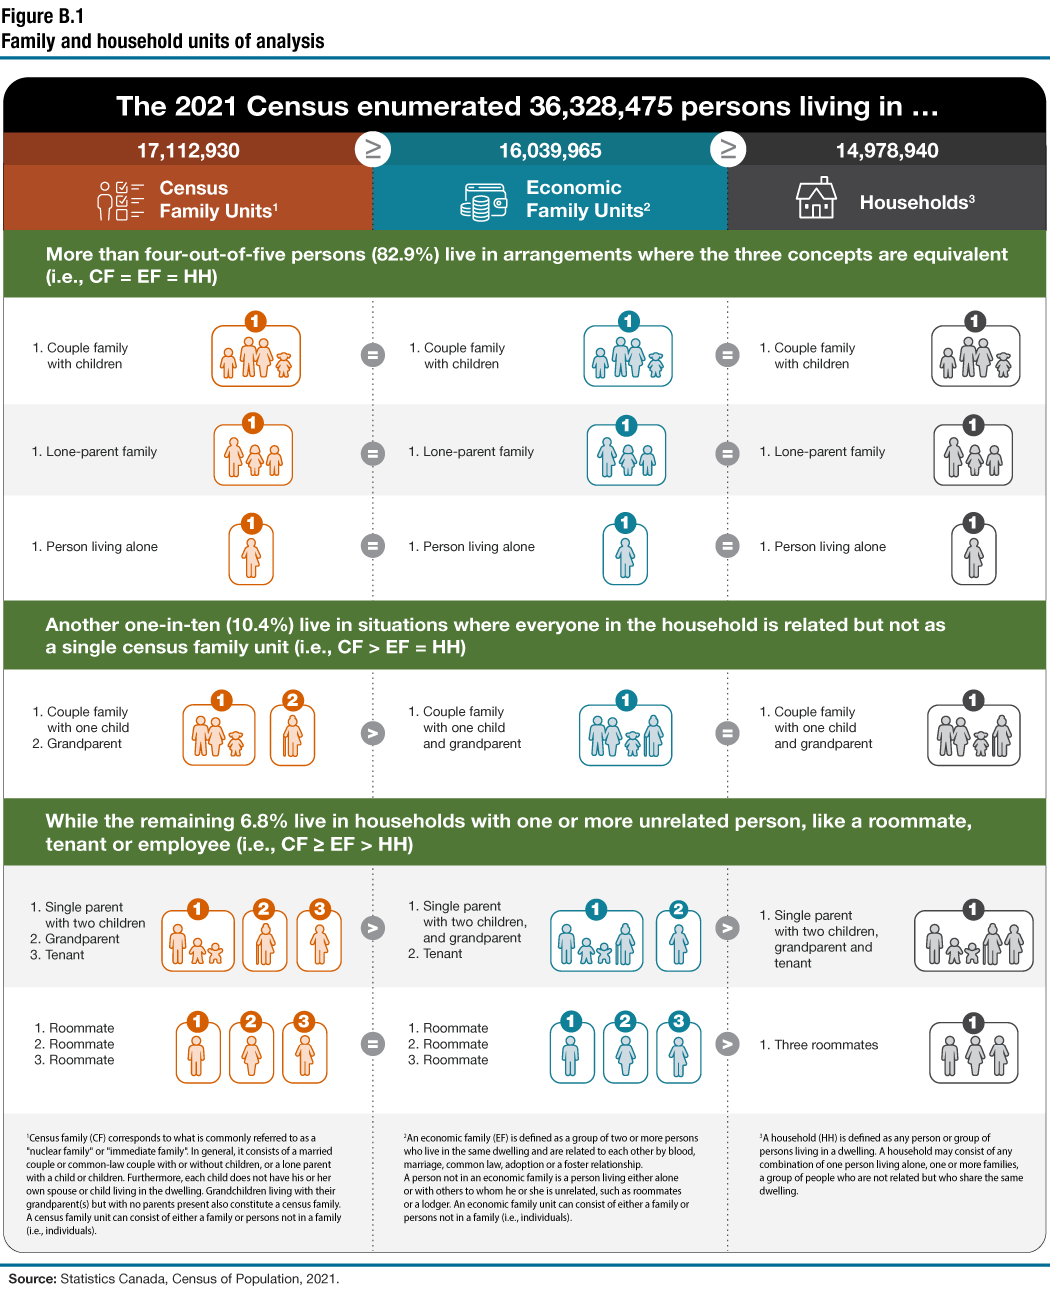
Figure B.1 Family and household units of analysis
Description for Figure B.1
The figure describes through examples three units of analysis: the census family, the economic family, and the household. It is titled “Family and household units of analysis.” The picture is divided into four horizontal sections and each section is further divided into three columns. The first section is titled “The 2021 Census enumerated 36,328,475 persons living in …” and it gives Canada level counts for the three units of analysis. The first column indicates that there are 17,112,930 census family units in Canada. The middle column indicates that there are 16,039,965 economic family units in Canada. The third column indicates that there are 14,978,940 households in Canada. In this case the number of census families is greater than or equal to the number of economic families which is greater than or equal to the number of households.
The second section says that more than four-out-of-five persons (82.9%) live in arrangements where the three concepts are equivalent. These persons live in units where the census family is equal to the economic family which also is also equal to the household. It gives three examples. The first example shows a couple with two children. The second example shows a lone parent family composed of one adult and two children. The third example shows a person living alone.
The third section of the picture says that another one-in-ten (10.4%) persons live in situations where everyone in the household is related but not as a single census family. In this situation the number of census family units is larger than or equal to the number of economic family units which is larger than the number of household units. In the first column, the example shows two census families. The first one is a couple with one child and the second is a grandparent. In the second column, the two census families are grouped to form one economic family. In the third column, it is shown that the economic family is the same as the household. For this example, the number of census families is larger than the number of economic families, which is equal to the number of households.
The fourth and final section of the picture says that the remaining 6.8% of persons live in households with one or more unrelated persons, like a roommate, tenant, or employee. In this case the persons are grouped in units where the number of census families is greater than or equal to the number of economic families which in turn is greater than the number of households. It presents two examples. The first example shows three different census families in the first column. The first one is a single parent with two children. The second one is one grandparent and the third one is a tenant. These three census families form two economic families shown in the middle column. The first one is composed of a couple and two children plus the grandparent. The second one is composed of the tenant. In the third column, the two economic families are grouped to form a single household. For this example, the number of census families is larger than the number of economic families which in turn is larger than the number of households. The second example shows three census families composed of a single roommate each. These three units then form three economic families which is shown in the middle column, and finally these three economic families form one single household. In this example the number of census families equal the number of economic families, which in turn is larger than the number of households.
Three notes appear at the bottom of the figure and give the detailed definition of the three concepts. Note 1 says that a Census family (CF) corresponds to what is commonly referred to as a "nuclear family" or "immediate family." In general, it consists of a married couple or common-law couple with or without children, or a lone parent with a child or children. Furthermore, each child does not have his or her own spouse or child living in the dwelling. Grandchildren living with their grandparent(s) but with no parents present also constitute a census family. A census family unit can consist of either a family or persons not in a family (i.e., individuals). Note 2 says that an economic family (EF) is defined as a group of two or more persons who live in the same dwelling and are related to each other by blood, marriage, common law, adoption or a foster relationship. A person not in an economic family is a person living either alone or with others to whom he or she is unrelated, such as roommates or a lodger. An economic family unit can consist of either a family or persons not in a family (i.e., individuals). Note 3 says that a household (HH) is defined as any person or group of persons living in a dwelling. A household may consist of any combination of one person living alone, one or more families, or a group of people who are not related but who share the same dwelling.
Source: Statistics Canada, Census of Population, 2021.
Appendix C
| Research topic | Short description |
|---|---|
| Child care expenses | Currently, child care costs are represented in the Market Basket Measure (MBM) as a direct deduction from disposable income. This way, a family’s needs are compared with an income measure that reflects their available resources. Experts have asked Statistics Canada if this is the best way to deal with child care expenses in the MBM. Could child care costs instead be treated as a separate basket item? |
| Remoteness - Delineating Remote Regions for the Market Basket Measure | Statistics Canada will research whether adjustments should be made to the Market Basket Measure to account for higher costs faced by families living in remote regions and communities to derive (for example) better estimates for the northern parts of provinces. |
| Remoteness - Market Basket Measure thresholds for remote regions | |
| Different family types | Currently, Statistics Canada estimates Market Basket Measure thresholds for a family of four, and then uses the square root equivalization scale to derive thresholds for families of different sizes. Does this method lead to the best possible thresholds for smaller families and unattached individuals? Additional study could also be conducted on whether it may be appropriate to construct separate basket values for families of the same size but with different compositions (e.g., one-parent family with three children versus a couple with two children) or other characteristics (e.g., age of family members). |
| Equivalization analysis | |
| Communications technology | Statistics Canada will look at how a separate communications component could best be added to the Market Basket Measure. Presently, the need for communication goods and services is reflected in the “other” component. |
| The other component | The “other necessities” component is meant to represent the costs of goods and services other than food, shelter, transportation and clothing. The list of items that could potentially be included in the “other” component is large and could vary depending on the structure, age, location or other circumstances of a family. Ongoing research on the methodology underpinning the other component could verify whether the current method for setting the value of the other component is adequate or must be improved. |
| Poverty Index | Anchoring the Market Basket Measure (MBM) to specific base years, yet updating it regularly to reflect changes in the standards of living to ensure it remains relevant, is an underlying strength of the MBM. However, periodically rebasing the MBM leads to the creation of various poverty lines that can make it difficult to track poverty trends over longer periods. To improve transparency and help track poverty trends over longer periods, the implementation of a poverty reduction index will be considered. |
| Inverse correlation of shelter and transportation costs | Often, people in areas where shelter costs are relatively higher have transportation costs that are relatively lower and vice versa. For instance, people in rural areas typically pay lower rents or mortgages but must spend more on fuel and seldom access public transportation. We propose to explore whether the Market Basket Measure could be improved by more precisely considering these differences in costs. |
| Using the Market Basket Measure with administrative data | As the Market Basket Measure (MBM) currently exists, the MBM poverty rates can only be accurately calculated using a combination of survey and administrative data. We propose to explore the feasibility of applying MBM thresholds to only administrative data. |
| Additional income inequality indicators using the Market Basket Measure | Since the majority of the current analytical products based on the Market Basket Measure (MBM) do not describe the full income distribution, because they typically compare the MBM threshold with disposable income, they do not fully describe income inequality. Proposed additional inequality indicators will be presented, allowing income disparities among Canadians to be better identified. |
References
Djidel, Samir, Burton Gustajtis, Andrew Heisz, Keith Lam, Isabelle Marchand and Sarah McDermott (2020), Report on the second comprehensive review of the Market Basket Measure. Catalogue no. 75F0002M2020002.
Employment and Social Development Canada (2018), Opportunity for All – Canada’s First Poverty Reduction Strategy. Catalogue no. SSD-212-08-18E.
Wesley, Benjamin, Chanel Christophe, Nancy Devin, Sarah Maude Dion, Éric Dugas and Burton Gustajtis (2022), Market Basket Measure Research Paper: Poverty Index. Catalogue no. 75F0002M2022005.
- Date modified: