
Income Research Paper Series
Market Basket Measure Research Paper: Delineating Remote Regions for the Market Basket Measure
Skip to text
Text begins
The Market Basket Measure (MBM) establishes poverty thresholds based on the cost of a basket of food, clothing, shelter, transportation and other items for a family of four that reflects a modest, basic standard of living. A family with a disposable income below the appropriate MBM threshold for the size of the family and the region where they live is considered to be living in poverty.Note
During the consultations for the second comprehensive review of the MBM, as well as during the analysis leading to the creation of the 2018-base MBM, several MBM research items were identified as requiring further study. One of these items involved researching whether the MBM could be adjusted to better reflect the differential costs of living associated with residing in remote regions or communities.Note Statistics Canada and Employment and Social Development Canada (ESDC) have begun to investigate whether adjustments to the MBM methodology could be made to account for the costs associated with living in these regions. The purpose of this paper is to foster engagement with users by reporting on the progress of this research item and to propose a methodology for identifying remote regions across Canada’s provinces. The next phase of this research topic would propose adjustments to MBM thresholds to account for cost differences across remote communities and further evaluate whether there is a case for defining remote-region poverty thresholds for the MBM (See text box- Market Basket Measure thresholds for remote regions).
This discussion paper is the first-of-two and describes a proposed methodology for delineating remote regions for the MBM. It also provides an opportunity for the public and stakeholders to provide feedback and comments on the proposed methodology. A forthcoming second discussion paper will explore the feasibility of producing poverty thresholds for the identified remote regions.
Introduction
On August 21, 2018, the Government of Canada released Opportunity for All, Canada’s First Poverty Reduction Strategy, which outlined long-term commitments to guide current and future government actions and investments to reduce poverty. The Poverty Reduction Act legislates key commitments made in the Strategy. In addition, the Poverty Reduction Act mandates Statistics Canada to review the content of the MBM “to ensure that it reflects the up-to-date cost of a basket of goods and services representing a modest, basic standard of living in Canada”.
As part of the second comprehensive review of the MBM, Statistics Canada, in collaboration with ESDC, held public consultations with Canadians, poverty experts, as well as federal, provincial, and territorial stakeholders to guide updates to the MBM.Note During consultations, the production of poverty thresholds for remote areas was identified as one topic that would require further study, in preparation for the 2023-base comprehensive review.
Physical remoteness from social and economic centres can play an important role in shaping a community’s socioeconomic opportunities and costs of living. Currently the MBM methodology applied in the provinces treats all rural communities within provinces equally for the purposes of determining MBM thresholds. Therefore, families that live in rural communities that are relatively accessible (e.g., Saint-Charles-sur-Richelieu, in Quebec) have the same poverty threshold as families that live in more isolated communities (e.g., Akulivik). The delineation of rural and remote communities would potentially allow for more robust poverty estimates.
This discussion paper describes the proposed methodology for delineating remote regions for the MBM with the future intent of using these areas to potentially construct MBM thresholds for remote communities. Readers are encouraged to provide feedback and comments.
An overview of the MBM geographical regions
The 53 provincial MBM regions for the 2018-base MBM are comprised of 19 specific communities, and 34 sub-provincial regions defined by population size, which include 10 rural areas. Over time, the number and configuration of the MBM regions may change. For example, population growth announced in the 2016 Census resulted in three new 2018-base MBM regions being added compared to the 2008-base MBM methodology. ReservesNote and the territoriesNote are presently excluded from the provincial MBM methodology.
The MBM regions corresponding to specific communities include St. John’s, Charlottetown, Halifax, Cape Breton, Fredericton, Moncton, Saint John, Québec, Montréal, Ottawa, Hamilton/Burlington, Toronto, Brandon, Winnipeg, Saskatoon, Regina, Edmonton, Calgary, and Vancouver.
Outside these communities, MBM regions in a province are created based on population size and density:
- Rural areas include communities with a population of less than 1,000 or with a population density less than 400 persons per square kilometer that are located outside Census metropolitan areas (CMAs) or Census agglomerations (CAs);Note Note
- Population under 30,000 (CAs below 30,000 and population centres below 10,000 persons);
- Population 30,000 to 99,999 (CAs with between 30,000 and 99,999 persons);
- Population 100,000 to 499,999 (CMAs between 100,000 and 499,999 persons), and;
- Population 500,000 and over (CMAs with 500,000 or more persons).
These urban and rural combinations result in the 53 MBM regions, which are currently used to apply 2018-base MBM thresholds in the provinces and estimate poverty rates in the provinces. The 2018-base MBM regions are illustrated in the Figure 1.Note
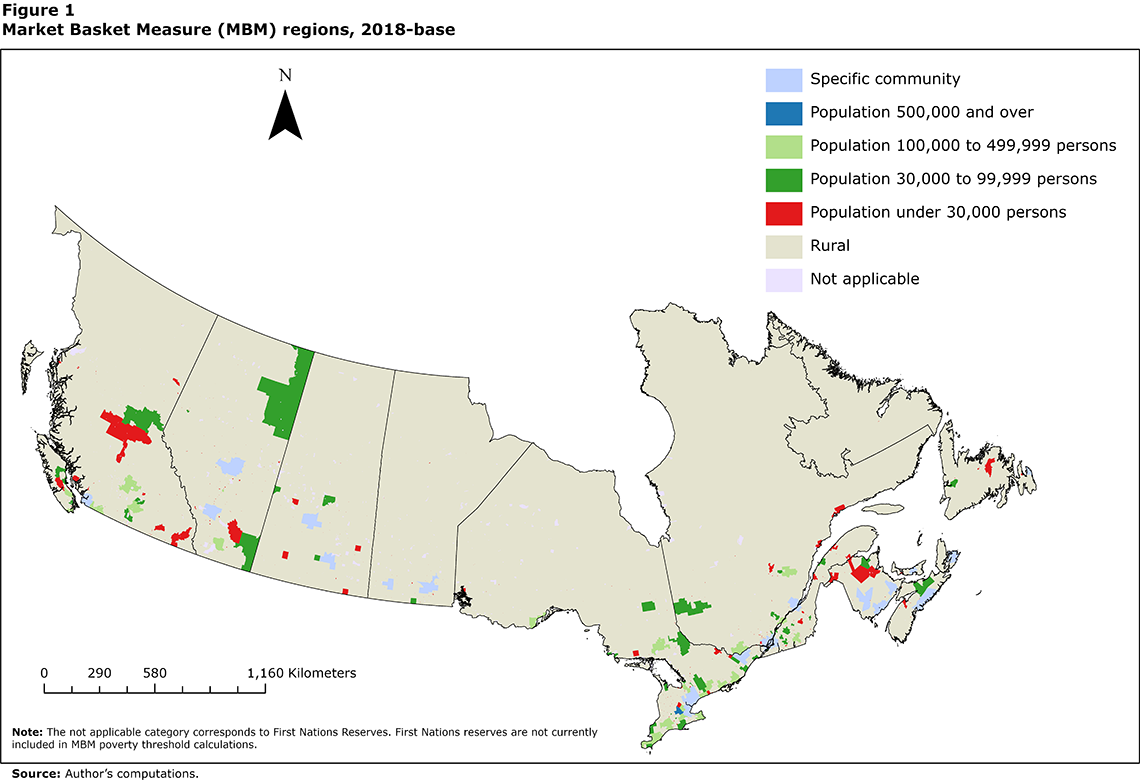
Description for Figure 1
There is a map of the provinces divided into 7 discrete categories. These categories represent the 6 types of MBM regions for the 2018-base MBM and one not applicable category. Each category has a unique color. The light blue, dark blue, light green, dark green, red, light brown, and light purple represent the MBM specific communities, population 500,000 and over, population 100,000 to 499,999 persons, population 30,000 to 99,999 persons, population under 30,000 persons, rural and the not applicable categories respectively.
Proposed methodology for identifying remote regions in the Market Basket Measure
It is proposed that remote areas would be based on the Index of Remoteness, an index developed by Statistics Canada to provide a better understanding of community access to goods, services, and economic opportunities.Note The 2016Note version of this index uses the 2016 Census population counts and geographical boundaries to derive the index. The index is calculated for every populated census subdivision (CSD) in Canada. CSD is the general term for municipalities or areas treated as municipal equivalents for statistical purposes.Note The remoteness index is itself a continuous measure that provides a relative indication of remoteness for each CSD on a scale varying from 0 to 1, with 0 being the most accessible and 1 the least accessible. To allow for more specificity when delineating remote areas, especially for unorganized territories or municipalities with a large geographic area, it is proposed that krigingNote be used to produce remoteness estimates at the Dissemination Area (DA)Note level. After using geospatial techniques and expert judgment, a DA with an index value that is greater than or equal to 0.53 was determined to be a ‘remote area’ for the purposes of the MBM. The proposed methodology for delineating remote areas is described in more detail in Appendix C.Note
The proposed methodology did not identify any remote areas in Nova Scotia or Prince Edward Island. Therefore, remote region poverty thresholds could possibly be created for the following provinces: Newfoundland and Labrador, New Brunswick, Quebec, Ontario, Manitoba, Saskatchewan, Alberta and British Columbia.
According to the proposed methodology, 0.51% of the provincial population would be living in remote regions across the provinces according to the 2016 Census (See Table 1). The provinces with the most people living in remote areas were Newfoundland and Labrador (n=47,869), Quebec (n=40,828) and Ontario (n=31,816), respectively. The provinces with the highest proportion of their population living within remote areas were Newfoundland and Labrador (9.26%), Manitoba (1.04%) and Saskatchewan (0.83%).
Start of text boxMarket Basket Measure thresholds for remote regions
Including remote regions in the MBM would lay the foundation for the creation of MBM thresholds for remote regions. In general, thresholds for a ‘remote’ basket of goods and services (i.e., shelter, transportation, food, clothing and other necessities) would be an adaptation of the existing MBM methodology, but with adjustments to the contents of the basket to better reflect life and conditions in remote regions. The methodology of estimating remote basket costs and preliminary poverty estimates will be addressed in a second discussion paper.
| Province | Dissemination Areas | Population | ||||
|---|---|---|---|---|---|---|
| Remote | MBM | % | Remote | MBM | % | |
| # | # | # | # | |||
| Newfoundland and Labrador | 162 | 1,068 | 15.17 | 47,869 | 516,801 | 9.26 |
| Prince Edward Island | 0 | 290 | 0.00 | 0 | 142,311 | 0.00 |
| Nova Scotia | 0 | 1,615 | 0.00 | 0 | 913,543 | 0.00 |
| New Brunswick | 1 | 1,420 | 0.07 | 145 | 738,938 | 0.02 |
| Quebec | 150 | 13,534 | 1.11 | 40,828 | 8,120,215 | 0.50 |
| Ontario | 90 | 19,878 | 0.45 | 31,816 | 13,390,208 | 0.24 |
| Manitoba | 37 | 2,030 | 1.82 | 12,571 | 1,213,110 | 1.04 |
| Saskatchewan | 44 | 2,164 | 2.03 | 8,648 | 1,042,240 | 0.83 |
| Alberta | 31 | 5,657 | 0.55 | 16,705 | 4,014,035 | 0.42 |
| British Columbia | 72 | 7,068 | 1.02 | 18,307 | 4,565,142 | 0.40 |
| All provinces | 587 | 54,724 | 1.07 | 176,889 | 34,656,543 | 0.51 |
| Source: Author’s computations | ||||||
The proposed methodology would result in the reclassification of not only rural communities, but also some smaller communities with a population under 30,000. Overall, there would be 25 small population centres that would be reclassified into remote areas, mainly located in Ontario and Quebec. The names and 2016 Census population counts for these population centres are included in Appendix E. Figure 2 provides an illustration of the remote regions.

Description for Figure 2
There is a map of the provinces divided into 8 discrete categories. These categories represent the 6 types of MBM regions for the 2018-base MBM, remote regions, and one not applicable category. Each category has a unique color. The light blue, dark blue, light green, dark green, red, light brown, pink, and light purple represent the MBM specific communities, population 500,000 and over, population 100,000 to 499,999 persons, population 30,000 to 99,999 persons, population under 30,000 persons, rural, remote, and the not applicable categories respectively.
Conclusion
This discussion paper is part of the research discussion paper series, that will help inform the next comprehensive review, scheduled to begin in 2023. The paper proposes a methodology for the creation of remote regions for the MBM methodology in the provinces. In addition, it lays the groundwork for the possible construction of poverty thresholds for remote regions, which will be discussed in a second discussion paper.
This paper series aims to foster engagement with the public and stakeholders, propose research topics that could help inform discussions for the next comprehensive review, improve the understanding of the MBM methodology and potentially expand analytical tools that involve or rely on the MBM. The proposed research discussion topics are intended to provide users with preliminary discussions on a wide variety of topics. We encourage users to ask questions, provide feedback and make suggestions for future work.
Persons interested in contacting us are encouraged to do so by sending an email to: statcan.market.basket.measure-mesure.du.panier.de.consommation.statcan@canada.ca.
Appendix A: Forward Looking Research Agenda Items
| Research topic | Short description |
|---|---|
| Childcare expenses | Currently, childcare costs are represented in the MBM as a direct deduction from disposable income. This way, a family’s needs are compared to an income measure that reflects their available resources. Experts have asked Statistics Canada if this is the best way to deal with childcare expenses in the MBM. Could childcare costs instead be treated as a separate basket item? |
| Remoteness | Statistics Canada will research whether adjustments should be made to the MBM to account for – higher costs faced by families living in remote regions and communities to derive (for example) better estimates for the northern parts of provinces. |
| Different family types | Currently, Statistics Canada estimates MBM thresholds for a family of four, and then uses the square root equivalization scale to derive thresholds for families of different sizes. Does this method lead to the best possible thresholds for smaller families and unattached individuals? Additional studies could also be conducted on whether it might be appropriate to construct separate basket values for families of the same size but with different compositions (e.g., lone parent family with three children versus a couple with two children) or other characteristics (e.g., age of family members). |
| Equivalization analysis | |
| Communications technology | Statistics Canada will look at how a separate communications component could best be added to the MBM. Presently, this need for communication goods and services is reflected in the “other” component. |
| The other component | The “other necessities” component is meant to represent the costs of goods and services other than food, shelter, transportation and clothing. The list of items that could potentially be included in the other component is large and could vary depending on the structure, age, location or other circumstances of a family. Ongoing research on the methodology underpinning the other component could verify whether the current method for setting the value of the other component is adequate or needs to be improved. |
| Poverty index | Anchoring the MBM to specific base years, yet updating it regularly to reflect changes in the standards of living to ensure it remains relevant is an underlying strength of the MBM. However, periodically rebasing the MBM leads to the creation of various poverty lines which can make it difficult to track poverty trends over longer time periods. To improve transparency and to help track poverty trends over longer time periods, the implementation of a poverty reduction index will be considered. |
| Inverse correlation of shelter and transportation costs | Often, people in areas where shelter costs are relatively higher have transportation costs that are relatively lower, and vice versa. For instance, people in rural areas typically pay lower rents and/or mortgages but must spend more on fuel and seldom access public transportation. We propose to explore whether the MBM could be improved by more precisely taking into account these differences in costs. |
| Using the MBM with administrative data | As it currently exists, the MBM poverty rates can only be accurately calculated using a combination of survey and administrative data. We propose to explore the feasibility of applying MBM thresholds to only administrative data. |
| Additional MBM income inequality indicators | Since the majority of the current MBM-based analytical products do not describe the full income distribution, since they typically compare the MBM threshold to disposable income, they do not fully describe income inequality. Proposed additional inequality indicators will be presented, which will allow to better identify income disparities among Canadians. |
Appendix B: MBM Regions
List of 2018-base Market Basket Measure (MBM) regions
Newfoundland and Labrador
- Rural
- Population under 30,000 persons
- Population 30,000 to 99,999 persons
- St. John's
Prince Edward Island
- Rural
- Population under 30,000
- Charlottetown
Nova Scotia
- Rural
- Population under 30,000 persons
- Population 30,000 to 99,999 persons
- Halifax
- Cape Breton
New Brunswick
- Rural
- Population under 30,000 persons
- Population 30,000 to 99,999 persons
- Fredericton
- Saint John
- Moncton
Quebec
- Rural
- Population under 30,000 persons
- Population 30,000 to 99,999 persons
- Population 100,000 to 499,999 persons
- Québec
- Montréal
Ontario
- Rural
- Population under 30,000 persons
- Population 30,000 to 99,999 persons
- Population 100,000 to 499,999 persons
- Population 500,000 and over
- Ottawa
- Hamilton/Burlington
- Toronto
Manitoba
- Rural
- Population under 30,000 persons
- Population 30,000 to 99,999 persons
- Brandon
- Winnipeg
Saskatchewan
- Rural
- Population under 30,000 persons
- Population 30,000 to 99,999 persons
- Saskatoon
- Regina
Alberta
- Rural
- Population under 30,000 persons
- Population 30,000 to 99,999 persons
- Population 100,000 to 499,999 persons
- Edmonton
- Calgary
British Columbia
- Rural
- Population under 30,000 persons
- Population 30,000 to 99,999 persons
- Population 100,000 to 499,999 persons
- Vancouver
Appendix C: Proposed Methodology for Delineating Remote Regions
The remoteness index is a continuous measure that provides a relative indication of remoteness for each CSD with a population on a scale varying from 0 to 1, with 0 being the most accessible and 1 the least accessible. Remoteness index values were available for 5,125 census subdivisions out of 5,162 census subdivisions in Canada in 2016.
To allow for more specificity when delineating remote areas, especially for unorganized territories or other municipalities with a large geographic area, it is proposed that estimates of the remoteness index at the dissemination area level be calculated. This would allow for small communities located in the most northern parts of large CSDs to be included in remote areas. Empirical Bayesian kriging would be performed using census subdivision representative points and index values to create a continuous remoteness surface with a cell size of one kilometre. The representative points of dissemination areas would then be used to extract the values of remoteness from the continuous surface. DA remoteness index values would then be re-scaled to have a minimum of 0 and a maximum of 1. Chart C.1 shows the distribution of these values for all DAs in Canada.

Description for Chart C.1
| Remoteness Index range | number of dissemination areas (DAs) |
|---|---|
| 0.00 to 0.05 | 10,391 |
| 0.05 to 0.10 | 11,154 |
| 0.10 to 0.15 | 12,559 |
| 0.15 to 0.20 | 4,718 |
| 0.20 to 0.25 | 4,249 |
| 0.25 to 0.30 | 4,173 |
| 0.30 to 0.35 | 3,073 |
| 0.35 to 0.40 | 2,334 |
| 0.40 to 0.45 | 1,572 |
| 0.45 to 0.50 | 789 |
| 0.50 to 0.55 | 570 |
| 0.55 to 0.60 | 335 |
| 0.60 to 0.65 | 191 |
| 0.65 to 0.70 | 170 |
| 0.70 to 0.75 | 132 |
| 0.75 to 0.80 | 46 |
| 0.80 to 0.85 | 82 |
| 0.85 to 0.90 | 38 |
| 0.90 to 0.95 | 12 |
| 0.95 to 1.00 | 2 |
| Source: Author's computations. | |
It is proposed that the ‘remoteness’ threshold would be specified as greater than or equal to 0.53. To obtain this threshold, first each classification method outlined in Subedi et al. 2020Note was used to classify the remoteness values. The manual method was chosen, which resulted in the threshold being specified manually. While manually specifying the threshold, the number of DAs located within Metropolitan influence zonesNote was considered (Table C.1), as well as the location of DAs that remained in Strong Metropolitan influenced zones as the threshold increased (i.e., were the DAs that remained in these zones located in large CSDs at a significant distance from any CA).
There were remote DAs that were located within CAs in the original set of MBM regions. It is proposed that these DAs retain their original MBM region. Remote DAs that were in a strong metropolitan influenced zone and were neighbouring a CA would also remain in their current region.
| In a Census Agglomeration |
Strong metropolitan influenced zone |
Moderate metropolitan influenced zone |
Weak metropolitan influenced zone |
No metropolitan influenced zone |
|
|---|---|---|---|---|---|
| Number (0.50) | 15 | 25 | 239 | 348 | 280 |
| Number (0.51) | 15 | 22 | 189 | 299 | 261 |
| Difference | 0 | 3 | 50 | 49 | 19 |
| Percentage decrease | 0.0 | 12.0 | 20.9 | 14.1 | 6.8 |
| Number (0.51) | 15 | 22 | 189 | 299 | 261 |
| Number (0.52) | 14 | 20 | 164 | 229 | 241 |
| Difference | 1 | 2 | 25 | 70 | 20 |
| Percentage decrease | 6.7 | 9.1 | 13.2 | 23.4 | 7.7 |
| Number (0.52) | 14 | 20 | 164 | 229 | 241 |
| Number (0.53) | 12 | 18 | 151 | 187 | 233 |
| Difference | 2 | 2 | 13 | 42 | 8 |
| Percentage decrease | 14.3 | 10.0 | 7.9 | 18.3 | 3.3 |
| Source: Author’s computations | |||||
Table C.2 provides average and median remoteness values and population numbers for all MBM regions, remote regions, and other MBM regions (aggregation of all MBM regions that are not remote). The average and median number of people living in remote regions was lower than in other MBM regions, as expected.
| Remoteness Index | Population | |||
|---|---|---|---|---|
| Average (SE) | Median | Average (SE) | Median | |
| All MBM regions | 0.1573 (0.1271) | 0.1197 | 633.0 (541.8) | 523 |
| Remote regions | 0.6331 (0.0940) | 0.6055 | 301.3 (276.4) | 296 |
| Other MBM regions | 0.1521 (0.1173) | 0.1186 | 636.9 (542.8) | 524 |
|
Note: Other MBM regions includes all MBM regions (e.g., rural, population <30,000 persons, Population 30,000 to 99,999 persons etc.) that are not remote regions. It is not possible to compare the DA level remoteness values for remote regions to every MBM region individually, as some MBM regions are defined at the block level (i.e., rural, population <30,000 persons). Source: Author’s computations |
||||
Appendix D: Validation using the Proximity Measures database
For validation purposes, the Proximity Measures databaseNote was used to examine the accessibility of goods and services within remote MBM regions. Results from this analysis indicate that a lower proportion of the population residing in remote regions had access to services and amenities, when compared to the population living in other MBM regions. The population with access to a service or amenity is based on predefined specifications which vary depending on the service or amenity being evaluated. Chart D.1 compares the proportion of the population that has access to the services and amenities included in the Proximity Measures database in remote regions to the proportion of the population that has access in other MBM regions.
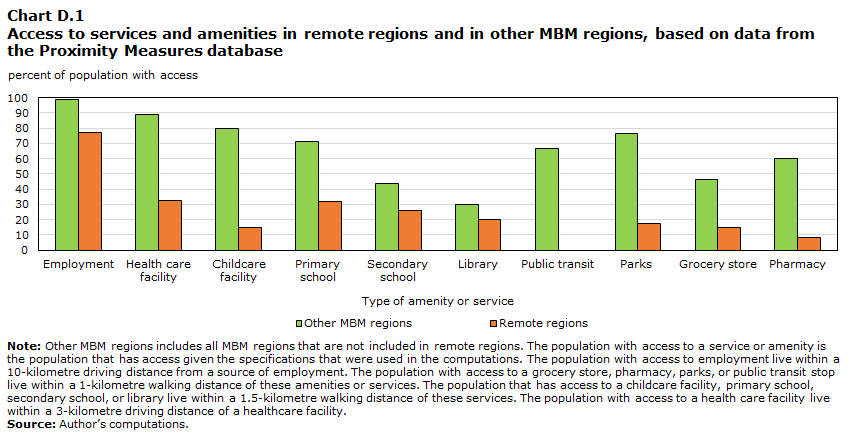
Description for Chart D.1
| Remote regions | Other MBM regions | |
|---|---|---|
| percent of population with access | ||
| Employment | 77.05 | 99.02 |
| Health care facility | 32.72 | 89.05 |
| Childcare facility | 14.90 | 79.55 |
| Primary school | 32.11 | 71.24 |
| Secondary school | 26.09 | 43.45 |
| Library | 20.12 | 30.27 |
| Public transit | 0.00 | 66.91 |
| Parks | 17.52 | 76.31 |
| Grocery store | 15.10 | 46.42 |
| Pharmacy | 8.24 | 60.08 |
|
Note: Other MBM regions includes all MBM regions that are not included in remote regions. The population with access to a service or amenity is the population that has access given the specifications that were used in the computations. The population with access to employment live within a 10-kilometre driving distance from a source of employment. The population with access to a grocery store, pharmacy, parks, or public transit stop live within a 1-kilometre walking distance of these amenities or services. The population that has access to a childcare facility, primary school, secondary school, or library live within a 1.5-kilometre walking distance of these services. The population with access to a health care facility live within a 3-kilometre driving distance of a healthcare facility. Source: Author’s computations. |
||
| Proximity Measure | Other MBM Regions | MBM Remote Regions | ||
|---|---|---|---|---|
| % of the population with access | 95% Confidence Intervals | % of the population with access | 95% Confidence Intervals | |
| Employment | 99.02 | 99.02-99.03 | 77.05 | 76.85-77.26 |
| Public transit | 66.91 | 66.89-66.92 | 0.00 | 0.00-0.00 |
| Pharmacy | 60.08 | 60.06-60.09 | 8.24 | 8.10-8.38 |
| Childcare facility | 79.55 | 79.54-79.56 | 14.90 | 14.73-15.08 |
| Primary school | 71.24 | 71.22-71.25 | 32.11 | 31.88-32.34 |
| Secondary school | 43.45 | 43.43-43.46 | 26.09 | 25.87-26.31 |
| Grocery store | 46.42 | 46.41-46.44 | 15.10 | 14.93-15.28 |
| Health care facility | 89.05 | 89.04-89.07 | 32.72 | 32.49-32.96 |
| Library | 30.27 | 30.25-30.28 | 20.12 | 19.93-20.32 |
| Parks | 76.31 | 76.30-76.32 | 17.52 | 17.33-17.71 |
|
Note: The population with access to a service or amenity have access given the specifications that were used in the computations. The population that has access to employment are living within a 10-kilometre driving distance from employment. The population that has access to a grocery store, pharmacy, parks, or public transit are living within a 1-kilometre walking distance. The population that has access to a childcare facility, primary school, secondary school, or library are living within a 1.5-kilometre walking distance. The population that has access to health care are living within a 3-kilometre driving distance. Other MBM regions include all geographies of the MBM that weren’t within remote areas. 0.2% of the population from other MBM regions and 10.05% of the population from remote regions were living in areas where index values were suppressed for all proximity measures. Index values were suppressed when there were inconsistencies between data sources. These calculations were performed with the data from areas where there was no suppression. Source: Author's computations |
||||
Appendix E: Population Centres reclassified as Remote Regions
| Province | Population Centre | Population |
|---|---|---|
| Newfoundland and Labrador | St. Anthony | 2,049 |
| Newfoundland and Labrador | Burgeo | 1,307 |
| Ontario | Wawa | 2,610 |
| Ontario | Atikokan | 1,944 |
| Ontario | Geraldton | 1,828 |
| Ontario | Factory Island | 1,807 |
| Ontario | Manitouwadge | 1,708 |
| Ontario | Longlac | 1,434 |
| Ontario | Moosonee | 1,405 |
| Ontario | Red Lake | 1,177 |
| Ontario | Chapleau | 1,170 |
| Ontario | Golden | 1,154 |
| Quebec | Cap-aux-Meules | 2,028 |
| Quebec | Matagami | 1,396 |
| Quebec | Kuujjuaq | 1,353 |
| Quebec | Inukjuak | 1,312 |
| Quebec | Salluit | 1,075 |
| Quebec | Rivière-au-Renard | 1,074 |
| Quebec | Puvirnituq | 1,038 |
| Manitoba | Cross Lake 19A | 2,018 |
| Manitoba | Moose Lake | 1,225 |
| Manitoba | Gillam | 1,036 |
| Saskatchewan | Pelican Narrows | 1,942 |
| Saskatchewan | Stanley 157 | 1,545 |
| Alberta | La Crète | 1,860 |
|
Note: First Nations reserves are not currently included in MBM poverty threshold calculations. For population centres located partially within a First Nations reserve, the population centre was included in this list if at least one remote block from the population centre was located outside of a First Nations reserve. Source: Author's computations |
||
References
Alasia Alessandro, Bédard Frédéric, Bélanger Julie, Guimond Eric, and Penney Christopher (2017), “Measuring remoteness and accessibility - A set of indices for Canadian communities”. Catalogue no. 18-001-X.
Alasia Alessandro, Newstead Nick, Kuchar Joseph, and Radulescu Marian (2021), “Measuring proximity to services and amenities: An experimental set of indicators for neighbourhoods and localities”. Catalogue no. 18-001-X
Devin, Nancy, Gustajtis Burton, Lam Keith, and McDermott Sarah (2021), “Construction of a Northern Market Basket Measure of poverty for Yukon and the Northwest Territories”. Catalogue no. 75F0002M.
Djidel, Samir, Gustajtis Burton, Heisz Andrew, Marchand Isabelle, McDermott Sarah (2020), “Report on the second comprehensive review of the Market Basket Measure”. Catalogue no. 75F0002M2020002.
Djidel, Samir, Gustajtis Burton, Heisz Andrew, Lam Keith, and McDermott Sarah (2019a), “Towards an update of the Market Basket”. Catalogue no.75F0002M2019013.
Djidel, Samir, Gustajtis Burton, Heisz Andrew, Lam Keith, and McDermott Sarah (2019b), “Defining disposable income in the Market Basket Measure”. Catalogue no. 75F0002M2019014.
Employment and Social Development Canada (2018), “Opportunity for All – Canada’s First Poverty Reduction Strategy”. Catalogue. No. SSD-212-08-18E.
Gustajtis, Burton, Lam Keith, and McDermott Sarah (2021), “Proposals for a Northern Market Basket Measure and its disposable income”. Catalogue no. 75F0002M2021001.
Hatfield, Michael, Pyper Wendy, and Gustajtis Burton (2010), “First Comprehensive Review of the Market Basket Measure of Low Income”. Applied Research Branch paper, Human Resources and Skills Development Canada.
Heisz, Andrew (2019), “An update on the Market Basket Measure comprehensive review”. Catalogue no.75F0002M2019009.
Subedi, Rajendra, Roshanafshar Shirin, and Greenberg T. Lawson (2020). "Developing meaningful categories for distinguishing levels of remoteness in Canada". Catalogue no. 11-633-X.
- Date modified: