
Income Research Paper Series
Market Basket Measure Research Paper: Poverty Index
by Wesley Benjamin, Chanel Christophe, Nancy Devin, Sarah Maude Dion, Éric Dugas and Burton Gustajtis
Skip to text
Text begins
The Market Basket Measure (MBM) establishes poverty thresholds based on the cost of a basket of food, clothing, shelter, transportation and other items for a family of four that reflects a modest, basic standard of living. A family with a disposable income below the appropriate MBM threshold for the size of the family and the region where they live is considered to be living in poverty.Note

The contents (i.e., quality) of the basket are held constant for a base year (e.g., the 2018-base), until a comprehensive review is undertaken and the contents of the basket are updated to latest standards set forth by experts, and a new base is introduced.Note Given there is a qualitative change between baskets, there can be a break in poverty rate series based on two different bases, which means a method must be developed to determine longer-term time series trends.
This discussion paper describes considerations for the creation of an index based on the poverty rates produced using multiple MBM bases resulting from periodic reviews of the MBM. It also provides an opportunity for the public and stakeholders to provide feedback and comments on the proposed poverty index.
Introduction
During consultations for the MBM’s second comprehensive review, as well as during the analysis leading to the creation of the 2018-base MBM, several MBM research items were identified as requiring further study (e.g., remoteness, different family sizes, a poverty index, etc.).Note These research items and their related methodological underpinnings, which form the basis for the MBM’s forward-looking research agenda, will be explored one-by-one in detail. These analyses will be published in preparation for the next MBM comprehensive review and resulting rebasing exercise, scheduled to begin in 2023.
The topic discussed in this paper is on the potential creation of a poverty index that will allow for longer trend analysis of poverty rates across multiple rebasings of the MBM basket.
Rationale
Periodically, Statistics Canada and Employment and Social Development Canada (ESDC) conduct a comprehensive reviewNote of the MBM to ensure that the costs of its basket of goods and servicesNote continue to reflect a modest, basic standard of living. These reviews also aim to ensure that the disposable incomeNote available to families to purchase the basket is appropriately defined and measured.
The Poverty Reduction Act indicated that the MBM “is to be reviewed, on a regular basis as determined by Statistics Canada, to ensure that it reflects the up-to-date cost of a basket of goods and services representing a modest, basic standard of living in Canada” (see text box The Poverty Reduction Act). Updates or “rebasings” of the measure are conducted following a comprehensive review and, where necessary, methodological changes are also made. At these times, the basket contents can also be adjusted to reflect contemporary circumstances and the latest standards available. For example, during the 2018-base update, the methodology used for the shelter component was updated to reflect more precisely the National Occupancy standard for the established reference family
The Poverty Reduction Act
In 2018, the Government of Canada released Opportunity for All, Canada’s First Poverty Reduction Strategy. The Poverty Reduction Act received Royal Assent in June 2019 and enshrined commitments made in the Strategy into law, including: (1) Establishing the MBM as Canada’s Official Poverty Line (COPL); (2) Setting concrete poverty reduction targets; (3) The creation of a National Advisory Council on Poverty (NACP).
Anchoring the MBM to specific base years, yet updating it regularly to reflect changes in the standards of living to ensure it remains relevant, is an underlying strength of the measure. Since these updates typically result in a qualitative change to the basket, comparing yearly changes using two different bases is not recommended. However, periodically rebasing the MBM, which leads to the creation of various poverty lines, poses a challenge to tracking poverty trends over longer time periods because it creates breaks in the series which prevent direct comparison between periods where different MBM bases were used to measure poverty. For example, after the past two comprehensive reviews, poverty estimates based on the resulting new MBM threshold costs resulted in a “parallel shift” upwards in poverty rates, reflecting changes brought in to the MBM through the review exercise.
Chart 1 presents a hypothetical example showing this break in a poverty series using four bases. If rates calculated using the updated base in a chain-link year (2018, 2023 and 2028 on Chart 1) were compared to those calculated using a previous base, there could appear to be a large change in rates, but this would have nothing to do with changes to the actual incomes of Canadians and would mostly be the result of a change in quality of the basket. For example, if the 2018 Base 2 poverty rate of 12.0% was to be compared to the 2017 Base 1 rate of 11.7%, one could conclude wrongly that the income of Canadians decreased or that it is not keeping pace with the basket price increases.

Data table for Chart 1
| Year | Chain-link years | Base 1 | Base 2 | Base 3 | Base 4 |
|---|---|---|---|---|---|
| poverty rate (percent) | |||||
| 2015 | Note ...: not applicable | 14.5 | Note ...: not applicable | Note ...: not applicable | Note ...: not applicable |
| 2016 | Note ...: not applicable | 12.8 | Note ...: not applicable | Note ...: not applicable | Note ...: not applicable |
| 2017 | Note ...: not applicable | 11.7 | Note ...: not applicable | Note ...: not applicable | Note ...: not applicable |
| 2018 | 16 | 11.0 | 12.0 | Note ...: not applicable | Note ...: not applicable |
| 2019 | Note ...: not applicable | Note ...: not applicable | 11.6 | Note ...: not applicable | Note ...: not applicable |
| 2020 | Note ...: not applicable | Note ...: not applicable | 11.1 | Note ...: not applicable | Note ...: not applicable |
| 2021 | Note ...: not applicable | Note ...: not applicable | 10.9 | Note ...: not applicable | Note ...: not applicable |
| 2022 | Note ...: not applicable | Note ...: not applicable | 10.6 | Note ...: not applicable | Note ...: not applicable |
| 2023 | 16 | Note ...: not applicable | 10.4 | 11.2 | Note ...: not applicable |
| 2024 | Note ...: not applicable | Note ...: not applicable | Note ...: not applicable | 11.5 | Note ...: not applicable |
| 2025 | Note ...: not applicable | Note ...: not applicable | Note ...: not applicable | 11.7 | Note ...: not applicable |
| 2026 | Note ...: not applicable | Note ...: not applicable | Note ...: not applicable | 12.1 | Note ...: not applicable |
| 2027 | Note ...: not applicable | Note ...: not applicable | Note ...: not applicable | 12.9 | Note ...: not applicable |
| 2028 | 16 | Note ...: not applicable | Note ...: not applicable | 13.3 | 13.7 |
| 2029 | Note ...: not applicable | Note ...: not applicable | Note ...: not applicable | Note ...: not applicable | 12.4 |
| 2030 | Note ...: not applicable | Note ...: not applicable | Note ...: not applicable | Note ...: not applicable | 13.3 |
| 2031 | Note ...: not applicable | Note ...: not applicable | Note ...: not applicable | Note ...: not applicable | 11.6 |
| 2032 | Note ...: not applicable | Note ...: not applicable | Note ...: not applicable | Note ...: not applicable | 11.1 |
| 2033 | Note ...: not applicable | Note ...: not applicable | Note ...: not applicable | Note ...: not applicable | 10.1 |
|
... not applicable Source: Statistics Canada. Custom tabulation. |
|||||
In response to this challenge, the evaluation of creating a poverty index has been undertaken because an index could help track poverty trends over longer time periods and improve transparency when it comes to reporting changes in poverty rates over time.
The MBM Poverty Index (MBM-PI) is proposed as an easily understandable tool that will allow policymakers and analysts to track Canada’s overall poverty rate from base-to-base, providing a ‘smooth’ and unbroken series.
Analysis in brief
The proposed methodology for establishing a MBM-PI would set the value of the index at 100 for the year of interest. For our analysis, we selected 2015, the benchmark year for the poverty reduction targets established by the Poverty Reduction Act, to demonstrate the proposed methodology. Despite this choice to benchmark the MBM-PI to the 2015 year, it is important to note that it would be possible to benchmark the index to other years as well.
After setting the value of the index at 100 for 2015, the value for the index for subsequent years would be calculated by taking the ratio of the poverty rate between the current year and the previous year and multiplying it by the previous year’s index value (see Table 1).
| Single MBM base | |||
|---|---|---|---|
| Poverty Rate | MBM-PI | MBM-PI calculation | |
| Year | % | # | |
| 2015 | 14.5 | 100.0 | 100 |
| 2016 | 12.8 | 88.3 | (12.8/14.5)*100 |
| 2017 | 11.7 | 80.7 | (11.7/12.8)*88.3 |
| 2018 | 11.0 | 75.9 | (11.0/11.7)*80.7 |
| 2019 | 10.1 | 69.7 | (10.1/11.0)*75.9 |
| 2020 | 10.0 | 69.0 | (10.0/10.1)*69.7 |
| 2021 | 9.9 | 68.3 | (9.9/10.0)*69.0 |
| 2022 | 9.6 | 66.2 | (9.6/9.9)*68.3 |
| 2023 | 9.2 | 63.4 | (9.2/9.6)*66.2 |
| Source: Statistics Canada. Custom tabulation. | |||
One advantage of the MBM-PI is that the percentage change between any two periods’ indexes would result in the same percentage change had the poverty rates been used.
Presently, Statistics Canada is proposing to develop this index going back to 2012. Although efforts have been made by Statistics Canada to provide more years of poverty data for a given MBM base (e.g., back-casting the 2018-base series to reference year 2012), there are limitations in the available data and the robustness of the methodology preventing estimates being back-casted to earlier years. Especially when an earlier year contains multiple bases. In addition, there are expected limitations going forward caused by the feasibility of producing bases for extended periods of time. For example, when new Census geographical boundaries are introduced, maintaining the old geographical classifications for perpetuity is not practically feasible, nor methodologically sound.
Following the introduction of a new MBM base, the index would be calculated by taking the ratio as calculated using the newly introduced MBM base’s current year’s poverty rate and its previous year’s rate, and multiplying the ratio by the index level in the previous reference year (See Table 2).Note Another advantage of the MBM-PI would be to allow for a continuous series of indexes that tracks changes in poverty rates over time relative to the indexed reference period chosen, while allowing for the introduction of new MBM bases and alleviating potential issues with back-casting
| Poverty Rate | MBM-PI | MBM-PI calculation | ||||
|---|---|---|---|---|---|---|
| Base 1 | Base 2 | Base 3 | Base 4 | |||
| Year | % | # | ||||
| 2015 | 14.5 | Note ...: not applicable | Note ...: not applicable | Note ...: not applicable | 100.0 | 100 |
| 2016 | 12.8 | Note ...: not applicable | Note ...: not applicable | Note ...: not applicable | 88.3 | (12.8/14.5)*100 |
| 2017 | 11.7 | Note ...: not applicable | Note ...: not applicable | Note ...: not applicable | 80.7 | (11.7/12.8)*88.3 |
| 2018 | 11.0 | 12.0 | Note ...: not applicable | Note ...: not applicable | 75.9 | (11.0/11.7)*80.7 |
| 2019 | Note ...: not applicable | 11.6 | Note ...: not applicable | Note ...: not applicable | 73.4 | (11.6/12.0)*75.9 |
| 2020 | Note ...: not applicable | 11.1 | Note ...: not applicable | Note ...: not applicable | 70.2 | (11.1/11.6)*73.4 |
| 2021 | Note ...: not applicable | 10.9 | Note ...: not applicable | Note ...: not applicable | 68.9 | (10.9/11.1)*70.2 |
| 2022 | Note ...: not applicable | 10.6 | Note ...: not applicable | Note ...: not applicable | 67.0 | (10.6/10.9)*68.9 |
| 2023 | Note ...: not applicable | 10.4 | 11.2 | Note ...: not applicable | 65.7 | (10.4/10.6)*67.0 |
| 2024 | Note ...: not applicable | Note ...: not applicable | 11.5 | Note ...: not applicable | 67.5 | (11.5/11.2)*65.7 |
| 2025 | Note ...: not applicable | Note ...: not applicable | 11.7 | Note ...: not applicable | 68.7 | (11.7/11.5)*67.5 |
| 2026 | Note ...: not applicable | Note ...: not applicable | 12.1 | Note ...: not applicable | 71.0 | (12.1/11.7)*68.7 |
| 2027 | Note ...: not applicable | Note ...: not applicable | 12.9 | Note ...: not applicable | 75.7 | (12.9/12.1)*71.0 |
| 2028 | Note ...: not applicable | Note ...: not applicable | 13.3 | 13.7 | 78.0 | (13.3/12.9)*75.7 |
| 2029 | Note ...: not applicable | Note ...: not applicable | Note ...: not applicable | 12.4 | 70.6 | (12.4/13.7)*78.0 |
| 2030 | Note ...: not applicable | Note ...: not applicable | Note ...: not applicable | 13.3 | 75.7 | (13.3/12.4)*70.6 |
| 2031 | Note ...: not applicable | Note ...: not applicable | Note ...: not applicable | 11.6 | 66.0 | (11.6/13.3)*75.7 |
| 2032 | Note ...: not applicable | Note ...: not applicable | Note ...: not applicable | 11.1 | 63.2 | (11.1/11.6)*66.0 |
| 2033 | Note ...: not applicable | Note ...: not applicable | Note ...: not applicable | 10.1 | 57.5 | (10.1/11.1)*63.2 |
|
... not applicable Source: Statistics Canada. Custom tabulation. |
||||||
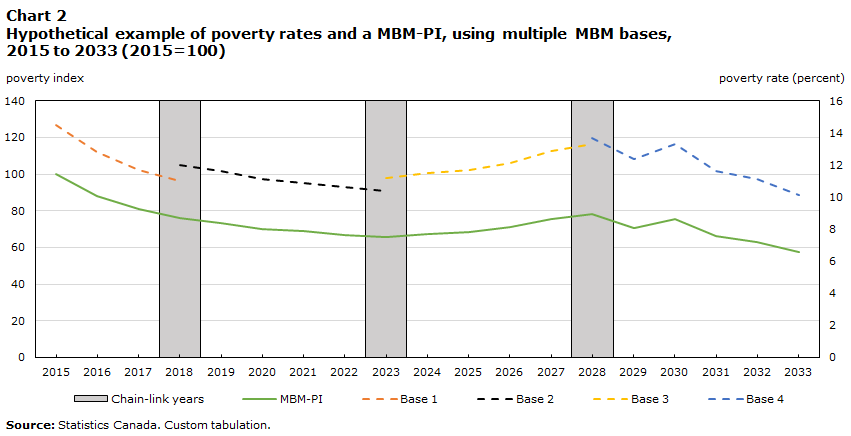
In the hypothetical example in Table 2, the index reference year is 2015 (2015=100), and the indexes are calculated using four bases. The MBM-PI column shows how poverty rates produced using multiple MBM bases could be used to track long-term poverty targets. The MBM-PI would, in effect, “chain” poverty rates from different MBM bases, using the preceding year’s poverty index value.
Although in our hypothetical example, we selected 2015 as the chain-link year, the decision of when to “chain in” the new base would ultimately be up to the needs of the user. For example, the poverty reduction targets established by the Government of Canada start in reference year 2015 and use the 2018-base methodology. Therefore, the construction of their poverty index would use the 2018-base until a new 2023-base would become available.
The resulting index has the benefit of maintaining the original annual poverty rate changes for each base. This ensures there is no unwanted impact on the interpretabilityNote of the incidences of poverty over time. For the poverty index in Chart 2, the “parallel shift” upwards seen previously has been removed, but the annual poverty rate changes have been maintained.
Data table for Chart 2
| Year | Chain-link years | Base 1 | Base 2 | Base 3 | Base 4 | MBM-PI |
|---|---|---|---|---|---|---|
| poverty index | poverty rate (percent) | poverty index | ||||
| 2015 | Note ...: not applicable | 14.5 | Note ...: not applicable | Note ...: not applicable | Note ...: not applicable | 100.0 |
| 2016 | Note ...: not applicable | 12.8 | Note ...: not applicable | Note ...: not applicable | Note ...: not applicable | 88.3 |
| 2017 | Note ...: not applicable | 11.7 | Note ...: not applicable | Note ...: not applicable | Note ...: not applicable | 80.7 |
| 2018 | 140 | 11.0 | 12.0 | Note ...: not applicable | Note ...: not applicable | 75.9 |
| 2019 | Note ...: not applicable | Note ...: not applicable | 11.6 | Note ...: not applicable | Note ...: not applicable | 73.4 |
| 2020 | Note ...: not applicable | Note ...: not applicable | 11.1 | Note ...: not applicable | Note ...: not applicable | 70.2 |
| 2021 | Note ...: not applicable | Note ...: not applicable | 10.9 | Note ...: not applicable | Note ...: not applicable | 68.9 |
| 2022 | Note ...: not applicable | Note ...: not applicable | 10.6 | Note ...: not applicable | Note ...: not applicable | 67.0 |
| 2023 | 140 | Note ...: not applicable | 10.4 | 11.2 | Note ...: not applicable | 65.7 |
| 2024 | Note ...: not applicable | Note ...: not applicable | Note ...: not applicable | 11.5 | Note ...: not applicable | 67.5 |
| 2025 | Note ...: not applicable | Note ...: not applicable | Note ...: not applicable | 11.7 | Note ...: not applicable | 68.7 |
| 2026 | Note ...: not applicable | Note ...: not applicable | Note ...: not applicable | 12.1 | Note ...: not applicable | 71.0 |
| 2027 | Note ...: not applicable | Note ...: not applicable | Note ...: not applicable | 12.9 | Note ...: not applicable | 75.7 |
| 2028 | 140 | Note ...: not applicable | Note ...: not applicable | 13.3 | 13.7 | 78.0 |
| 2029 | Note ...: not applicable | Note ...: not applicable | Note ...: not applicable | Note ...: not applicable | 12.4 | 70.6 |
| 2030 | Note ...: not applicable | Note ...: not applicable | Note ...: not applicable | Note ...: not applicable | 13.3 | 75.7 |
| 2031 | Note ...: not applicable | Note ...: not applicable | Note ...: not applicable | Note ...: not applicable | 11.6 | 66.0 |
| 2032 | Note ...: not applicable | Note ...: not applicable | Note ...: not applicable | Note ...: not applicable | 11.1 | 63.2 |
| 2033 | Note ...: not applicable | Note ...: not applicable | Note ...: not applicable | Note ...: not applicable | 10.1 | 57.5 |
|
... not applicable Source: Statistics Canada. Custom tabulation. |
||||||
Limitations
There are some limitations to consider when assessing the utility and analytical strengths and weaknesses of an index based on poverty rates. First, while the index works well for poverty rates produced for large domains (e.g., for families and unattached individuals at the Canada-wide level), it may not perform as well for highly disaggregated groups. This is because sampling variability may result in lower precision in the overlapping (chain) years, which weakens the accuracy of the “transition” from one base to the next in the index.Note
Also, there is the possibility that if the trend in poverty rates is downward for a long period of time that the index could appear very low, but the incidences of poverty using the current base could be much higher. For example, if there was a 25% increase in the poverty rate, but the previous year’s index was very low, for example 4.0, it would result in a new index of 5.0. Therefore, users could interpret a small movement in the index as a small change in poverty, when it could be substantial.
Finally, other indexes with their own advantages and disadvantages could be developed to inform on the trend of poverty rates. To open discussions, an additive index is presented in Appendix A.2.
Conclusion
This paper is part of the research discussion paper series, that will help inform the next comprehensive review, scheduled to begin in 2023. The proposed MBM-PI would be an analytical tool that would facilitate the analysis of trends in the poverty rate, across different MBM bases, according to an index reference year. In addition, the poverty index’s fluctuations would reflect actual fluctuations in the current poverty rates, thereby allowing analysts to report on longer trends in poverty rate estimates.
The intention of Statistics Canada and ESDC is to publish the poverty index on the Dimensions of Poverty Hub, with an index reference year of 2015=100. This will allow Canadians to monitor how the Government of Canada is progressing in achieving the poverty reduction targets established through the Poverty Reduction Act.
This paper series aims to foster engagement with the public and stakeholders, propose research topics that could help inform discussions for the next comprehensive review, improve the understanding of the MBM methodology and potentially expand analytical tools that involve or rely on the MBM. The proposed research discussion topics are intended to provide users with preliminary discussions on a wide variety of topics. We encourage users to ask questions, provide feedback and make suggestions for future work.
Following the release of this paper, there will be a period during which Statistics Canada and ESDC will engage experts, stakeholders, and federal, provincial and territorial officials to evaluate the responses and recommendations we receive. Users are welcome to ask questions or share their feedback. Persons interested in contacting us are encouraged to do so by sending an email to:
statcan.market.basket.measure-mesure.du.panier.de.consommation.statcan@statcan.gc.ca
Appendix A
A.1 Formula for MBM-PI
The MBM-PI can also be expressed in the following terms:
is the product of the indexes' sum of poverty rates for multiple MBM bases between period and , for a given index reference year of x =100.
is the poverty rate for a given base year , in time
is the poverty rate for a given base year , in time
is the product of the indexes for MBM base in period , for a given index reference year of x =100
For example, following the introduction of the 2028-base MBM, any chained-linked index with an index reference period of 2015=100 is chain of the previous two fixed MBM bases.
is a chained index for the poverty rate in period t with a reference period equal to 2015;
is an index for the poverty rate in period with 2029 as the poverty rate reference period, calculated using the 2028-base MBM;
is an index for 2028 with 2024 as the reference period, calculated using the 2023-base MBM;
is an index for 2015 with 2023 as the reference period, calculated using the 2023-base MBM.
A.2 Formula for an additive index
The additive index, which keeps the scale of the year to year change in its time series trend even when the index is small, can be expressed using the following formula.
is the index for multiple MBM bases at time
is the poverty rate for a given base year at time , i=1,…B where B is the number of bases.
is the index for multiple MBM bases in period , for a given index reference year of x. It is set to 100
A.3 Comparison between the MBM-PI series and the additive index series, using hypothetical data
Chart A.3 shows a hypothetical example of both a multiplicative series (i.e., MBM-PI) and an additive index series constructed using the hypothetical poverty rates found in Table 2, for reference years 2015 to 2033. The left vertical axis shows the indexes’ values, while the right vertical axis shows the poverty rates calculated over three rebasing periods. Both the MBM-PI and the additive index show a similar trend, but the MBM-PI series is smoother than the additive index series.

Data table for Chart A3
| Year | Chain-link years | Base 1 | Base 2 | Base 3 | Base 4 | MBM-PI | Additive index |
|---|---|---|---|---|---|---|---|
| poverty index | poverty rate (percent) | poverty index | |||||
| 2015 | Note ...: not applicable | 14.5 | Note ...: not applicable | Note ...: not applicable | Note ...: not applicable | 100.0 | 100.0 |
| 2016 | Note ...: not applicable | 12.8 | Note ...: not applicable | Note ...: not applicable | Note ...: not applicable | 88.3 | 88.3 |
| 2017 | Note ...: not applicable | 11.7 | Note ...: not applicable | Note ...: not applicable | Note ...: not applicable | 80.7 | 79.7 |
| 2018 | 140 | 11 | 12 | Note ...: not applicable | Note ...: not applicable | 75.9 | 73.7 |
| 2019 | Note ...: not applicable | Note ...: not applicable | 11.6 | Note ...: not applicable | Note ...: not applicable | 73.4 | 70.4 |
| 2020 | Note ...: not applicable | Note ...: not applicable | 11.1 | Note ...: not applicable | Note ...: not applicable | 70.2 | 66.1 |
| 2021 | Note ...: not applicable | Note ...: not applicable | 10.9 | Note ...: not applicable | Note ...: not applicable | 68.9 | 64.3 |
| 2022 | Note ...: not applicable | Note ...: not applicable | 10.6 | Note ...: not applicable | Note ...: not applicable | 67.0 | 61.5 |
| 2023 | 140 | Note ...: not applicable | 10.4 | 11.2 | Note ...: not applicable | 65.7 | 59.6 |
| 2024 | Note ...: not applicable | Note ...: not applicable | Note ...: not applicable | 11.5 | Note ...: not applicable | 67.5 | 62.3 |
| 2025 | Note ...: not applicable | Note ...: not applicable | Note ...: not applicable | 11.7 | Note ...: not applicable | 68.7 | 64.0 |
| 2026 | Note ...: not applicable | Note ...: not applicable | Note ...: not applicable | 12.1 | Note ...: not applicable | 71.0 | 67.5 |
| 2027 | Note ...: not applicable | Note ...: not applicable | Note ...: not applicable | 12.9 | Note ...: not applicable | 75.7 | 74.1 |
| 2028 | 140 | Note ...: not applicable | Note ...: not applicable | 13.3 | 13.7 | 78.0 | 77.2 |
| 2029 | Note ...: not applicable | Note ...: not applicable | Note ...: not applicable | Note ...: not applicable | 12.4 | 70.6 | 67.7 |
| 2030 | Note ...: not applicable | Note ...: not applicable | Note ...: not applicable | Note ...: not applicable | 13.3 | 75.7 | 74.9 |
| 2031 | Note ...: not applicable | Note ...: not applicable | Note ...: not applicable | Note ...: not applicable | 11.6 | 66.0 | 62.2 |
| 2032 | Note ...: not applicable | Note ...: not applicable | Note ...: not applicable | Note ...: not applicable | 11.1 | 63.2 | 57.8 |
| 2033 | Note ...: not applicable | Note ...: not applicable | Note ...: not applicable | Note ...: not applicable | 10.1 | 57.5 | 48.8 |
|
... not applicable Source: Statistics Canada. Custom tabulation. |
|||||||
Appendix B
| Research topic | Short description |
|---|---|
| Childcare expenses | Currently, childcare costs are represented in the MBM as a direct deduction from disposable income. This way, a family’s needs are compared to an income measure that reflects their available resources. Experts have asked Statistics Canada if this is the best way to deal with childcare expenses in the MBM. Could childcare costs instead be treated as a separate basket item? |
| Remoteness | Statistics Canada will research whether adjustments should be made to the MBM to account for higher costs faced by families living in remote regions and communities to derive (for example) better estimates for the northern parts of provinces. |
| Different family types | Currently, Statistics Canada estimates MBM thresholds for a family of four, and then uses the square root equivalization scale to derive thresholds for families of different sizes. Does this method lead to the best possible thresholds for smaller families and unattached individuals? Additional study could also be conducted on whether it might be appropriate to construct separate basket values for families of the same size but with different compositions (e.g., lone parent family with three children versus a couple with two children) or other characteristics (e.g., age of family members). |
| Equivalization analysis | |
| Communications technology | Statistics Canada will look at how a separate communications component could best be added to the MBM. Presently, this need for communication goods and services is reflected in the “other” component. |
| The other component | The “other necessities” component is meant to represent the costs of goods and services other than food, shelter, transportation and clothing. The list of items that could potentially be included in the other component is large and could vary depending on the structure, age, location or other circumstances of a family. Ongoing research on the methodology underpinning the other component could verify whether the current method for setting the value of the other component is adequate or needs to be improved. |
| Poverty index | Anchoring the MBM to specific base years, yet updating it regularly to reflect changes in the standards of living to ensure it remains relevant is an underlying strength of the MBM. However, periodically rebasing the MBM leads to the creation of various poverty lines which can make it difficult to track poverty trends over longer time periods. To improve transparency and to help track poverty trends over longer time periods, the implementation of a poverty reduction index will be considered. |
| Inverse correlation of shelter and transportation costs | Often, people in areas where shelter costs are relatively higher have transportation costs that are relatively lower, and vice versa. For instance, people in rural areas typically pay lower rents and/or mortgages but must spend more on fuel and seldom access public transportation. We propose to explore whether the MBM could be improved by more precisely taking into account these differences in costs. |
| Using the MBM with administrative data | As it currently exists, the MBM poverty rates can only be accurately calculated using a combination of survey and administrative data. We propose to explore the feasibility of applying MBM thresholds to only administrative data. |
| Additional MBM income inequality indicators | The majority of the current MBM-based analytical products do not describe the full income distribution since they typically compare the MBM threshold to disposable income. Therefore they do not fully describe income inequality. |
References
Benjamin, Wesley and Sarah Maude Dion (2021). “Poverty Reduction Index Review by Methodology”. Internal document. Statistics Canada.
Djidel, Samir, Burton Gustajtis, Andrew Heisz, Keith Lam, Isabelle Marchand and Sarah McDermott (2020), “Report on the second comprehensive review of the Market Basket Measure”. Catalogue no. 75F0002M2020002.
Djidel, Samir, Burton Gustajtis, Andrew Heisz, Keith Lam and Sarah McDermott (2019a), “Towards an update of the Market Basket”. Catalogue no. 75F0002M2019013.
Djidel, Samir, Burton Gustajtis, Andrew Heisz, Keith Lam and Sarah McDermott (2019b), “Defining disposable income in the Market Basket Measure”. Catalogue no. 75F0002M2019014.
Employment and Social Development Canada, 2018. “Opportunity for All – Canada’s First Poverty Reduction Strategy”, Cat. No.: SSD-212-08-18E.
Heisz, Andrew (2019), “An update on the Market Basket Measure comprehensive review”. Catalogue no. 75F0002M2019009.
Statistics Canada (2019). “Methodological changes to the Market Basket Measure in 2019”. Catalogue no. 75F0002M2019005.
- Date modified: