
Income Research Paper Series
Market Basket Measure research paper: Market Basket Measure thresholds for remote regions
Skip to text
Text begins
On August 21, 2018, the Government of Canada released Opportunity for All – Canada’s First Poverty Reduction Strategy, which outlined long-term commitments to guide current and future government actions and investments to reduce poverty. The Poverty Reduction Act legislates key commitments made in the strategy, as well as mandating that Statistics Canada review the content of Canada’s official measure of poverty, the market basket measure (MBM), on a regular basis.
During consultations for the second comprehensive reviewNote of the MBM, one of the research topicsNote identified for further study was to investigate if adjustments could be made to the MBM methodology to account for differential costsNote associated with living in remote regions. The purpose of this paper is to report on the progress of this research item.
This paper builds on an earlier paper outlining an approach for delineating remote MBM regions by describing a potential methodology for creating remote-region MBM thresholds across Canada’s provinces. The paper also outlines the potential impacts these thresholds would have on provincial poverty estimates. It also provides an opportunity for the public and stakeholders to provide feedback and comments on the methodology.
Introduction
The MBM establishes poverty thresholds based on the cost of a “basket” of food, clothing, shelter, transportation and other items for a family of four, that reflects a modest, basic standard of living. A family with a disposable income that is below the appropriate MBM threshold for family size and region is considered to be living in poverty.Note
The current MBM methodology assigns the same MBM threshold to all communities denominated “rural” within the same province, meaning that relatively accessible rural areas have the same thresholds as communities in more isolated areas. In the first discussion paper on remote regions, a methodology for delineating remote regions for the MBM was proposed (See Text Box: Discussion paper on delineating remote regions for the MBM). This second discussion paper builds upon that research by developing a potential methodology for calculating thresholds for the previously identified remote MBM regions.
The thresholds for remote MBM regions are intended to capture the spirit of the existing provincial MBM (i.e., to represent a modest, basic standard of living), while leveraging the Northern Market Basket Measure (MBM-N)Note methodology to better reflect life in remote regions. Thresholds for remote MBM regions were calculated, and then the potential impacts on provincial poverty rates were estimated. Readers are encouraged to provide feedback and comments.
Summary of a potential methodology for costing a remote MBM region basket and calculating disposable income
The methodology for establishing poverty thresholds in remote MBM regions would be based on the existing MBM methodology (i.e., the same five components for a family of four that reflect a modest, basic standard of living). However, there are several challenges associated with deriving poverty thresholds for remote regions. Many remote communities are isolated and have limited infrastructure, which limits the availability of price collection for specific MBM basket items. Given the data limitations encountered during the process of deriving the cost of remote MBM baskets,Note it is not possible to provide a component level of detail for baskets across remote regions.
Costing of remote MBM basket components
Given certain similarities in living standards among provincial remote communities and communities residing in Canada’s territories, a basket of goods and services for remote regions would borrow features from the provincial MBM and MBM-N methodologies, and include adjustments to better reflect life and conditions in remote areas. Additional details on a possible methodology for remote MBM baskets are provided in Appendix B: Methodology for the remote MBM regions, components and disposable income. A comparison of the MBM (2018-base), MBM-N for Yukon and Northwest Territories, and MBM for remote regions is provided in Appendix C: A methodological comparison.
Start of text box
Discussion paper on delineating remote regions for the MBM
This is the second discussion paper released as part of the development of a potential methodology for estimating remote-region poverty thresholds for Canada’s provinces. “Delineating Remote Regions for the Market Basket Measure” is the first discussion paper in the series. It proposed a methodology for delineating remote regions for the MBM using Statistics Canada’s Index of Remoteness.
End of text box
Remote regions
The MBM remote regions proposed in the first remoteness discussion paper (i.e., based on the Index of Remoteness) were used. Remote regions were delineated for the provinces that remote regions could be created for: Newfoundland and Labrador, New Brunswick, Quebec, Ontario, Manitoba, Saskatchewan, Alberta, and British Columbia. A map showing the location of these designated remote regions, which appeared in the first remoteness discussion paper, is provided in Appendix D: Map of MBM regions by population size and remoteness designation.
Shelter component
The shelter component would be based on the rental of a three-bedroom, non-subsidized dwelling, in line with the National Occupancy Standard set out by the Canada Mortgage and Housing Corporation (CMHC). The rental price for a three-bedroom dwelling would be derived from the 2016 Census and adjusted to the 2018 base year.
Clothing and footwear component
The clothing and footwear component would be based on the Social Planning Council of Winnipeg and Winnipeg Harvest Acceptable Living Level 2012 clothing basket for a family of four.
Food component
The food component would be based on Health Canada’s 2019 National Nutritious Food Basket (NNFB). Spatial indexes would be created using Statistic Canada’s Living Cost Differential data to adjust food prices for the higher costs experienced in remote communities.
Transportation component
The transportation component for remote communities would only account for private modes of transportation. The remote-region methodology would be based on costs for owning, operating and maintaining either a car or a sport utility vehicle (SUV), depending on the road infrastructure (e.g., dirt roads, ice roads). The methodology for the fly-in communities would be based on the costs associated with owning, operating and maintaining both an all-terrain vehicle (ATV) and a snowmobile. This approach mirrors the one used for the transportation component in the MBM-N methodology.
Other necessities component
The other necessities component costs would apply a multiplier to the cost of the food and clothing components, as is done for the other MBM methodologies. An amount would also be added to the other necessities component to account for the need for cellular telephone services, as is currently done with the 2018-base MBM.
Calculating MBM disposable income for remote regions
Defining disposable income
The remote MBM methodology would define its disposable income in the same way as the other MBMs. It would be based on total income (including government transfers) after deducting not only income tax, but also several non-discretionary expenses (e.g., contributions to the Canada Pension Plan and Employment Insurance Plan, union dues, child-care expenses, support payments paid).
Tenure Type Adjustment (TTA)
When possible, the remote basket would also account for tenure types (e.g., homeownership with or without a mortgage and subsidized rental dwellings) other than non-subsidized rental dwellings. This would help to put families from all tenure types on more equal footing when determining their poverty status.
Working with Indigenous Peoples
Some First Nations reserves could be classified as remote. Given limitations related to price data collection and survey sampling, among others, MBM thresholds and poverty rates cannot be calculated for on-reserve communities (for more information, see Text Box: The commitment to co-develop with Indigenous peoples).
Start of text box
The commitment to co-develop with Indigenous Peoples
The Government of Canada is committed to reconciliation with Indigenous Peoples and to a renewed relationship based on the recognition of rights, respect, cooperation and partnership. Accordingly, Chapter 7 of Opportunity for All makes a commitment to take actions to help better understand poverty among First Nations people, Inuit and Métis—regardless of where they live in Canada.
During the consultations for Opportunity for All, the Government of Canada heard that it should take a strengths-based approach to poverty reduction that focuses on well-being and supporting resilience. Indigenous women also indicated that poverty is about more than a lack of income; it is also about social disconnection, and they explained that cultural activities promote social and economic well-being by improving self-confidence and building identity.
As part of the Opportunity for All distinctions-based approach, and based on the principles of reconciliation, the government is undertaking work with national Indigenous organizations and others to identify and co-develop indicators of poverty and well-being, including non-income-based measures of poverty, that reflect the multiple dimensions of poverty and well-being experienced by First Nations people, Inuit and Métis.
End of text box
Thresholds for remote MBM regions and poverty rates
Table 1 below shows the official 2018 MBM provincial thresholds for the four-person reference family (two adults and two children) (i.e., without remote region delineation), as well as the thresholds for remote MBM regions, using the methodology for delineating remote MBM areas.Note
| Geography | 2018 threshold without remote-region delineation | 2018 threshold with remote-region delineation |
|---|---|---|
| current dollars | ||
| Newfoundland and Labrador | ||
| Remote | Note ...: not applicable | 48,083 |
| Rural | 42,539 | 42,726 |
| Less than 30,000 people | 42,926 | 42,926 |
| New Brunswick | ||
| Remote | Note ...: not applicable | 47,986 |
| Rural | 40,766 | 40,766 |
| Less than 30,000 people | 42,284 | 42,284 |
| Quebec | ||
| Remote | Note ...: not applicable | 50,674 |
| Rural | 37,804 | 37,804 |
| Less than 30,000 people | 37,397 | 37,397 |
| Ontario | ||
| Remote | Note ...: not applicable | 51,254 |
| Rural | 40,576 | 40,787 |
| Less than 30,000 people | 41,250 | 41,261 |
| Manitoba | ||
| Remote | Note ...: not applicable | 47,778 |
| Rural | 38,954 | 39,005 |
| Less than 30,000 people | 40,780 | 40,793 |
| Saskatchewan | ||
| Remote | Note ...: not applicable | 50,773 |
| Rural | 40,280 | 40,306 |
| Less than 30,000 people | 42,003 | 42,003 |
| Alberta | ||
| Remote | Note ...: not applicable | 52,367 |
| Rural | 45,047 | 45,047 |
| Less than 30,000 people | 46,158 | 46,158 |
| British Columbia | ||
| Remote | Note ...: not applicable | 47,949 |
| Rural | 41,463 | 42,331 |
| Less than 30,000 people | 42,608 | 42,608 |
|
... not applicable Note: Remote-region thresholds are unofficial. Source: Statistics Canada. Custom tabulation. |
||
Incorporating remote regions in the MBM would reclassify some rural communities and some smaller ones with a population of fewer than 30,000 people (i.e., small urban communities). Therefore, incorporating remote regions into the MBM would not only affect the rural thresholds but also small urban thresholds. Under the methodology outlined in this paper, many of the rural and small urban provincial thresholds would increase if remote regions were incorporated into the MBM.Note
For all provinces where remote regions could be delineated, remote-region thresholds were higher than rural thresholds. In 2018, remote communities in Quebec had the highest costs, compared with rural communities—the estimated threshold was 34.0% higher in remote regions (Table 2). Remote regions in British Columbia (13.3%) and Newfoundland and Labrador (12.5%) had the lowest cost differentials, compared with their respective rural communities.
| Province | 2018 | ||
|---|---|---|---|
| Rural threshold | Remote threshold | Percent difference | |
| current dollars | percent | ||
| Newfoundland and Labrador | 42,726 | 48,083 | 12.5 |
| New Brunswick | 40,766 | 47,986 | 17.7 |
| Quebec | 37,804 | 50,674 | 34.0 |
| Ontario | 40,787 | 51,254 | 25.7 |
| Manitoba | 39,005 | 47,778 | 22.5 |
| Saskatchewan | 40,306 | 50,773 | 26.0 |
| Alberta | 45,047 | 52,367 | 16.2 |
| British Columbia | 42,331 | 47,949 | 13.3 |
|
Note: Thresholds above are unofficial. Source: Statistics Canada. Custom tabulation. |
|||
The higher thresholds in remote regions were mainly driven by higher costs in the food, clothing and transportation components. Higher costs associated with the food and clothing components subsequently increased the cost of the other necessities component because it is derived using a multiplier applied to the total cost of these components.Note Conversely, shelter costs were typically lower in remote communities, compared with their rural equivalents.
The remote-region thresholds would be some of the highest provincial thresholds across Canada, and many remote thresholds would also be higher than those for specific communities within their respective province. For example, in 2018, the four-person reference family threshold for Toronto, Ontario was $48,142, while the remote Ontario threshold would be $51,254.
Table 3 shows the potential impact of introducing remote regions into the MBM methodology on poverty rate estimates. With the addition of remote regions, the overall provincial poverty rate would increase by one percentage point in Newfoundland and Labrador. While there would also be marginal increases in Quebec, Ontario, Manitoba and Saskatchewan, these were not statistically significant.Note In addition, the overall poverty rate estimate for Canada would remain unchanged.
| People in poverty | ||||||
|---|---|---|---|---|---|---|
| Without remote regions | With remote regions | |||||
| Estimate | Lower bound | Upper bound | Estimate | Lower bound | Upper bound | |
| percent | ||||||
| Canada | 14.5 | 14.5 | 14.5 | 14.5 | 14.5 | 14.6 |
| Newfoundland and Labrador | 13.1 | 12.9 | 13.4 | 14.1Note * | 13.9 | 14.2 |
| New Brunswick | 15.6 | 15.4 | 15.8 | 15.6 | 15.5 | 15.7 |
| Quebec | 12.3 | 12.3 | 12.4 | 12.4 | 12.4 | 12.4 |
| Ontario | 15.5 | 15.5 | 15.6 | 15.6 | 15.5 | 15.6 |
| Manitoba | 14.3 | 14.1 | 14.5 | 14.4 | 14.3 | 14.5 |
| Saskatchewan | 12.7 | 12.6 | 12.9 | 12.9 | 12.8 | 13.1 |
| Alberta | 11.4 | 11.3 | 11.5 | 11.4 | 11.4 | 11.5 |
| British Columbia | 17.6 | 17.5 | 17.6 | 17.6 | 17.6 | 17.7 |
Note: Estimates are based on unofficial thresholds. Poverty rates have been rounded to one decimal place. This could mask slight differences between the bounds and the estimate. Prince Edward Island and Nova Scotia were omitted, as there are no remote regions in these provinces and no changes were observed. Estimates use the 2018-base methodology. Source: 2016 Census. Statistics Canada. Custom tabulation. |
||||||
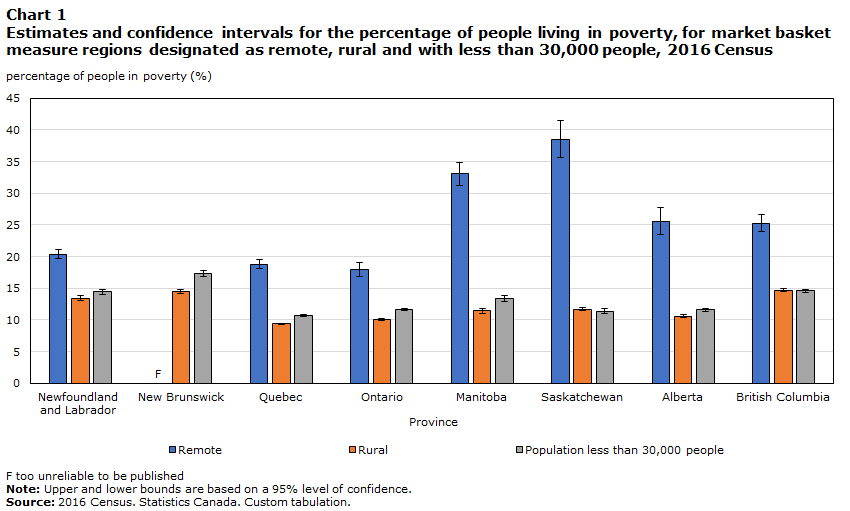
According to the 2016 Census, 172,163Note people were living in remote regions. The number of those living in remote regions in each province is included in Appendix E. Chart 1 provides the estimates and confidence intervals for the percentage of people in poverty for remote, rural and small urban MBM regions, using the 2016 Census. The remote-region poverty rates were higher than their provincial rural and small urban area counterparts. These differences were statistically significant. The highest remote-region poverty rate would be in Saskatchewan (38.6%), while the lowest would be in Ontario (18.0%).
Data table for Chart 1
| Remote | Rural | Population less than 30,000 people | |||||||
|---|---|---|---|---|---|---|---|---|---|
| Estimate | 95% Confidence interval | Estimate | 95% Confidence interval | Estimate | 95% Confidence interval | ||||
| lower | upper | lower | upper | lower | upper | ||||
| percentage of people in poverty (%) | |||||||||
| Newfoundland and Labrador | 20.39 | 19.72 | 21.07 | 13.40 | 13.02 | 13.78 | 14.47 | 14.06 | 14.87 |
| New Brunswick | Note F: too unreliable to be published | Note F: too unreliable to be published | Note F: too unreliable to be published | 14.51 | 14.23 | 14.79 | 17.32 | 16.90 | 17.73 |
| Quebec | 18.76 | 18.06 | 19.46 | 9.36 | 9.23 | 9.50 | 10.73 | 10.57 | 10.89 |
| Ontario | 17.96 | 16.84 | 19.09 | 10.03 | 9.90 | 10.17 | 11.68 | 11.53 | 11.83 |
| Manitoba | 33.06 | 31.20 | 34.91 | 11.41 | 11.09 | 11.73 | 13.35 | 12.88 | 13.81 |
| Saskatchewan | 38.55 | 35.57 | 41.53 | 11.72 | 11.45 | 11.99 | 11.38 | 11.04 | 11.73 |
| Alberta | 25.59 | 23.41 | 27.76 | 10.59 | 10.38 | 10.81 | 11.57 | 11.33 | 11.80 |
| British Columbia | 25.24 | 23.91 | 26.57 | 14.72 | 14.46 | 14.98 | 14.57 | 14.03 | 14.41 |
|
F too unreliable to be published Note: Upper and lower bounds are based on a 95% level of confidence. Source: 2016 Census. Statistics Canada. Custom tabulation. |
|||||||||
Finally, Table 4 shows that the poverty rate for seniorsNote living in remote regions was highest in Newfoundland and Labrador, Quebec and Alberta. On the other hand, childNote poverty rates in remote regions were highest in Saskatchewan, Manitoba and British Columbia. Furthermore, poverty rates were consistently higher for unattached individuals,Note compared with families.Note Saskatchewan, Manitoba and Alberta had the highest poverty rates for families living in remote MBM regions.
| Province | People in poverty | ||||||||||||||
|---|---|---|---|---|---|---|---|---|---|---|---|---|---|---|---|
| Age group | Economic family status | ||||||||||||||
| Younger than 18 years | 18 to 64 years | 65 years and older | In an economic family | Not in an economic family | |||||||||||
| Estimate | Lower bound | Upper bound | Estimate | Lower bound | Upper bound | Estimate | Lower bound | Upper bound | Estimate | Lower bound | Upper bound | Estimate | Lower bound | Upper bound | |
| percent | |||||||||||||||
| Newfoundland and Labrador | 21.4 | 19.4 | 23.4 | 14.3 | 13.5 | 15.1 | 37.1 | 35.5 | 38.7 | 17.0 | 16.3 | 17.8 | 50.5 | 48.1 | 52.8 |
| New Brunswick | Note F: too unreliable to be published | Note F: too unreliable to be published | Note F: too unreliable to be published | Note F: too unreliable to be published | Note F: too unreliable to be published | Note F: too unreliable to be published | Note F: too unreliable to be published | Note F: too unreliable to be published | Note F: too unreliable to be published | Note F: too unreliable to be published | Note F: too unreliable to be published | Note F: too unreliable to be published | Note F: too unreliable to be published | Note F: too unreliable to be published | Note F: too unreliable to be published |
| Quebec | 19.1 | 17.7 | 20.5 | 14.9 | 14.0 | 15.7 | 32.8 | 30.7 | 34.9 | 15.0 | 14.2 | 15.8 | 46.2 | 44.0 | 48.5 |
| Ontario | 24.0 | 21.1 | 26.9 | 15.6 | 14.5 | 16.7 | 19.1 | 17.3 | 20.9 | 14.8 | 13.5 | 16.0 | 36.4 | 33.9 | 38.9 |
| Manitoba | 45.6 | 41.6 | 49.6 | 29.4 | 27.5 | 31.2 | 23.7 | 19.1 | 28.4 | 31.8 | 29.6 | 33.9 | 42.6 | 37.9 | 47.3 |
| Saskatchewan | 52.4 | 47.6 | 57.1 | 32.1 | 29.4 | 34.8 | 30.7 | 25.6 | 35.9 | 37.1 | 34.0 | 40.2 | 51.1 | 45.2 | 57.0 |
| Alberta | 32.1 | 28.7 | 35.5 | 20.1 | 18.2 | 22.0 | 32.3 | 26.3 | 38.4 | 25.5 | 23.2 | 27.8 | 26.8 | 22.4 | 31.2 |
| British Columbia | 32.4 | 28.4 | 36.3 | 24.4 | 22.9 | 25.9 | 21.9 | 19.4 | 24.5 | 22.0 | 20.3 | 23.6 | 37.8 | 34.8 | 40.7 |
|
F too unreliable to be published Note: Estimates are unofficial. Source: 2016 Census, Statistics Canada. Custom tabulation. |
|||||||||||||||
Small populations – data sources and survey error
The poverty rates estimated for remote regions should be interpreted with caution, given the smaller sample size for these populations. At this time, remote-region poverty rates can only be estimated using census data, given its large sample size, compared with other household surveys. This means that estimates for remote regions cannot be produced with the Canadian Income Survey, the official source of annual poverty statistics for the MBM.
It should be noted that census-based estimates are also subject to survey error (for more information, see Text Box: Survey error). To view a table containing the estimates for the percentage of the population living in poverty across remote MBM regions and their corresponding 95% confidence intervals, see Appendix F.
Start of text box
Survey error
These estimates are derived from a survey and are subject to survey error, composed of non-sampling errors like non-response and sampling error, which causes variability. Variability is the extent to which the estimate produced will differ from other estimates, if the sample size and design were kept the same and no non-sampling error occurred, but a different sample was chosen.
One way to describe sampling error is to provide the margin of error for an estimate, based on a certain level of confidence. The most common way to do this is to provide an estimate along with its confidence interval. A confidence interval provides the upper and lower bounds for an estimate, based on a predefined level of confidence. For example, the upper and lower bounds for the estimates in Chart 1 are set at a 95% level of confidence. In other words, 19 times out of 20 (or 95% of the time), the true value will be found within the confidence interval, if it was calculated using the entire population. Therefore, 95% of the time, the estimates provided in Chart 1 could be any value within their respective confidence intervals.
End of text box
Summary of methodological challenges
In developing a potential methodology for creating MBM thresholds for people living in remote regions, several challenges were encountered when the individual basket components were constructed. These challenges include:
- It was not possible to calculate a separate food component for each province with a remote region because little or no LCD data were available for some provinces.
- Because of the very small sample size of people living in remote New Brunswick, it was not possible to calculate a shelter cost, so shelter costs from remote regions in Newfoundland and Labrador were used as a proxy.
- For the clothing and footwear component, there was insufficient information on the proportion of residents from remote communities who shop online versus those who take a shopping trip to buy clothes.
- For the transportation component, there was insufficient information on the proportion of SUVs and compact cars in remote ice-road communities.
Additional context relevant to these challenges is available in Appendix B.
Conclusion
This discussion paper is the second of two discussion papers aimed at examining the feasibility of creating remote-region poverty thresholds for Canada’s provinces. To this end, the paper described the possible MBM methodology for remote regions in the provinces, as well as the potential impacts on provincial-level poverty rates, using census data.
However, the data limitations outlined above make it difficult to incorporate remote regions into the current MBM methodology, and these methods are not currently recommended for official use. The issues discussed in this paper should be considered when assessing the feasibility of constructing remote-region MBM thresholds in the future, as the data necessary to address methodological limitations become available.
The fundamental purpose of this research paper series was to engage with the public and with stakeholders. We encourage users to ask questions, provide feedback and make suggestions for future work. Those interested in contacting us are encouraged to send an email to: statcan.market.basket.measure-mesure.du.panier.de.consommation.statcan@canada.ca.
Appendix A: Forward-looking research agenda items
| Research topic | Short description |
|---|---|
| Childcare expenses | Currently, childcare costs are represented in the MBM as a direct deduction from disposable income. This way, a family’s needs are compared to an income measure that reflects their available resources. Experts have asked Statistics Canada if this is the best way to deal with childcare expenses in the MBM. Could childcare costs instead be treated as a separate basket item? |
| Remoteness | Statistics Canada will research whether adjustments should be made to the MBM to account for – higher costs faced by families living in remote regions and communities to derive (for example) better estimates for the northern parts of provinces. |
| Different family types | Currently, Statistics Canada estimates MBM thresholds for a family of four, and then uses the square root equivalization scale to derive thresholds for families of different sizes. Does this method lead to the best possible thresholds for smaller families and unattached individuals? Additional studies could also be conducted on whether it might be appropriate to construct separate basket values for families of the same size but with different compositions (e.g., lone parent family with three children versus a couple with two children) or other characteristics (e.g., age of family members). |
| Equivalization analysis | |
| Communications technology | Statistics Canada will look at how a separate communications component could best be added to the MBM. Presently, this need for communication goods and services is reflected in the “other” component. |
| The other component | The “other necessities” component is meant to represent the costs of goods and services other than food, shelter, transportation and clothing. The list of items that could potentially be included in the other component is large and could vary depending on the structure, age, location or other circumstances of a family. Ongoing research on the methodology underpinning the other component could verify whether the current method for setting the value of the other component is adequate or needs to be improved. |
| Poverty index | Anchoring the MBM to specific base years, yet updating it regularly to reflect changes in the standards of living to ensure it remains relevant is an underlying strength of the MBM. However, periodically rebasing the MBM leads to the creation of various poverty lines which can make it difficult to track poverty trends over longer time periods. To improve transparency and to help track poverty trends over longer time periods, the implementation of a poverty reduction index will be considered. |
| Shelter and transportation costs | Often, people in areas where shelter costs are relatively higher have transportation costs that are relatively lower, and vice versa. For instance, people in rural areas typically pay lower rents and/or mortgages but must spend more on fuel and seldom access public transportation. We propose to explore whether the MBM could be improved by more precisely taking into account these differences in costs. |
| Using the MBM with administrative data | As it currently exists, the MBM poverty rates can only be accurately calculated using a combination of survey and administrative data. We propose to explore the feasibility of applying MBM thresholds to only administrative data. |
| Additional MBM income inequality indicators | Since the majority of the current MBM-based analytical products do not describe the full income distribution, since they typically compare the MBM threshold to disposable income, they do not fully describe income inequality. Proposed additional inequality indicators will be presented, which will allow to better identify income disparities among Canadians. |
Appendix B: Methodology for the remote market basket measure (MBM) regions, components and disposable income
MBM remote regions
MBM remote regions were identified in a previous discussion paper based on the Index of Remoteness.Note This index was created by Statistics Canada to provide a better understanding of community access to goods, services and economic opportunities. The Index of Remoteness is a continuous measure that provides a relative indication of remoteness on a scale varying from 0 to 1, with 0 being the most accessible and 1 the least accessible. Kriging,Note a spatial interpolation method, was used to provide remoteness estimates at the dissemination area (DA) level. Geospatial techniques and expert judgment was used to determine that a threshold of greater than or equal to 0.53 would delineate “remote areas” for the purposes of the MBM.
The outlined methodology did not identify any remote areas in Nova Scotia or Prince Edward Island. Therefore, poverty thresholds for remote regions were only created for the following provinces: Newfoundland and Labrador, New Brunswick, Quebec, Ontario, Manitoba, Saskatchewan, Alberta and British Columbia.
Methodology for the MBM remote-region basket
The MBM remote-region basket would have the same five components as the regular MBM: clothing and footwear, food, shelter, transportation, and other necessities. Because of data limitations, only total remote-region thresholds for each province are provided in this discussion paper.
Clothing and footwear component
The remote basket’s clothing and footwear component would be based on the 2012 Social Planning Council of Winnipeg and Winnipeg Harvest Acceptable Living Level Basket. The basket contains goods specifically for a reference family of two adults and two children, and provides clothing and footwear for the most common work, school and social occasions. No adaptations to the clothing items, quantities or replacement schedule were made.
Prices were collected annually from outlets in one representative city in each province, and the average of the three lowest price observations in each city was calculated for each item in the component. In addition, a three-year price average was measured to ensure that item price volatility was minimized. These prices, combined with specified quantities and a replacement schedule, resulted in the cost of the clothing component.
It is also proposed to incorporate the costs associated with a shopping trip and the costs of shipping to remote areas. This would involve taking a weighted average of the costs associated with travel to the nearest census agglomeration (CA), and the costs of ordering online. Because of a lack of information and data on the proportion of residents who order online versus those who take a shopping trip from remote communities, an equal-weighted average of the costs associated with a shopping trip as well as those for online shopping was used. Costs associated with travelling to the nearest CA could include gasoline, hotel, and a plane ticket. Costs associated with ordering online would be an annual cost with the assumption of a monthly bulk order. The component would be updated annually using the annual Consumer Price Index (CPI)’s provincial clothing and footwear index.
Food component
It is proposed that the remote region basket would use the 2019 National Nutritious Food Basket (NNFB) developed by Health Canada to obtain the cost of the food component. Food items in the NNFB are consistent with the new Canada’s Food Guide and are commonly consumed nutritious foods that Canadians reported consuming in the 2015 Canadian Community Health Survey – Nutrition.
The 2019 NNFB includes fresh, frozen and canned food formats to balance considerations of cost, access and availability. Additionally, 5% is added to the total cost of the basket for miscellaneous foods and beverages, like coffee, tea, herbs, spices and condiments. No adjustments are proposed to the food items in the NNFB to reflect life in remote regions. It should be noted that the MBM methodology does not prescribe individual food items for families. Rather, it is meant to provide an estimate of the cost of a nutritious diet for the reference family.
To estimate the cost of the food component in remote communities, it is proposed that spatial indexes would be created using Statistic Canada’s Living Cost Differential (LCD) data to adjust food costs, reflecting the assumption that food costs are higher in remote communities. The indexes were applied to the base city’s costs for the four food groups contained in the NNFB (i.e., vegetables and fruit, protein foods, whole-grain foods, and unsaturated fats) and then aggregated to obtain a food component cost per remote community. Finally, the 2016 Census population weights were used to estimate a weighted average of food costs per MBM remote region.
It was not possible to calculate a separate food component for each province with a remote region because of data limitations. For example, some provinces had zero or only one remote community for which LCD data was available. To circumvent this limitation, the provinces with remote regions were grouped into four groups to estimate the food component: 1) Newfoundland and Labrador, and New Brunswick; 2) Ontario and Quebec; 3) Manitoba, Saskatchewan and Alberta; and 4) British Columbia. The component would be updated annually using the CPI’s provincial food purchased from stores index.
Shelter component
It is proposed that the shelter component would use the 2016 Census to calculate shelter costs for rental units. The census is chosen to provide rental values because its large sample size allows for a more precise estimation of rental costs and covers all types of rental units. Shelter costs would include both rent and utilities (e.g., heating, water costs and electricity). The shelter component would use the National Occupancy Standard for the reference family of an adult couple with two children (a girl aged 9 and a boy aged 13). This means that it would be based on the cost of a three-bedroom rental unit that is not in need of major repairs. Collective dwellings, rent-free units and dwellings within reserves would not be included in these calculations.
To obtain the cost for the average three-bedroom rental unit with utilities, a quantile regression model was used to estimate shelter costs across all MBM regions for households in the second income decile, as was done for the 2018-base MBM for the provinces. This methodology is currently under review. An amount for tenants’ insurance and appliances would also be added to shelter costs. Because of the very small sample size in remote New Brunswick, it was not possible to calculate a shelter cost using the quantile regression, so shelter costs from remote regions in Newfoundland and Labrador were used as a proxy. The shelter component would be calculated for the base year and then indexed using the provincial CPI all-items index.
Transportation component
In contrast with some of the more accessible MBM regions, it is proposed that the transportation component would only include costs for private modes of transportation. The methodology applied for remote communities would depend on whether the community had road access. Analogous to rural regions, for most remote communities, meaning those with regular road access, the proposed transportation cost would be based on the cost to operate a vehicle based on a basket of cars using the five top-selling cars according to registration data for their respective province.
For remote communities with ice-road access, it is proposed that the component would be based on the cost of a weighted basket of vehicles that would include both a small SUV and the basket of compact cars used in other areas of the province. Equal weighting would be used between an SUV and a compact car because of data limitations.Note For remote communities with regular road or ice-road access, an additional amount would be added to account for higher maintenance costs and kilometres driven in these regions, compared with the more accessible MBM regions. For fly-in communities, the transportation component would be based on the cost of purchasing, maintaining and operating a mid-quality range all-terrain vehicle and snowmobile, and the cost of shipping these vehicles to the fly-in community. The component would be calculated for the 2018 base year, then indexed using the CPI’s provincial private transportation index.
Other necessities component
The proposed methodology for the other necessities component would use the same methodology as in other MBM methodologies. The 2018-base MBM multiplier would be applied to the food and clothing component costs for each of the MBM remote regions.Note It is also proposed that an amount for cellular telephone services be priced separately and added to the other necessities component.
The component would be calculated for the 2018 reference year and updated using the CPI’s provincial annual all-items index.
Methodology for disposable income in MBM remote regions
Disposable income for the MBM is defined as total income (including government transfers) after deducting income tax and non-discretionary expenses. These expenses include Canada Pension Plan and Quebec Pension Plan contributions, Employment Insurance and Registered Pension Plan contributions, union dues, child-care expenses, support payments, and direct medical expenses, including private insurance premiums. When deriving disposable income, capital gains taxes are removed from the income taxes deducted from total income to prevent families from appearing to be in poverty because of capital gains taxes.
The MBM also makes adjustments for housing tenure types, including homeownership (with or without a mortgage) and subsidized dwellings, to place families living in different dwelling types on more equal footing with those living in rental units when determining poverty status.Note
The estimation of the TTA for each MBM remote region and tenure type would be computed by subtracting the typical shelter cost of the specific tenure type from the shelter cost for renters. These costs are calculated for a three-bedroom unit, the National Occupancy Standard set out by CMHC for a family of four with an income in the second decile. TTAs are calculated for a family of four in the second income decile, then values for other family sizes are calculated using the square root equivalence method.Note These TTAs are then added to disposable income when evaluating poverty status.
For homeowners without a mortgage, the shelter costs considered for the MBM consist of property taxes, utility costs, condominium fees and basic home insurance costs. For homeowners with a mortgage, the costs considered are the same, with the addition of mortgage interest payments estimated using data from the Survey of Financial Security. For subsidized renters, shelter costs consist of the rent paid plus utility costs and relevant insurance costs.
Appendix C: A methodological comparison
| Component | MBM | MBM-N for Yukon and Northwest Territories | MBM for remote regions |
|---|---|---|---|
| Shelter | • Canadian Mortgage and Housing Corporation's National Occupancy Standards for reference family | • Canadian Mortgage and Housing Corporation's National Occupancy Standards for reference family | • Canadian Mortgage and Housing Corporation's National Occupancy Standards for reference family |
| • Uses 2016 Census | • Uses 2016 Census | • Uses 2016 Census | |
| • Median rent for 3-bedroom rental unit | • Median rent for 3-bedroom rental unit | • Median rent for 3-bedroom rental unit | |
| • Non-subsidized rental units | • Non-subsidized rental units | • Non-subsidized rental units | |
| • Supplement for appliance costs | • No supplement for appliance costs | • Supplement for appliance costs | |
| • Amount for tenant’s insurance included | • Amount for tenant’s insurance included | • Amount for tenant’s insurance included | |
| • Not applicable | • Not applicable | • Because of data limitations related to the very small sample size of people living in remote New Brunswick, it was not possible to calculate a shelter cost for the province. Shelter costs from remote regions in Newfoundland and Labrador were used as a proxy | |
| • Annual adjustments use the provincial all-items indexes | • Annual adjustments use the territorial all-items indexes | • Annual adjustments use the provincial all-items indexes | |
| Transportation | • Uses a weighted average of the cost of public transit and private transportation (population centres with fewer than 30,000 people only have private transportation costs) | • Uses only private transportation costs | • Uses only private transportation costs |
| • Weighted basket of five used compact cars and associated costs | • Weighted basket of one used compact car and one used sport utility vehicle | • Weighted basket of five used compact cars and associated costs for communities with regular road access | |
| • Eight-year-old vehicles, amortized over five years with a 36-month financing term | • Eight-year-old vehicles, amortized over five years with a 36-month financing term | • Eight-year-old vehicles, amortized over five years with a 36-month financing term | |
| • 1,200 litres of gas per year | • 1,200 litres of gas per year in the capitals, a little more outside the capitals | • 1,200 litres of gas per year - An additional amount would also be added to account for higher maintenance costs and kilometers driven in these regions, compared with the more accessible MBM regions | |
| • Cost of monthly public transit passes for two adults and one child and an additional amount sufficient for 12 round-trip taxi rides | • Not applicable (no public transportation costs) | • Not applicable (no public transportation costs) | |
| • Not applicable (no difference for fly-in communities) | • For the fly-in communities of the Northwest Territories, costs are associated with purchase of a new mid-quality range all-terrain vehicle and snowmobile, amortized over eight years with a 36-month financing term | • For the fly-in communities, costs are associated with purchase of a new mid-quality range all-terrain vehicle and snowmobile, amortized over eight years with a 36-month financing term | |
| •Not applicable (no difference for ice-road communities) | •Not applicable (no difference for ice-road communities) | • For ice-road communities, costs will be based on a weighted basket of five used compact cars and one sport utility vehicle | |
| • Annual adjustments use the provincial private transportation indexes | • Annual adjustments use the territorial private transportation indexes | •Annual adjustments use the provincial private transportation indexes | |
| Food | • Health Canada's 2019 National Nutritious Food Basket | • Health Canada's 2019 National Nutritious Food Basket | • Health Canada's 2019 National Nutritious Food Basket |
| • 5% is added to the total cost of the 2019 basket for miscellaneous foods and beverages | • 5% is added to the total cost of the 2019 basket for miscellaneous foods and beverages | • 5% is added to the total cost of the 2019 basket for miscellaneous foods and beverages | |
| • Prices collected in 38 cities across the provinces | • Prices collected in the territorial capitals, adjusted using spatial indexes for outside the capitals | • Prices collected in provincial base cities and then adjusted using spatial indexes for remote areas | |
| • Annual adjustments use the provincial food purchased from stores indexes | • Annual adjustments use the territorial food purchased from stores indexes | • Annual adjustments use the provincial food purchased from stores indexes | |
| Clothing and footwear | • 2012 Social Planning Council of Winnipeg and Winnipeg Harvest Acceptable Living Level (ALL) Basket | • 2012 Social Planning Council of Winnipeg and Winnipeg Harvest Acceptable Living Level (ALL) Basket | • 2012 Social Planning Council of Winnipeg and Winnipeg Harvest Acceptable Living Level (ALL) Basket |
| • Prices collected in 11 cities across the provinces | • Prices collected in the territorial capitals. For outside the capitals, a weighted average of the costs associated with one trip to the closest territorial capital and the cost of ordering online | • Prices collected in 11 cities across the provinces. A weighted average of the costs associated with one trip to the closest census agglomeration and the cost of ordering online was also included | |
| • Not applicable (no adjustments are made to the ALL basket) | • Adjustments were made to the ALL replacement schedule and clothing list because of the colder climate | • Not applicable (no adjustments are made to the ALL basket) | |
| • Annual adjustments use the provincial clothing and footwear indexes | • Annual adjustments use the territorial clothing and footwear indexes | • Annual adjustments use the provincial clothing and footwear indexes | |
| Other necessities | • Fixed multiplier (75.4%) using Survey of Household Spending data of the total cost of the food and clothing components for each MBM region | • Fixed multiplier (75.4%) using Survey of Household Spending data of the total cost of the food and clothing components for each MBM-N region | • Fixed multiplier (75.4%) using Survey of Household Spending data of the total cost of the food and clothing components for each MBM region |
| • Additional provincial amount for cell-phone services | • Additional territorial amount for cell-phone services | • Additional provincial amount for cell-phone services | |
| • Annual adjustments use the provincial all-items indexes | • Annual adjustments use the territorial all-items indexes | • Annual adjustments use the provincial all-items indexes | |
| Disposable Income | • Total income (including government transfers), less income tax and several non-discretionary expenses | • Total income (including government transfers), less income tax and several non-discretionary expenses | • Total income (including government transfers), less income tax and several non-discretionary expenses |
| • Three Tenure Type Adjustments | • Three Tenure Type Adjustments | • Three Tenure Type Adjustments | |
| • Medical expenses imputation uses provincial data | • Medical expenses imputation uses territorial data | • Medical expenses imputation uses provincial data |
Appendix D: Map of MBM regions by population size and remoteness designation
Figure D.1
MBM regions using the 2016 Census, after the addition of the remote region category
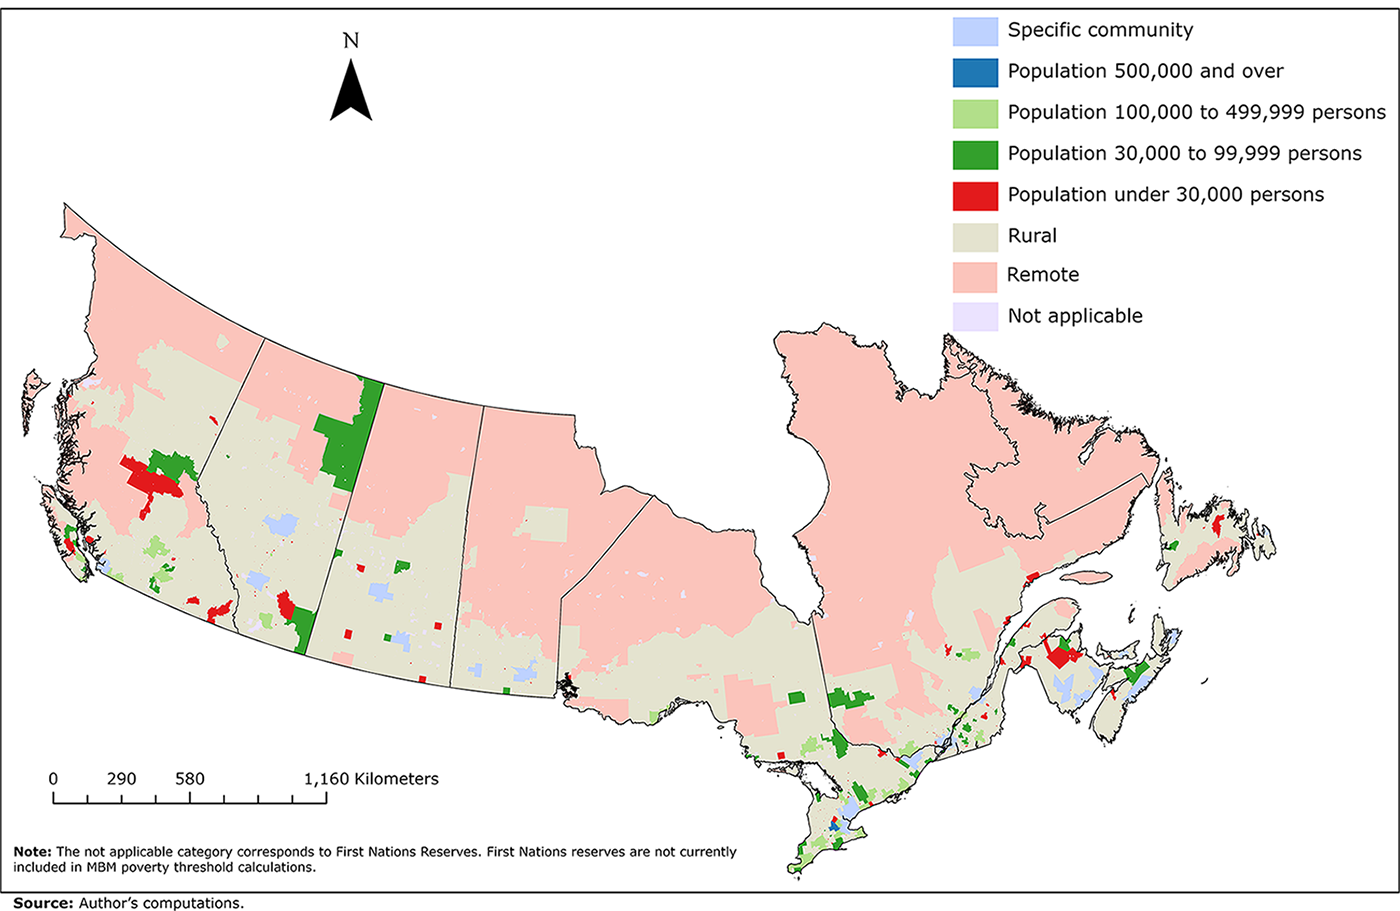
Description for Figure D1
There is a map of the provinces divided into 8 discrete categories. These categories represent the 6 types of MBM regions for the 2018-base MBM, remote regions, and one not applicable category. Each category has a unique color. The light blue, dark blue, light green, dark green, red, light brown, pink, and light purple represent the MBM specific communities, population 500,000 and over, population 100,000 to 499,999 persons, population 30,000 to 99,999 persons, population under 30,000 persons, rural, remote, and the not applicable categories respectively.
Appendix E: Number of people living in remote regions
| Province | Number of people |
|---|---|
| Newfoundland and Labrador | 47,334 |
| Prince Edward Island | 0 |
| Nova Scotia | 0 |
| New Brunswick | 123 |
| Quebec | 39,851 |
| Ontario | 31,394 |
| Manitoba | 11,666 |
| Saskatchewan | 8,124 |
| Alberta | 16,090 |
| British Columbia | 17,581 |
| Canada | 172,163 |
|
Note: The number of people in remote regions reported here differs from the numbers reported in the previous discussion paper, "Delineating remote regions for the Market Basket Measure," as those included all people living within market basket measure (MBM) remote regions, while these numbers exclude certain populations for which MBM calculations do not apply, such as people living in a farm operator dwelling or people living in band housing. Source: 2016 Census. Statistics Canada. Custom tabulation. |
|
Appendix F: Poverty rate estimates for remote regions
| Geography | People in poverty | |||||
|---|---|---|---|---|---|---|
| Without remote regions | With remote regions | |||||
| Estimate | Lower bound | Upper bound | Estimate | Lower bound | Upper bound | |
| percent | ||||||
| Newfoundland and Labrador | ||||||
| Remote | Note ...: not applicable | Note ...: not applicable | Note ...: not applicable | 20.4 | 19.7 | 21.1 |
| Rural | 12.6 | 12.3 | 12.9 | 13.4 | 13.0 | 13.8 |
| Population less than 30,000 people | 14.3 | 13.9 | 14.7 | 14.5 | 14.1 | 14.9 |
| New Brunswick | ||||||
| Remote | Note ...: not applicable | Note ...: not applicable | Note ...: not applicable | Note F: too unreliable to be published | Note F: too unreliable to be published | Note F: too unreliable to be published |
| Rural | 14.5 | 14.2 | 14.8 | 14.5 | 14.2 | 14.8 |
| Population less than 30,000 people | 17.3 | 16.9 | 17.7 | 17.3 | 16.9 | 17.7 |
| Quebec | ||||||
| Remote | Note ...: not applicable | Note ...: not applicable | Note ...: not applicable | 18.8 | 18.1 | 19.5 |
| Rural | 9.3 | 9.2 | 9.4 | 9.4 | 9.2 | 9.5 |
| Population less than 30,000 people | 10.7 | 10.5 | 10.8 | 10.7 | 10.6 | 10.9 |
| Ontario | ||||||
| Remote | Note ...: not applicable | Note ...: not applicable | Note ...: not applicable | 18.0 | 16.8 | 19.1 |
| Rural | 9.9 | 9.8 | 10.1 | 10.0 | 9.9 | 10.2 |
| Population less than 30,000 people | 11.7 | 11.5 | 11.9 | 11.7 | 11.5 | 11.8 |
| Manitoba | ||||||
| Remote | Note ...: not applicable | Note ...: not applicable | Note ...: not applicable | 33.1 | 31.2 | 34.9 |
| Rural | 11.9 | 11.6 | 12.2 | 11.4 | 11.1 | 11.7 |
| Population less than 30,000 people | 13.4 | 12.9 | 13.8 | 13.3 | 12.9 | 13.8 |
| Saskatchewan | ||||||
| Remote | Note ...: not applicable | Note ...: not applicable | Note ...: not applicable | 38.6 | 35.6 | 41.5 |
| Rural | 12.2 | 11.9 | 12.4 | 11.7 | 11.4 | 12.0 |
| Population less than 30,000 people | 11.4 | 11.1 | 11.8 | 11.4 | 11.0 | 11.7 |
| Alberta | ||||||
| Remote | Note ...: not applicable | Note ...: not applicable | Note ...: not applicable | 25.6 | 23.4 | 27.8 |
| Rural | 10.8 | 10.6 | 11.0 | 10.6 | 10.4 | 10.8 |
| Population less than 30,000 people | 11.6 | 11.3 | 11.8 | 11.6 | 11.3 | 11.8 |
| British Columbia | ||||||
| Remote | Note ...: not applicable | Note ...: not applicable | Note ...: not applicable | 25.2 | 23.9 | 26.6 |
| Rural | 14.7 | 14.4 | 14.9 | 14.7 | 14.5 | 15.0 |
| Population less than 30,000 people | 14.2 | 14.0 | 14.4 | 14.2 | 14.0 | 14.4 |
|
... not applicable F too unreliable to be published
|
||||||
References
Alasia Alessandro, Bédard Frédéric, Bélanger Julie, Guimond Eric, and Penney Christopher (2017), “Measuring remoteness and accessibility - A set of indices for Canadian communities”. Catalogue no. 18-001-X.
Devin, Nancy, Gustajtis Burton, Lam Keith, and McDermott Sarah (2021), “Construction of a Northern Market Basket Measure of poverty for Yukon and the Northwest Territories”. Catalogue no. 75F0002M.
Djidel, Samir, Gustajtis Burton, Heisz Andrew, Marchand Isabelle, McDermott Sarah (2020), “Report on the second comprehensive review of the Market Basket Measure”. Catalogue no. 75F0002M2020002.
Djidel, Samir, Gustajtis Burton, Heisz Andrew, Lam Keith, and McDermott Sarah (2019a), “Towards an update of the Market Basket”. Catalogue no.75F0002M2019013.
Djidel, Samir, Gustajtis Burton, Heisz Andrew, Lam Keith, and McDermott Sarah (2019b), “Defining disposable income in the Market Basket Measure”. Catalogue no. 75F0002M2019014.
Employment and Social Development Canada (2018), “Opportunity for All – Canada’s First Poverty Reduction Strategy”. Catalogue no. SSD-212-08-18E.
Gustajtis, Burton, Lam Keith, and McDermott Sarah (2021), “Proposals for a Northern Market Basket Measure and its disposable income”. Catalogue no. 75F0002M2021001.
Gustajtis, Burton and Heisz, Andrew (2022), “Market Basket Measure Technical Paper: The other necessities component”. Catalogue no. 75F0002M.
Hatfield, Michael, Pyper Wendy, and Gustajtis Burton (2010), “First Comprehensive Review of the Market Basket Measure of Low Income”. Applied Research Branch paper, Human Resources and Skills Development Canada.
Heisz, Andrew (2019), “An update on the Market Basket Measure comprehensive review”. Catalogue no.75F0002M2019009.
Steinmetz-Wood, Madeleine (2023), “Market Basket Measure Research Paper: Delineating Remote Regions for the Market Basket Measure” Catalogue no. 75F0002M.
- Date modified: