
Income Research Paper Series
Construction of a Northern Market Basket Measure of poverty for Yukon and the Northwest Territories
by Nancy Devin, Burton Gustajtis, Keith Lam and Sarah McDermott
Statistics Canada

As stated in the Poverty Reduction Act, the Market Basket Measure (MBM) is now Canada’s Official Poverty Line.
This discussion paper describes the proposed methodology for a new Northern Market Basket Measure (MBM-N) for Yukon and the Northwest TerritoriesNote Note , as well as identifies potential avenues of research in preparation for the next comprehensive review of the MBM, which is expected to occur in 2023.
The paper also presents initial MBM-N thresholds and provides preliminary poverty estimates for reference years 2018 and 2019. A review period will follow the release of this paper, during which time Statistics Canada and Employment and Social Development Canada (ESDC) will welcome feedback from interested parties and work with experts, stakeholders, indigenous organizations, federal, provincial and territorial officials to validate the results.
The MBM-N methodology proposed in this paper is derived from the MBM methodology currently applied in the provinces. As such, it is comprised of five major components: food, clothing, transportation, shelter and other necessities. The MBM-N is intended to capture the spirit of the existing MBM (i.e., to represent a modest, basic standard of living) while accounting for adjustments needed to reflect life in Yukon and the Northwest Territories.
Acknowledgements
This discussion paper would not have been possible without the invaluable contributions of the Statistics Bureaus of Yukon and the Northwest Territories. We would like to thank them for their support and time in helping create the methodology for the MBM-N, and for their help with reviewing this paper.
Introduction
On August 21, 2018, the Government of Canada released Opportunity for All, Canada’s First Poverty Reduction Strategy, which contained long-term commitments to guide current and future government actions and investments to reduce poverty.
The Poverty Reduction Act legislated key commitments made in the strategy. Opportunity for All indicates that Statistics Canada will be investigating the possibility of producing MBM thresholds for the territories. To this end, Statistics Canada held several discussions with the statistical focal points for Yukon and the Northwest Territories to identify what specific changes, compared to the existing MBM, need to be considered in order to construct MBM thresholds for these territories. These discussions were aimed at building upon a 2012 study by an informal working groupNote formed to assess the technical feasibility of developing a MBM-N (Statistics Canada internal document, 2012).
A MBM-N for Nunavut
Statistics Canada and ESDC are working in collaboration with Nunavut statistical focal points on developing a MBM-N tailored towards the unique living conditions experienced in that territory.
This paper describes the proposed methodology for calculating MBM-N basket component costs and disposable income amounts for comparison, and providing the resulting preliminary disposable income thresholds and poverty rate estimates for 2018 and 2019. Readers are encouraged to provide feedback and comments. Although this paper does not address a MBM-N for Nunavut, we welcome feedback and comments related to that territory as well (see text box – A MBM-N for Nunavut).
Discussion papers reporting on the proposed creation of a MBM-N
This is the second discussion paper released as part of the development of proposed methodologies for an MBM-N for Yukon and the Northwest Territories. Other MBM-N papers include:
- January 2021: Proposals for a Northern Market Basket Measure and its disposable income
The MBM-N basket for Yukon and the Northwest Territories are comprised of five major components: food, clothing, transportation, shelter and other necessities. A family is in poverty if its disposable income is less than the MBM-N threshold for a family of its size in its region. Proposals for a Northern Market Basket Measure and its disposable income describes considerations for these five components and for its disposable income concept.
- Spring 2022: Proposals for a Northern Market Basket Measure and its disposable income (Nunavut)
The Nunavut MBM-N basket will include the same five major components as outlined in the MBM-N baskets for the Northwest Territories and Yukon, while taking into account additional adjustments to the contents to reflect life in Nunavut.
Working with Indigenous peoples
In Opportunity for All, the Government of Canada committed to “work[ing] with National Indigenous Organizations and others to identify and co-develop indicators of poverty and well-being, including non-income-based measures of poverty, that reflect the multiple dimensions of poverty and well-being experienced by First Nations, Inuit and Métis.”Note
It is important to note that discussions around the co-development of new indicators of poverty and well-being for Indigenous peoples are proceeding on a separate track from the MBM-N methodology proposal.
While the proposed MBM-N is based on a methodology which is currently officially used by the Government of Canada to calculate national poverty statistics, the Government is currently working to better understand poverty and well-being from the perspective of Indigenous peoples, and to encourage the co-development of complementary indicators of poverty and well-being, including non-income-based measures of poverty, that reflect the multiple dimensions of poverty and well-being experienced by First Nations, Inuit and Métis. Given that there is a higher proportion of individuals reporting an Indigenous identity in the territories when compared to the rest of Canada, integrating such additional indicators of poverty in analyses pertaining to these regions is particularly important.
The MBM methodology is not intended to be a prescriptive and inflexible basket of goods and services. Although the standards are based on non-indigenous constructs, the costs associated with each component should be the focus of the validation process, not the items themselves.What we heard after the publication of the first MBM-N discussion paper
During the review process, we heard about the need for a more holistic approach to measuring poverty. Statistics Canada and ESDC are aware that the proposed MBM-N methodology does not fully meet the holistic approach to poverty endorsed by many organizations and individuals working with people that have lived experiences of poverty in the territories. As stated in Opportunity for All, the Government recognizes that poverty is a multi-dimensional issue that cannot be fully captured by considering income and costs alone, as is done with the MBM. However, Statistics Canada and ESDC believe that the MBM is a key step towards capturing the strong link between low income and the other dimensions of poverty. For more information on the other dimensions of poverty being measured by the Government of Canada, please see Canada’s Official Poverty Dashboard which can be found on Dimensions of Poverty Hub.
Summary of proposed MBM-N methodology
The MBM establishes poverty thresholds based on the cost of a “basket” of food, clothing, shelter, transportation and other necessities. Families with disposable incomes less than the applicable thresholds, given their family size and region of residence, are considered to be living in poverty. The following is the proposed methodology for a 2018-baseNote MBM-N. Additional details on these proposals were provided in the previous discussion paper on the development of the MBM-N and described in more detail in Appendix A: Proposed methodology for the MBM-N regions, components and disposable income.
Summary of proposed methodology for the costing of MBM-N basket components (described in Proposals for a Northern Market Basket Measure and its disposable income)
MBM-N regions
It is proposed that the MBM-N (2018-base) provide poverty thresholds for nine regions across the two territories: one for each of the capitals and seven additional geographical groupings – two for YukonNote and five for the Northwest TerritoriesNote . Under guidance from the statistical focal points, the development of the MBM-N regions responds to the need for sufficient detail on price differences across communities, while keeping price measurement requirements within reasonable parameters.Note
Shelter component
The proposed MBM-N shelter components methodology is based on the rental of a 3-bedroom dwelling, in-line with the National Occupancy Standard set out by the Canada Mortgage and Housing Corporation (CMHC). The rental prices for a dwelling would be derived from the 2016 Census data and adjusted to the 2018 base year.
Clothing and footwear component
It is proposed the clothing and footwear component would reflect the Social Planning Council of Winnipeg and Winnipeg Harvest Acceptable Living Level (ALL) 2012 clothing basket for a family of four, while making adjustments to account for the colder climate in the territories.
Food component
The food component would be based on Health Canada’s 2019 National Nutritious Food Basket (NNFB).
Transportation component
The transportation methodology would reflect the differing private transportation usage patterns and needs of people living in the territories. Accordingly, the proposed MBM-N methodology recognizes this by costing a combination of a car and sport utility vehicle (SUV). The fly-in communities of the NWT would have costs associated with owning and operating both an all-terrain vehicle (ATV) and a snowmobile.
Other necessities component
The other necessities component costs would use a “simplified” multiplierNote applied to the food and clothing costs, which is consistent with the methodology for the MBM in the provinces. An amount would also be added to reflect the widespread need for cellular telephone services.
Summary of proposed methodology for calculating MBM-N disposable income
Defining disposable income
In general, the MBM-N definition of disposable income would mirror the 2018-base MBM methodology. Specifically, the MBM-N methodology defines disposable income as total income (including government transfers) after deducting not only income tax, but also several non-discretionary expenses (e.g., contributions to the Canada Pension Plan and Employment Insurance, union dues, child care expenses, support payments paid, etc.).

Tenure Type Adjustment (TTA)
Similar to what was done for the 2018-base MBM methodology in the provinces, in order to recognize the differing shelter costs faced by homeowners with or without a mortgage and subsidized renters, the MBM-N methodology proposes to make an adjustment to its disposable income, which is referred to as a Tenure Type Adjustment (TTA). The TTA would add the difference between the cost of the shelter component of the MBM-N basket (based on renters) and the typical shelter costs for the other tenure types, to the disposable income of families of the corresponding tenure type. The TTA places homeowners and subsidized renters on a more equal footing with renters in regards to their shelter costs, when evaluating their poverty status.
Medical expense imputation amounts
Medical expenses are derived directly from administrative tax data. When no medical expense data is available, a value is imputed using territorial data from the Survey of Household Spending (SHS).
MBM-N thresholds and poverty rates
In this section we describe the resulting estimated MBM-N thresholds and poverty rates under the proposed methodology. These results should be treated as preliminary given that the review phase of this discussion paper is not complete.
Table 1 shows the MBM-N thresholds for a four-person family for each of the MBM-N regions under the proposed methodology for reference years 2018 and 2019. In general, the MBM-N thresholds for the Northwest Territories are higher than those for Yukon. The threshold differences between the two territories are mainly due to the cost differences in the shelter and food components. In 2018, the MBM-N region of Rural South in Yukon has the lowest threshold amount at $50,895, while Sahtu in the Northwest Territories has the highest threshold amount at $72,526. For the territorial capitals, Whitehorse has a MBM-N threshold of $52,215 and Yellowknife has a MBM-N threshold of $59,926.
| MBM-N Geography | 2018 | 2019 | |
|---|---|---|---|
| current dollars | |||
| Territory | Region | ||
| Yukon | Rural North | 53,203 | 54,166 |
| Rural South | 50,895 | 51,817 | |
| Whitehorse | 52,215 | 53,164 | |
| Northwest Territories | Beaufort Delta | 71,611 | 72,902 |
| Sahtu | 72,526 | 73,848 | |
| Tłįchǫ | 58,962 | 60,021 | |
| Dehcho | 62,289 | 63,406 | |
| South Slave | 59,004 | 60,059 | |
| Yellowknife | 59,926 | 60,971 | |
|
Note: MBM-N thresholds are preliminary. Source: Statistics Canada. Custom tabulation. |
|||
For the 2018 reference year, all 53 of the MBM regions in the provinces had lower 2018-base thresholds compared to the MBM-N thresholds. The MBM province thresholds ranged from $37,397 for Quebec communities with a population less than 30,000 people to $48,677 for Vancouver (in current dollars).
The thresholds presented in Table 1 are developed for the reference family of four (two adultsNote and two childrenNote ). The same reference family approach is used in the MBM for the provinces. To calculate thresholds for family sizes that are different from that of the reference family, the MBM-N uses a square root of family size equivalence scale. The equivalence scale method is commonly used to adjust other low-income thresholds (e.g., LIMs and LICOs) to different family sizes, and is recommended for use in poverty measurement (UNECE, 2011).Note
Table 2 shows the 2018 and 2019 poverty rates as measured in the Canadian Income Survey (CIS) using the proposed MBM-N thresholds, for selected geographies, age groups and family types. According to the MBM-N, the preliminary poverty rate decreased in these two territories, from 14.5% in 2018 to 10.8% in 2019. For the preliminary estimates for the number of persons in poverty, please see Appendix B.
| Persons in poverty | ||||||
|---|---|---|---|---|---|---|
| 2018 | 2019 | |||||
| Lower bound | Estimate | Upper bound | Lower bound | Estimate | Upper bound | |
| percent | ||||||
| Geography | ||||||
| Yukon and Northwest Territories | 10.8 | 14.5 | 18.2 | 8.3 | 10.8 | 13.4 |
| Yukon | 7.9 | 11.1 | 14.2 | 6.0 | 9.0 | 12.0 |
| Northwest Territories | 11.0 | 17.5 | 24.0 | 8.4 | 12.5 | 16.7 |
| Age groupTable 2 Note 2 | ||||||
| Persons under 18 years | 10.0 | 17.0 | 24.0 | 7.4 | 13.1 | 18.8 |
| Persons 18 to 64 years | 9.4 | 12.6 | 15.9 | 6.9 | 9.0 | 11.1 |
| Persons 65 years and over | 14.6 | 21.3 | 27.9 | 11.8 | 17.7 | 23.5 |
| Family TypeTable 2 Note 2 | ||||||
| Persons in economic families | 8.3 | 12.6 | 16.9 | 5.8 | 8.7 | 11.6 |
| Persons not in an economic family | 19.1 | 24.0 | 28.9 | 16.7 | 21.5 | 26.4 |
None of the 2018 to 2019 changes are statistically significant. Source: Canadian Income Survey, Statistics Canada. Custom tabulation. |
||||||
The preliminary poverty rate in Yukon went down from 11.1% in 2018 to 9.0% in 2019, while the preliminary poverty rate for the Northwest Territories went from 17.5% to 12.5% over the same period. Estimates for small domains should be used with caution. For more information (see text box – Measuring survey error).
For combined Yukon and the Northwest Territories geography, these decreases were also observed in the selected age groups and family types, from 2018 to 2019. ChildrenNote , on average, experienced a larger decrease than seniorsNote .
Similarly, over the same period, persons living in families experienced a larger decrease than unattached individuals (i.e., persons not in an economic family). None of the changes between 2018 and 2019 in Table 2 were statistically significant (please see next section Survey error within the Territorial estimates).
Measuring survey error
As these estimates are derived from a survey, they are subject to survey error. Survey error is composed of non-sampling errors such as non-response and sampling error which causes variability. Variability is the extent to which the estimate produced will differ from other estimates, if the sample size and design were kept the same and no non-sampling error occurred but a different sample was chosen.
One way to describe sampling error is to provide the margin of error for an estimate, based on a certain level of confidence. The most common way to do this is to give an estimate along with its confidence interval. A confidence interval provides the upper and lower bounds for an estimate, based on a predefined level of confidence. For example, the upper and lower bounds for the estimates in Table 2, are set at a 95% level of confidence. In other words, 19 times out of 20 (or 95% of the time) the true value will be found within the confidence interval, had it been calculated using the entire population. Therefore, 95% of the time, the estimates provided in Table 2 could be any value within their respective confidence intervals.
Survey error within territorial estimates
Chart 1 illustrates the importance of considering the quality indicators provided with every estimate to take into account the variability of the estimates when making a statement. Although the year-over-year poverty estimates for both territories went down from 14.5% in 2018 to 10.8% in 2019, the percentages could have been anywhere within their respective confidence intervals. Meaning, the magnitude of the change could have been larger or smaller, or the change could have even gone in the opposite direction. When the income data for more years becomes available, the analysis of the time series should provide further insights into poverty trends over time. In addition, the application of these thresholds to other income sources with a larger sample size (e.g., 2021 Census for 2020 income), or to administrative data sources could also provide for stronger inferences and more disaggregation.
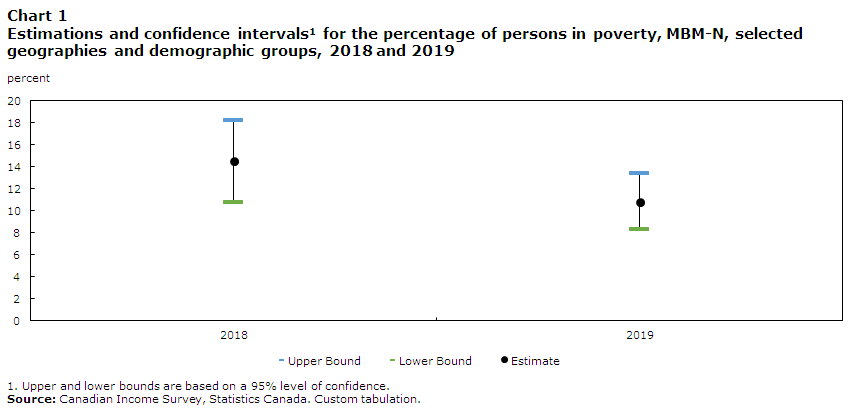
Data table for Chart 1
| Year | Estimate | Upper Bound | Lower Bound |
|---|---|---|---|
| percent | |||
| 2018 | 14.5 | 18.2 | 10.8 |
| 2019 | 10.8 | 13.4 | 8.3 |
|
Note: Upper and lower bounds are based on a 95% level of confidence. Source: Canadian Income Survey, Statistics Canada. Custom tabulation. |
|||
A MBM-N forward-looking research agenda
A number of research topics were identified during the creation and review process of this paper. Given their complexity and uncertain feasibility in implementation, these MBM-N-specific topics will require further study before the next MBM-N rebasing exercise.Note
Revised Northern Food Basket: Statistics Canada will examine the feasibility of incorporating the Revised Northern Food Basket (RNFB) for the communities outside the capital into a future MBM-N methodology. The RNFB measures the cost of a nutritious diet for a family of four and is used by Nutrition North Canada (NNC) to monitor the cost of healthy eating in isolated northern communities. Presently, the pricing of the 2019 NNFB is used to estimate food costs in the capital and spatial indexes are used to adjust these costs for all other communities.
Country Food and Harvesting. Currently the MBM methodology only takes into account food purchased from stores. Country food and harvesting is an important source of nutritious food for many remote communities in the territories. Statistics Canada will research other approaches that could account for other sources of food in the territories, such as harvesting, trapping, hunting and fishing for country food.
Conclusion
This is the final discussion paper describing the proposed MBM-N methodology for Yukon and the Northwest Territories. It provides and compares provisional MBM-N thresholds and poverty rates, which were the result of collaboration between Statistics Canada, ESDC, and the statistical bureaus of Yukon and the Northwest Territories.
The paper has also proposed some elements for a forward-looking research agenda for the MBM-N, outlining two key topics that Statistics Canada and ESDC intend to study in preparation of the next comprehensive review, scheduled for 2023.
It is important to note that the fundamental purpose of this paper is to foster engagement with key stakeholders. Therefore, following the release of this paper, there will be a review period during which time Statistics Canada and ESDC will engage with experts, stakeholders, Indigenous organisations and federal, provincial and territorial officials to help validate the results. The review period is expected to end in the beginning of 2022. We encourage readers to contact us to share their views, suggestions and feedback by sending an email to:
statcan.market.basket.measure-mesure.du.panier.de.consommation.statcan@statcan.gc.ca
If access to email is impractical or not possible, we can also be reached by contacting Statistics Canada’s general enquiries line:
- Toll-free number: 1-800-263-1136
- National TTY line: 1-866-753-7083
Appendix A: Proposed methodology for the MBM-N regions, components and disposable income
Proposed methodology for the MBM-N regions
Under guidance from the statistical focal points, the MBM-N regions were based, where appropriate, on the Census Division boundaries, while also taking into consideration similarities between communities in order to make logical geographical groupings. The intent is to have the most detailed price differentials for goods and services for the communities, while keeping the price measurement within reasonable parameters. It is proposed that the MBM-N provide poverty thresholds for nine regions across the two territories: one for each of the capitals and seven additional geographical groupings – two for Yukon and five for the Northwest Territories.
Specifically, for Yukon, the 62nd parallel would be used to delineate the boundary of Rural South and Rural North, while Whitehorse would be the entire Census Agglomeration (CA). The Yukon Subdivision, Unorganized, which occupies the majority of the territory and spans the two proposed areas, would be included in the Rural North region as approximately two-thirds of its total area is located in the region.Note For the Northwest Territories, the five Census Divisions (e.g., Beaufort Delta, Sahtu, Tłįchǫ, Dehcho and South Slave) would be used to group communities, while the Census Division Region 6, which includes Yellowknife, would be used for the capital.Note
There are a number of issues that make measuring poverty in the Northwest Territories and Yukon particularly challenging, especially for geographies outside of the territorial capital. These challenges can impact both the expenditure and income sides of the MBM-N methodology. For example, the logistical challenges of isolated communities with limited infrastructure can impact the availability of food and clothing price collection for estimating the MBM-N basket costs. Similar logistical challenges, along with the need to protect the confidentiality of the survey response, can impact the availability of income data. For example, the income source for the annual poverty estimates is the CIS which excludes households in remote areas with a very low population density. Although this impact is smallNote , it is important to note because a large proportion of First Nations and Inuit people reside in these excluded areas.Note
Proposed methodology for the MBM-N basket
The MBM-N basket consists of five components: clothing, food, shelter, transportation and other expenses. In general, each of these components were adapted from the MBM, to reflect life in Yukon and the Northwest Territories.Note

Clothing and footwear component
The MBM-N clothing and footwear component is based on the 2012 Social Planning Council of Winnipeg and Winnipeg Harvest Acceptable Living Level (ALL) Basket, with several adjustments to account for the colder climate in the Northwest Territories and Yukon. The ALL clothing and footwear list was adapted for use in MBM-N by specifying the quantity, quality, and replacement schedule for each of the items required by the MBM-N reference family (i.e., two adults and two children). In general, it provides clothing and footwear for most common work, school and social occasions.
Prices are collected from stores for the 2018 base year in each capital and the arithmetic average of the three lowest price observations in each city is calculated for each item in the basket. In addition, a three-year average of item prices is taken to ensure that price volatility is minimized. These prices, combined with specified quantities and a replacement schedule, results in the cost of the clothing component. The pricing methods for the MBM-N are similar to the 2018-base MBM.
In order to adapt to the specific needs of the Northwest Territories and Yukon, it is proposed that several adjustments be made to the ALL clothing and footwear list. During the 2012 MBM-N feasibility study consultation process, it was proposed that certain items found in the ALL clothing basket were unnecessary or not typically used in the territories, and therefore should be removed. Conversely, new items should be added.
| MBM-N Geography | 2018 | 2019 | |
|---|---|---|---|
| current dollars | |||
| Territory | Region | ||
| Yukon | Rural North | 3,673 | 3,611 |
| Rural South | 3,492 | 3,433 | |
| Whitehorse | 3,246 | 3,191 | |
| Northwest Territories | Beaufort Delta | 4,227 | 4,270 |
| Sahtu | 3,985 | 4,026 | |
| Tłįchǫ | 3,592 | 3,629 | |
| Dehcho | 3,973 | 4,014 | |
| South Slave | 3,725 | 3,763 | |
| Yellowknife | 3,400 | 3,435 | |
|
Note: MBM-N thresholds are preliminary. Source: Statistics Canada. Custom tabulation. |
|||
Also, it is proposed that the replacement schedule (i.e., the lifespan of clothing items) for certain items be adjusted. During the most recent consultation process with the territorial statistical focal points, it was also proposed that an adjustment should be made to the replacement schedule, to account for the higher use of winter clothes in the territories. Using Environment and Climate Change Canada temperature data from Winnipeg, the city where the 2012 ALL basket is based, and comparing it to a corresponding territorial capital, an adjustment ratio was created.Note It is proposed that this ratio be used to adjust the 2012 ALL clothing basket replacement schedule for summer and winter clothes. For example, this ratio would increase how often a family would need to replace typical winter items like scarfs and toques, while decreasing how often they would need to replace typical summer items like bathing suits.
Both of these adjustments reflect the need for warmer clothes in the territories, particularly during the winter months, as well as the more frequent use of certain items due to the cold climate. Note
For areas outside of the capital, a weighted average method is being proposed, and incorporates the costs associated with travel to the closest territorial capital and the cost of ordering online. The price of the trip to the capital would include gasoline, hotel and/or plane tickets if required.Note The shipping cost associated with online purchases would be estimated on an annual basis, under the assumption of monthly bulk orders. The weights are based on the percentage of people in the lower end of the income distribution for these regions with internet access, either at home or on a mobile device.
After directly pricing clothing items for the 2018 base year, the clothing component thresholds for subsequent years would be updated using the territory-specific Consumer Price Index (CPI) for “clothing and footwear”.Note
What we heard after the publication of the first MBM-N discussion paper
During the review period, we heard concerns about the perceived subjectivity of the additions and subtractions in the clothing and footwear component. While these changes might seem subjective and restrictive, they should not be viewed as prescriptive and inflexible. They are not meant to be a detailed list of items a family must buy. Rather, users are encouraged to judge if the total cost for the clothing and footwear component are reasonable for the reference family, not what individual items are being costed. A similar consideration should be taken into account when examining the food component.

Food component
It is proposed that the MBM-N would use the 2019 National Nutritious Food Basket (NNFB) developed by Health Canada to calculate the cost of the food component. The foods in the NNFB are consistent with the new Canada’s Food Guide and are commonly consumed nutritious foods that Canadians reported consuming in the 2015 Canadian Community Health Survey-Nutrition, the most recently available survey of food consumption.
The 2019 NNFB includes fresh, frozen and canned food formats to balance considerations of cost, access and availability. Additionally, 5% is added to the total cost of the basket for miscellaneous foods and beverages such as coffee, tea, herbs, spices and condiments.
Food prices were collected in 2018 by Statistics Canada in the territorial capitals. Monthly prices were collected from selected stores in each city and then the geometric mean of each item was calculated in order to determine the annual price for a given city. No adjustments were made to the 2019 NNFB to reflect life in the territories. It should be noted, as with all the other components, that the MBM methodology does not prescribe individual food items that a person should consume, rather it is meant to estimate the typical cost of a nutritious diet for the reference family.
| MBM-N Geography | 2018 | 2019 | |
|---|---|---|---|
| current dollars | |||
| Territory | Region | ||
| Yukon | Rural North | 15,745 | 16,112 |
| Rural South | 15,144 | 15,497 | |
| Whitehorse | 12,416 | 12,706 | |
| Northwest Territories | Beaufort Delta | 20,220 | 20,709 |
| Sahtu | 22,146 | 22,682 | |
| Tłįchǫ | 16,321 | 16,716 | |
| Dehcho | 17,143 | 17,558 | |
| South Slave | 15,763 | 16,144 | |
| Yellowknife | 12,454 | 12,755 | |
|
Note: MBM-N thresholds are preliminary. Source: Statistics Canada. Custom tabulation. |
|||
The proposed methodology for estimating the food component costs outside of the capitals would be to use an adjustment factor based on Statistic Canada’s Living Cost Differential data and territorial spatial indexes. The spatial indexes would be derived by combining Living Cost Differential (LCD) data and data supplied by the territorial statistical agencies, to create community level spatial indexes.Note These indexes would then be applied to their respective capital’s costs for the four main food groups that are found in the NNFB (i.e., vegetables and fruit, protein foods, whole grain foods, and unsaturated fats), which would be aggregated to calculate food component cost for a specific community. Finally, the 2016 Census based population weights would be used to aggregate the community level food costs into their respective MBM-N regions.
As with the previous component, direct pricing of the food basket would be for the 2018 base year, while subsequent years’ costs would be adjusted using the territory-specific CPI for “food purchased from stores”.

Shelter component
It is proposed that the MBM-N derive shelter costs for rental units measured in the 2016 Census, and would include both rent and utilities (e.g., heat, water and electricity). The Census is chosen as the data source because its large sample size allows for precise estimation of rental costs and covers all types of rental units, including those outside of the capital.
It is proposed that the MBM-N adopt the National Occupancy Standard for the reference family of one adult couple with two children (a girl aged 9 and a boy aged 13). Therefore, it would be based on shelter costs required for the reference family, or, more specifically: (1) the cost of a 3-bedroom rental unit; and, (2) it only includes units that are not in need of major repairs.Note Finally, collective dwellings, rent-free units and those found within reserves are excluded.
To determine the typical cost for a modest 3-bedroom rental unit, it is proposed to use a quantile regression model in order to accurately measure shelter costs across all MBM-N regions. In addition, an amount for tenant’s insurance is also proposed to be included. In consultation with our territorial statistical focal points, it was determined that the vast majority of rental units in the territories included appliances as part of the rent. Therefore, the MBM-N shelter component would not include a separate category of expenses related to the purchase of appliances.
| MBM-N Geography | 2018 | 2019 | |
|---|---|---|---|
| current dollars | |||
| Territory | Region | ||
| Yukon | Rural North | 12,433 | 12,681 |
| Rural South | 11,765 | 11,999 | |
| Whitehorse | 18,657 | 19,028 | |
| Northwest Territories | Beaufort Delta | 21,214 | 21,556 |
| Sahtu | 18,859 | 19,163 | |
| Tłįchǫ | 17,065 | 17,340 | |
| Dehcho | 18,047 | 18,338 | |
| South Slave | 18,069 | 18,360 | |
| Yellowknife | 25,320 | 25,728 | |
|
Note: MBM-N thresholds are preliminary. Source: Statistics Canada. Custom tabulation. |
|||
The proposed methodology for estimating the shelter component costs outside of the capital would be the same as the capital, but the shelter costs would be calculated separately for each of the MBM-N regions.
Finally, in the MBM-N, it is proposed that the territory-specific all-items index of the CPI be used to update the value of the shelter component for subsequent reference years.Note

Transportation component
In general, it is proposed that two main changes be made to the 2018-base MBM methodology to reflect life in the Northwest Territories and Yukon. First, it is proposed that the transportation component would comprise of only costs related to private transportation. Second, considering the road infrastructure in the territories, it is proposed the component should be based on the costs for a weighted basket made-up of both a small Sport Utility Vehicle (SUV) and a compact car.
The selection of which compact car and SUV to use would be based on their sales numbers. Using registration data, a weighted average for all compact cars and SUVs would be used to determine the total costs for the component.
The proposed methodology for estimating costs outside of the capital would depend on whether the communities have road access. For communities with road access, the costs of the transportation component would be the same as in the capital, but with adjustments based on the registration weights to account for the higher prevalence of SUVs versus compact cars outside of the capital. In addition, for these regions, it is proposed that a small nominal cost be added to account for the higher maintenance cost and higher number of kilometres typically driven compared to the capital.
| MBM-N Geography | 2018 | 2019 | |
|---|---|---|---|
| current dollars | |||
| Territory | Region | ||
| Yukon | Rural North | 5,508 | 5,603 |
| Rural South | 5,239 | 5,329 | |
| Whitehorse | 4,884 | 4,968 | |
| Northwest Territories | Beaufort Delta | 5,860 | 5,953 |
| Sahtu | 6,176 | 6,274 | |
| Tłįchǫ | 5,313 | 5,397 | |
| Dehcho | 5,547 | 5,635 | |
| South Slave | 5,096 | 5,177 | |
| Yellowknife | 5,141 | 5,223 | |
|
Note: MBM-N thresholds are preliminary. Source: Statistics Canada. Custom tabulation. |
|||
For the fly-in communities in the Northwest Territories, the transportation costs would be based on the costs associated with purchasing a new mid-quality range All-Terrain Vehicle (ATV) and a snowmobile from Hay River and shipping it by barge to the fly-in community, as well as the costs associated with operating and maintaining them.Note
Finally, it is proposed that the appropriate territorial level index for private transportation be used to adjust the transportation component for subsequent reference years.
What we heard after the publication of the first MBM-N discussion paper
During the review, we heard concerns that an ATV was not sufficient to meet the needs for people living in the fly-in communities of the Northwest Territories. It was suggested that the costs associated with snowmobiles should also be included, especially when one considers going “on the land” during the winter.
After review and consultations with the statistical focal points from the Northwest Territories, it was agreed upon that the costs associated with both a mid-level ATV and snowmobile better reflect the needs of people living in the fly-in communities, and represents a modest, basic standard of living for these communities.

Other component
The MBM-N has a final component that recognises the needs for other necessary goods and services that are not captured under the shelter, clothing, food and transportation categories (e.g., household items, personal care, reading materials, etc.). The methodology for pricing other goods and services does not utilize the pricing of items as other parts of the MBM-N does. Doing so would be difficult, as there are a large number of items that would potentially need to be priced, and many of the items would be considered necessities for some families but not for others. Accordingly, the other component is meant to approximate average expenditures on a wide range of other goods and services, using data sourced from Statistics Canada’s SHS.
In addition, it is proposed that an amount for cellular telephone services be priced separately and added to the other necessities component. The cellular telephone services amount would be based on the median territorial expenditure for a family of four in the first five income deciles in each territory, based on SHS data.
The proposed methodology for the other necessities component in and outside of the capital would use the same methodology. The 2018-base MBM multiplierNote would be applied to the food and clothing component threshold costs for each of the MBM-N regions.
| MBM-N Geography | 2018 | 2019 | |
|---|---|---|---|
| current dollars | |||
| Territory | Region | ||
| Yukon | Rural North | 15,844 | 16,159 |
| Rural South | 15,255 | 15,559 | |
| Whitehorse | 13,012 | 13,271 | |
| Northwest Territories | Beaufort Delta | 20,090 | 20,414 |
| Sahtu | 21,360 | 21,704 | |
| Tłįchǫ | 16,671 | 16,939 | |
| Dehcho | 17,579 | 17,862 | |
| South Slave | 16,351 | 16,614 | |
| Yellowknife | 13,611 | 13,830 | |
|
Note: MBM-N thresholds are preliminary. Source: Statistics Canada. Custom tabulation. |
|||
Finally, in the MBM-N, it is proposed that the territory specific all-items index of the CPI be used to update the value of the other necessities component for subsequent reference years.
Proposed methodology for the MBM-N disposable income
In the MBM-N methodology, disposable income is defined as total income (including government transfers) after deducting not only income tax, but also several non-discretionary expenses including Canada Pension Plan and Quebec Pension Plan contributions, Employment Insurance and Registered Pension Plan contributions, union dues, child care expenses, support payments paid, and direct medical expenses including private insurance premiums.
In addition to accounting for different housing tenure types, it is proposed that the MBM-N follow the other changes introduced by the 2018-base MBM (i.e., medical expense imputation amount and capital gains tax adjustments).Note
Tenure Type Adjustment
As was done in the 2018-base MBM, it is proposed that the MBM-N methodology would make an adjustment, where possible, for other housing tenure types other than rental dwellings, such as homeownership with or without mortgages and those residing in subsidised dwellings. This would serve to place families in all tenure types on a more equal footing to those families in rental units, when determining their poverty status.

Summary of the process
The estimation of the TTA for each MBM-N region and tenure type would be obtained by subtracting the typical shelter costs of a specific tenure type from the shelter cost for renters derived during the construction of the basket. These TTA values are calculated for a three-bedroom unit for a family with an income in the second decile for each MBM-N region.
TTAs are based on National Occupancy Standard set out by CMHC for a family of four, and then equivalent values for other family sizes are computed using the square root method. These TTAs are then added to disposable income when evaluating poverty status.
The shelter cost for each tenure type is estimated for the base year. The MBM-N does not directly take into account the housing availability in the two territories, but indirectly addresses it through the use of the annual adjustors to estimate the increase in prices over time. Therefore, the tenure type costs reflect an estimation of their costs for a given reference year, but do not reflect the availability of each tenure type in a specific MBM-N region.
Homeowners without mortgages
For homeowners without a mortgage, the shelter costs considered for the MBM consist of property taxes, utility costs, condominium fees and basic home insurance costs. As noted above, these are estimated from 2016 Census data for a three-bedroom unit for a family in the second income decile for each MBM-N region.
Homeowners with mortgages
For the purpose of the MBM-N, shelter costs for homeowners with a mortgage would consist of property taxes, utility costs, condominium fees, basic home insurance costs and mortgage interest payments. The key difference, relative to homeowners without a mortgage, is the interest cost component (which is zero for homeowners without a mortgage).
Given the data limitations, a few changes compared to the 2018-base MBM were needed, in the calculation of the tenure type costs for homeowners with a mortgage. First, the mortgage interest costs were estimated using data from the 2018 Canadian Housing Survey (CHS), not the Survey of Financial Security (SFS). Second, the calculation was done for mortgages on three-bedroom dwellings only and with no age group differences. Finally, only homeowners in the second income decile were considered when estimating the shelter cost medians.
Subsidized renters
For tenants living in subsidized housing, TTAs are determined by estimating the median cost of a subsidized three-bedroom rental unit for a family in the second decile of income, and then measuring the difference between its cost and corresponding shelter cost in the basket component of the MBM. For subsidised renters, shelter costs consist of the rent paid plus utility costs and relevant insurance costs.Note
| MBM-N Geography | Homeowners with a mortgage | Homeowners without a mortgage | Subsidized Renters | |
|---|---|---|---|---|
| dollars | ||||
| Territory | Region | |||
| Yukon | Rural North | 0 | 5,470 | 5,842 |
| Rural South | 0 | 5,652 | 4,080 | |
| Whitehorse | 1,043 | 11,204 | 8,211 | |
| Northwest Territories | Beaufort Delta | 1,604 | 11,805 | 18,322 |
| Sahtu | 500 | 9,440 | 14,754 | |
| Tłįchǫ | 0 | 7,106 | 14,046 | |
| Dehcho | 1,985 | 10,235 | 14,823 | |
| South Slave | 758 | 8,471 | 14,474 | |
| Yellowknife | 4,961 | 13,371 | 14,440 | |
| Note: Tenure Type Adjustments are preliminary. Negative Tenure Type Adjustments were set to zero. Source: Statistics Canada. Custom tabulation. |
||||
Capital gains taxes
A capital gain or capital loss occurs when an individual disposes of, or transfers, a capital property (e.g., land, buildings, stocks, bonds, mutual funds, etc.). Since the MBM-N does not include the values of capital gains/losses in the definition of disposable income, yet deducts the income taxes, an adjustment to the disposable income is made to take into account the tax implications of capital gains/losses.
The taxes implications of capital gains/losses are not directly known from available tax information, they are first estimated and then the disposable income adjusted accordingly when administrative data indicates a capital gain/loss. Note
The effective tax rate would be calculated as the ratio of total tax paid divided by the sum of total income and the taxable amount of the capital gain/loss. This rate would then be multiplied by the taxable amount of the capital gain/loss. The disposable income would then be adjusted by the amount of tax attributed to the capital gain/loss.

Imputation amount for medical expenses
Medical expenses are one of the non-discretionary expenses that are deducted from after-tax income to derive disposable income for the MBM-N. These medical expenses include out-of-pocket expenses for prescription medicines, eye wear, medical services and health care equipment, dental services, health care and dental plan insurance premiums.
When determining disposable income, medical expenses gathered from tax forms are used, if the medical expense claimed on the tax form is greater than zero. If an adult respondent to the CISNote is not linked to tax data or if their medical claim for tax purposes is zero,Note it is proposed that a territorial-level imputation value be used.
Values would be derived from the most recent SHS data availableNote and reflect the territorial average of medical expenses for persons with less than the median income by territory who did not claim an amount on their tax return. This amount would only be computed for the base year (2018), while other years would be estimated by adjusting the 2018 amounts using the health care index. Note
| MBM-N Geography | dollars |
|---|---|
| Yukon | 549 |
| Northwest Territories | 685 |
| Source: Statistics Canada. Custom tabulation. | |
Appendix B: Number of persons in poverty
| 2018 | 2019 | |||||
|---|---|---|---|---|---|---|
| Lowerbound | Estimate | Upperbound | Lowerbound | Estimate | Upperbound | |
| number of persons in poverty | ||||||
| Geography | ||||||
| Yukon and Northwest Territories | 8,600 | 11,600 | 14,600 | 6,700 | 8,800 | 10,900 |
| Yukon | 3,000 | 4,200 | 5,400 | 2,300 | 3,500 | 4,700 |
| Northwest Territories | 4,600 | 7,400 | 10,100 | 3,500 | 5,300 | 7,100 |
| Age groupTable B.1 Note 2 | ||||||
| Persons under 18 years | 1,900 | 3,200 | 4,400 | 1,400 | 2,500 | 3,500 |
| Persons 18 to 64 years | 5,000 | 6,800 | 8,600 | 3,700 | 4,900 | 6,000 |
| Persons 65 years and over | 1,100 | 1,600 | 2,200 | 1,000 | 1,500 | 1,900 |
| Family TypeTable B.1 Note 2 | ||||||
| Persons in economic families | 5,500 | 8,400 | 11,300 | 3,900 | 5,900 | 7,800 |
| Persons not in an economic family | 2,600 | 3,200 | 3,800 | 2,300 | 2,900 | 3,600 |
None of the 2018 to 2019 changes are statistically significant. Source: Canadian Income Survey, Statistics Canada. Custom tabulation. |
||||||
Appendix C: MBM-N Regions

Description for Map 1
There is a map of Yukon and the Northwest Territories, divided into the nine MBM-N regions. Each territory and each MBM-N region is labelled. Also, the MBM-N regions have a unique colour. The label for Yellowknife states it includes other Region 6 (6106) census subdivisions. There is a “notes” section that states:
- Beaufort Delta corresponds to Region 1, Northwest Territories (6101).
- Sahtu corresponds to Region 2, Northwest Territories (6102).
- Tlicho corresponds to Region 3, Northwest Territories (6103).
- Dehcho corresponds to Region 4, Northwest Territories (6104).
- South Slave corresponds to Region 5, Northwest Territories (6105).
- For Yukon, the 62nd parallel is used to delineate the boundary of Rural South and Rural North.
In the bottom right of the image, there is a smaller map of Canada with Yukon and the Northwest Territories shaded grey.
The source of the boundaries are from Statistics Canada’s 2016 Census of Population.
The geographical regions of Yukon Rural South and Yukon Rural North are based on the Standard Geographical Classification (SGC 2016).
| Yukon MBM-N Region | Census subdivision | Northwest Territories MBM-N Region | Census subdivision |
|---|---|---|---|
| Rural North | Faro (6001004) | Beaufort Delta | Tsiigehtchic (6101010) |
| Carmacks (6001012) | Paulatuk (6101014) | ||
| Mayo (6001022) | Fort McPherson (6101015) | ||
| Dawson (6001029) | Inuvik (6101017) | ||
| Moosehide Creek 2 (6001031) | Aklavik (6101025) | ||
| Ross River (6001037) | Tuktoyaktuk (6101036) | ||
| Pelly Crossing (6001041) | Sachs Harbour (6101041) | ||
| Beaver Creek (6001042) | Region 1, Unorganized (6101063) | ||
| Yukon, Unorganized (6001045) | Ulukhaktok (6101095) | ||
| Stewart Crossing (6001050) | Sahtu | Délį̀ne (6102003) | |
| Keno Hill (6001052) | Tulita (6102005) | ||
| Rural South | Watson Lake (6001003) | Norman Wells (6102007) | |
| Teslin (6001006) | Fort Good Hope (6102009) | ||
| Teslin Post 13 (6001007) | Colville Lake (6102012) | ||
| Carcross 4 (6001008) | Region 2, Unorganized (6102063) | ||
| Klukshu (6001016) | Tłįchǫ | Behchokǫ̀ (6103031) | |
| Haines Junction (6001018) | Whatì (6103034) | ||
| Kloo Lake (6001019) | Gamètì (6103049) | ||
| Upper Liard (6001032) | Wekweètì (6103052) | ||
| Two Mile and Two and One-Half Mile Village (6001035) | Region 3, Unorganized (6103097) | ||
| Tagish (6001036) | Dehcho | Kakisa (6104005) | |
| Champagne Landing 10 (6001038) | Sambaa K'e (6104006) | ||
| Burwash Landing (6001039) | Fort Liard (6104009) | ||
| Swift River (6001046) | Nahanni Butte (6104010) | ||
| Johnsons Crossing (6001047) | Jean Marie River (6104013) | ||
| Carcross (6001048) | Fort Providence (6104014) | ||
| Destruction Bay (6001049) | Hay River Dene 1 (6104017) | ||
| Teslin (6001057) | Fort Simpson (6104038) | ||
| Whitehorse | Whitehorse (6001009) | Wrigley (6104044) | |
| Lake Laberge 1 (6001010) | Region 4, Unorganized (6104097) | ||
| Mt. Lorne (6001044) | South Slave | Fort Smith (6105001) | |
| Ibex Valley (6001055) | Enterprise (6105003) | ||
| Marsh Lake (6001058) | Salt Plains 195 (6105004) | ||
| Macpherson-Grizzly Valley (6001059) | Hay River (6105016) | ||
| Whitehorse, Unorganized (6001060) | Fort Resolution (6105018) | ||
| Łutselk'e (6105020) | |||
| Reliance (6105026) | |||
| Region 5, Unorganized (6105097) | |||
| Yellowknife | Detah (6106021) | ||
| Yellowknife (6106023) | |||
| Region 6, Unorganized (6106097) | |||
|
Note: Costs and incomes associated with 'on reserve' populations are not included in the MBM-N calculations. According to the 2016 Census definition, the following six census subdivision (CSD) types are associated with 'on reserve' populations: Indian reserve (IRI), Indian settlement (S-É) (except for the five Yukon settlements of Champagne Landing 10, Klukshu, Two and One-Half Mile Village, Two Mile Village and Kloo Lake), Indian government district (IGD), terres réservées aux Cris (TC), terres réservées aux Naskapis (TK) and Nisga'a land (NL). For more information on these on CSDs, please see Census subdivision types associated with 'on reserve' population section. Source: Statistics Canada, Census of Population, 2016. Custom tabulation. |
|||
Appendix D: MBM-N cold climate adjustment factors
| MBM-N Geography | Summer | Winter |
|---|---|---|
| Yukon | 0.94 | 1.05 |
| Northwest Territories | 0.72 | 1.23 |
| Source: Statistics Canada. Custom tabulation. | ||
Appendix E: MBM-N spatial index adjustment factors
| MBM-N Geography | Fats and Oils | Fruits and Vegetables | Protein Foods | Whole Grain Foods | |
|---|---|---|---|---|---|
| Territory | Region | ||||
| Yukon | Rural North | 1.27 | 1.26 | 1.17 | 1.32 |
| Rural South | 1.18 | 1.24 | 1.14 | 1.22 | |
| Whitehorse | 1.00 | 1.00 | 1.00 | 1.00 | |
| Northwest Territories | Beaufort Delta | 1.60 | 1.66 | 1.60 | 1.59 |
| Sahtu | 1.75 | 1.86 | 1.66 | 1.70 | |
| Tłįchǫ | 1.31 | 1.31 | 1.31 | 1.31 | |
| Dehcho | 1.36 | 1.39 | 1.36 | 1.36 | |
| South Slave | 1.25 | 1.27 | 1.23 | 1.28 | |
| Yellowknife | 1.00 | 1.00 | 1.00 | 1.00 | |
| Source: Statistics Canada. Custom tabulation. | |||||
Formula E.2: MBM-N food component formula for regions outside the capitals
The methodology for estimating the food costs outside of the capitals could be expressed in the following way.
First, indexes for each food group would be derived by averaging Living Cost Differential (LCD) data, , and data supplied by the territorial statistical agencies, , to create community level spatial indexes. A weighted sum would then be applied to the community indexes to obtain MBM-N region indexes,
where:
= Territorial provided special index for a given food grouping
, in community
,
= Living Cost Differential based special index for a given food grouping
, in community ,
= 2016 Census based population weight for community
.
Second, these indexes would then be applied to their respective capital’s costs for the four main food groups that are found in the NNFB (i.e., vegetables and fruit, protein foods, whole grain foods, and unsaturated fats).
Finally, the four main food group indexes are aggregated to calculate the food component cost for a specific MBM-N region, .
where:
= Weighted average spatial index for a given food grouping
, in a geographical grouping
,
= Food cost in the capital for a given food grouping .
Appendix F: Methodological comparison between the MBM (2018-base) and MBM-N
| Component | MBM | MBM-N |
|---|---|---|
| Shelter | • Canadian Mortgage and Housing Corporation's National Occupancy Standards for reference family | • Canadian Mortgage and Housing Corporation's National Occupancy Standards for reference family |
| • Uses 2016 Census | • Uses 2016 Census | |
| • Median rent for 3-bedroom rental unit | • Median rent for 3-bedroom rental unit | |
| • Non-subsidized rental units | • Non-subsidized rental units | |
| • Supplement for appliance costs | • No supplement for appliance costs | |
| • Amount for tenant’s insurance included | • Amount for tenant’s insurance included | |
| • Annual adjustments use the provincial all-items indexes | • Annual adjustments use the territorial all-items indexes | |
| Transportation | • Uses a weighted average of the cost of public transit and private transportation (Population centres with fewer than 30,000 people only have private transportation costs) | • Uses only private transportation costs |
| • Weighted basket of five used compact cars and associated costs | • Weighted basket of one used compact car and one used sport utility vehicle | |
| • Eight-year-old vehicles, amortized over five years with a 36-month financing term | • Eight-year-old vehicles, amortized over five years with a 36-month financing term | |
| • 1,200 litres of gas per year | • 1,200 litres of gas per year in the capitals, a little more outside the capitals | |
| • Cost of monthly public transit passes for two adults and one child and an additional amount sufficient for 12 round trip taxi rides | • Not applicable (no public transportation costs) | |
| • Not applicable (no difference for fly-in communities) | • For the fly-in communities of the NWT, costs associated with purchase of a new mid-quality range all-terrain vehicle (ATV) and snowmobile, amortized over eight years with a 36-month financing term | |
| • Annual adjustments use the provincial private or private transportation indexes | • Annual adjustments use the territorial private transportation indexes | |
| Food | • Health Canada's 2019 National Nutritious Food Basket (NNFB) | • Health Canada's 2019 National Nutritious Food Basket (NNFB) |
| • 5% is added to the total cost of the 2019 basket for miscellaneous foods and beverages | • 5% is added to the total cost of the 2019 basket for miscellaneous foods and beverages | |
| • Prices collected in 38 cities across the provinces | • Prices collected in the territorial capitals, adjusted using spatial indexes for outside the capitals | |
| Clothing and footwear | • 2012 Social Planning Council of Winnipeg and Winnipeg Harvest Acceptable Living Level (ALL) Basket | • 2012 Social Planning Council of Winnipeg and Winnipeg Harvest Acceptable Living Level (ALL) Basket |
| • Prices collected in 11 cities across the provinces | • Prices collected in the territorial capitals. For outside the capitals, a weighted average of the costs associated one trip to the closest territorial capital and the cost of ordering online. | |
| • Not applicable (no adjustments are made to the ALL basket) | • Adjustments were made to the ALL replacement schedule and clothing list due to the colder climate. | |
| Other necessities | • Fixed multiplier (75.4%) using Survey of Household Spending (SHS) data of the total cost of the food and clothing components for each MBM region. | • Fixed multiplier (75.4%) using Survey of Household Spending (SHS) data of the total cost of the food and clothing components for each MBM-N region. |
| • Additional provincial amount for cell phone services | • Additional territorial amount for cell phone services | |
| Disposable Income | • Total income (including government transfers), less income tax and several non-discretionary expenses | • Total income (including government transfers), less income tax and several non-discretionary expenses |
| • Three Tenure Type Adjustments | • Three Tenure Type Adjustments | |
| • Medical expenses imputation uses provincial data | • Medical expenses imputation uses territorial data |
References
Djidel, Samir, Burton Gustajtis, Andrew Heisz, Keith Lam, Isabelle Marchand and Sarah McDermott (2020), “Report on the second comprehensive review of the Market Basket Measure”. Catalogue No. 75F0002M2020002.
Djidel, Samir, Burton Gustajtis, Andrew Heisz, Keith Lam and Sarah McDermott (2019a), “Towards an update of the Market Basket”. Catalogue no. 75F0002M2019013.
Djidel, Samir, Burton Gustajtis, Andrew Heisz, Keith Lam and Sarah McDermott (2019b), “Defining disposable income in the Market Basket Measure”. Catalogue no. 75F0002M2019014.
Employment and Social Development Canada, 2018. “Opportunity for All – Canada’s First Poverty Reduction Strategy”, Cat. No. : SSD-212-08-18E.
Gustajtis, Burton, Keith Lam and Sarah McDermott (2021), “Proposals for a Northern Market Basket Measure and its disposable income”. Catalogue no. 75F0002M2021001.
Hatfield, Michael, Wendy Pyper and Burton Gustajtis. (2010), “First Comprehensive Review of the Market Basket Measure of Low Income”, Applied Research Branch paper, Human Resources and Skills Development Canada.
Heisz, Andrew (2019), “An update on the Market Basket Measure comprehensive review”. Catalogue no. 75F0002M2019009.
Statistics Canada, 2019. “Methodological changes to the Market Basket Measure in 2019”. Catalogue no. 75F0002M2019005
Statistics Canada, 2016. “Low Income Lines: What they are and how they are created”. Catalogue no. 75F0002M2016002
Statistics Canada, 2012. Northern Market Basket Measure Feasibility Study. Unpublished document.
UNECE (2011), “Canberra Group Handbook on Household Income Statistics”, Second Edition.
- Date modified: