
Income Research Paper Series
Market Basket Measure Technical Paper: The other necessities component
by Burton Gustajtis and Andrew Heisz
Skip to text
Text begins
The Market Basket Measure (MBM) establishes poverty thresholds based on the cost of a basket of food, clothing, shelter, transportation and other necessities for a family of four that reflects a modest, basic standard of living. A family with a disposable income below the appropriate MBM threshold for the size of the family and their region of residence is considered to be living in poverty.
This technical paper describes how the cost for “other necessities” is estimated in the 2018-base MBM. It provides a brief overview of the theory and application of techniques for estimating costs of “other necessities” in poverty lines and deconstructs the 2018-base MBM other necessities component to provide insights on how it is constructed. The aim of this paper is to provide a more detailed understanding of how the other necessities component of the MBM is estimated.
Introduction
The other necessities component estimates costs for goods and services that are not captured under the shelter, clothing, food, and transportation components (e.g., household items, personal care, reading materials, etc.). The methodology for pricing these other goods and services does not utilize the pricing of specific items as the other parts of the MBM. Doing so would be near impossible, as there are a large number of items that would potentially need to be priced, and many of the items would be considered necessities for some families but not for others. Consequently, the other necessities component is meant to approximate average expenditures on a wide range of other necessary goods and services, including those for cellular services.Note
The theory behind estimating the other necessities component
The MBM-2018 methodology uses price and quantity estimates to build costs for the shelter, clothing, food, and transportation components. In order to estimate the total poverty thresholds, the cost of necessary goods and services not covered within those components need to be estimated. There are a large number of goods and services that could be enumerated in the other necessities component. For example, anything from toilet paper to a telephone to a small amount for entertainment or cultural events could be included. In addition, the needs from family-to-family may vary according to a large number of factors. For example, male-only families would likely not need products used primarily by women, while adult-only households would likely not need school supplies for children. Therefore, since the products that could be included in a list of “other items” is so broad, rather than trying to enumerate them all, a more generic approach is used to get the final dollar amount for this component.
The most commonly used approach for estimating the income needed for goods and services, which are not directly enumerated under a poverty line methodology, is to base an amount on the observed EngelNote coefficient. The Engel coefficient represents the share of income or expenditures that are committed to food. This approach allows a cost to be estimated for a non-specified list of items, while basing it on a minimum standard (i.e., minimum nutritional requirements) for a major consumption group.
For many poverty lines currently in use, the cost of a nutritious diet is divided by the Engel coefficient to yield the poverty line. For example, in the 1960s, the United States designated their official poverty line based on work by statistician Mollie Orshansky as:
Rearranging the terms yields the following formula:
Next, replacing the Engel coefficient with:
where;
is the ratio of food expenditures to total expenditures
is food expenditures
is non-food expenditures
And rearranging the terms once again yields the following:
(1)
In this manner, the cost of items other than food is obtained with reference to the consumption habits of the reference population using a multiplier drawn from an appropriate data source, such as an expenditure survey. More specifically, the size of this “other” component equals the cost of the food basket multiplied by the multiplier.
The MBM application of the theory
The MBM uses a similar formula to the traditional Orshansky formula, but with several modifications to incorporate more available data (e.g., new minimum standards).
As a review, the total threshold costs for the MBM are calculated in the following way:
where;
(2)
In the terminology of the MBM, is commonly called the “other multiplier”, and values for and come from the Survey of Household Spending (SHS). The SHS is a national survey that gathers expenditure data of Canadians and is explained in more detail in the next section.
The above MBM equation (2) has been modified from the traditional Orshansky formula (1) in the following ways:
- In addition to directly pricing the food component, the accuracy of pricing for basic needs is improved by directly pricing the clothing, shelter and transportation components.
- The multiplier is only applied to the food and clothing components’ costs, in order to remove the geographical variation that would arise if the shelter and transportation components’ costs were also included in the formula.Note Consequently, the in the traditional model is replaced by , and is replaced by . The food costs in formula (1) are at the national level, while in formula (2) are at the sub-national level.
- Within the numerator of the multiplier , the expenditures on food, shelter, transportation, and clothing are removed and it only includes expenditure categories deemed to be necessary for meeting a basic modest lifestyle, thus reducing the size of the multiplier.Note This allows the numerator to better reflect the necessary expenditures not explicitly defined elsewhere.
- The multiplier components are defined for families of four in the second decile of income at the Canada level. This permits the estimate of the multiplier to reflect more closely the expenditures of persons at risk of poverty, not those with large incomes nor those in deep poverty.
- The multiplier does not account for cellular phone services as an “other necessity”.Note Therefore, a value is added in for this item.
Evolution over time of the Survey of Household Spending
To fully describe the remaining steps in calculating of the other necessities component, it is important to understand the evolution of the SHS, which is used to estimate the value of the other multiplier. Changes over time to the SHS have precipitated changes in the method for estimating the other necessities multiplier.
The SHS is a national survey that gathers information on the spending habits of Canadians. It looks at how much households pay for food, clothing, shelter, transportation, health care and other items.Note
From 2000 to 2009, the SHS was an interviewer-based survey where respondents were asked to provide estimates of their annual purchases of items. The expenditure data were then mapped to expenditure categories for different products and services. The SHS used a custom product classification system for its expenditure categories.
For the MBM, up to the 2009 reference year, the other multiplier was estimated using a three-year moving average based on the reference year and the two sequential prior years. The moving average was used to smooth the multiplier value over time, by reducing the variation which mostly came from sampling variability in the SHS survey.
Starting in 2010, the SHS underwent a redesignNote which made changes to the questionnaire and introduced a two-week diary. Products and services were now collected with respect to reference periods designed to make it easier for respondents to recall their expenditures more accurately (e.g., last week, month or year). The expenditure categories in the redesigned SHS were also updated to a new custom product classification.Note These changes to the concepts, recall periods and mode of collection yielded changes to data collection, processing and estimation methods, which in turn created a break in the expenditure data series.
| Year | Annual Ratio | Multiplier |
|---|---|---|
| 2010 to 2020 | Note ...: not applicable | 0.754 |
| 2009 | 0.783 | 0.742 |
| 2008 | 0.695 | 0.741 |
| 2007 | 0.748 | 0.758 |
| 2006 | 0.780 | 0.763 |
| 2005 | 0.745 | Note ...: not applicable |
| 2004 | 0.764 | Note ...: not applicable |
|
... not applicable Source: Statistics Canada. Survey of Household Spending (SHS), custom tabulation. |
||
At the time, it was recognised that these changes introduced by the redesigned SHS could have an unknown effect on the other multiplier values, and the new values would need to be assessed before being implemented. Furthermore, it was decided that this evaluation would occur during the next comprehensive review. Accordingly, starting in the 2010 reference year, the other multiplier was set to be a weighted average of the 2008 (with a weight of 1/3) and 2009 (with a weight of 2/3) values. The resulting value (0.754) was then held constant and used for the 2010 to 2020 reference year thresholds of the 2008-base MBM. Table 1 shows the history of the annual ratios and multipliers, under the 2008-base MBM methodology.
Calculating the other necessities component in the 2018-base
As indicated in the previous section, the other necessities multiplier in the 2008-base MBM was held unchanged from its reference-year 2010 value through to 2020, the last year the 2008-base MBM thresholds were available.
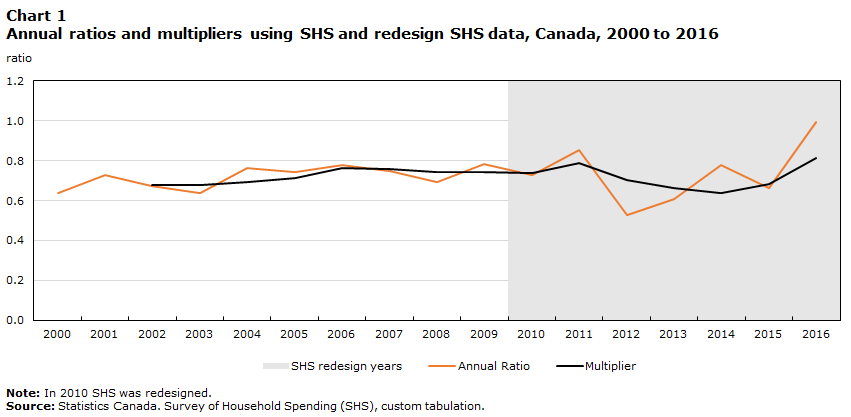
During the “second comprehensive review”Note an analysis was conducted to determine whether a conceptually consistent multiplier could be estimated using post-2009 SHS data. The resulting estimates from the SHS had high variability from year-to-year and low precision (i.e., the estimates had a large standard error) as shown in Chart 1. However, while the estimates for the other necessities multiplier varied post-2009, their average was relatively close to the 2010 multiplier value. Therefore, a statistically informed choice was made to estimate the 2018-base MBM’s other necessities component using the original 2010 multiplier value (0.754).Note
Data table for Chart 1
| Annual Ratio | Multiplier | |
|---|---|---|
| ratio | ||
| 2000 | 0.6 | Note ...: not applicable |
| 2001 | 0.7 | Note ...: not applicable |
| 2002 | 0.7 | 0.7 |
| 2003 | 0.6 | 0.7 |
| 2004 | 0.8 | 0.7 |
| 2005 | 0.7 | 0.7 |
| 2006 | 0.8 | 0.8 |
| 2007 | 0.7 | 0.8 |
| 2008 | 0.7 | 0.7 |
| 2009 | 0.8 | 0.7 |
| 2010 | 0.7 | 0.7 |
| 2011 | 0.9 | 0.8 |
| 2012 | 0.5 | 0.7 |
| 2013 | 0.6 | 0.7 |
| 2014 | 0.8 | 0.6 |
| 2015 | 0.7 | 0.7 |
| 2016 | 1.0 | 0.8 |
|
... not applicable Note: In 2010 SHS was redesigned. Source: Statistics Canada. Survey of Household Spending (SHS), custom tabulation. |
||
In addition, the 2018-base MBM methodology made two adjustments to the other necessities component, compared to the 2008-base MBM methodology. First, it held the 2018 reference year’s other necessities component’s cost constant and updated it with the annual provincial all-items Consumer Price Index (CPI) to make yearly adjustments.Note Second, cellular phone services expendituresNote were added to the other necessities component’s costs.Note Specifically, pooled data from the SHS for the 2015 to 2017 period was used to create a benchmark estimate of annual spending on cellular services for families in the second income decile. Table 2 shows the amounts added for cell phone costs. A validation exercise was done, using advertised prices, which showed that these annual amounts could purchase modest talk and text plans, and in some provinces it also provided an amount sufficient for some data for families with two-to-three users.
| Dollars | |
|---|---|
| Newfoundland and Labrador | 774 |
| Prince Edward Island | 1,003 |
| Nova Scotia | 1,115 |
| New Brunswick | 905 |
| Quebec | 833 |
| Ontario | 1,100 |
| Manitoba | 992 |
| Saskatchewan | 1,158 |
| Alberta | 1,311 |
| British Colombia | 1,121 |
|
|
Therefore, the value for the other component would be calculated for a family of four for any MBM region in reference year 2018 as follows:
- Refer to Table 11-10-0066-01Note and choose an MBM region. Select the current dollar values for the food and clothing components in reference year 2018, multiply the sum of these by 0.754.
- Adding to this amount the appropriate provincial cell phone expense value from Table 2, which produces the value of other necessities component for the base year (i.e., 2018).Note
- For other reference years, inflate or deflate this value using the annual provincial all-items CPI.
Deconstructing the other multiplier
To better understand the mechanics of the other necessities multiplier, this section provides a concrete example of how the multiplier was computed using 2009 SHS data and describes the impacts associated with making hypothetical changes to the multiplier’s numerator.
The averages used in the multiplier include responses by second income decile families and include zero expenditures for a given category. Therefore, the numbers represent typical expenditure patterns of families in the second income decile. For some expenditure categories (e.g., sports events, performing arts, home security equipment, etc.) these items also tend to be purchased less often by second-decile families, so they make only a small difference to the multiplier and, consequently, the overall MBM threshold.Note
Numerator: Average household expenditures on each of the 47 selected expenditure categories.
Denominator: Average expenditures on food purchased for consumption at home, average expenditures on selected clothing items/services and ½ the average expenditures on food purchased at restaurants and ½ the average expenditures on board paid to private households
Target population: Four person families in the second decile of income.
The decision to use the second decile was originally made because, since 1980, the before-tax Low Income Cut-offs rate for the MBM reference family (i.e., four persons) had never exceeded 15% (the 15th percentile being the mid-point of the second income decile).Note
Table 3 provides an example, using 2009 SHS expenditures, of the typical amounts spent on the different expenditure categories that make up the numerator and denominator of the other necessities multiplier. The expenditure amounts ranged from $1 for home security equipment to $1,171 for personal care items. Therefore, although some items may seem more subjective or nonessential, their impacts on the multiplier and, consequently, the other necessities component costs are marginal. For example, removing expenditures associated with arts and entertainment (e.g., movie theatres, live sports events, live performing arts, and admission to museums and other activities), the numerator would decrease by $306, which would change the 2009 annual ratio from 0.783 to 0.748. Doing a similar exercise to the 2008 ratio,Note holding all else constant, the other necessities multiplier currently in use would change from 0.754Note to 0.720,Note which would result in the 2018-base MBM’s other necessities component’s annual costs decreasing, on average, about $470 (4.0%) for reference year 2020 for a family of four. Although seemingly small, these additional amounts are intended to allow for social inclusion.
| Dollars | |
|---|---|
| Numerator | |
| Expenditure category description | |
| Purchase of telephones and equipment | 33 |
| Telephone services | 467 |
| Household cleaning supplies | 258 |
| Paper, plastic and foil household supplies | 309 |
| Other household supplies | 71 |
| Furniture | 564 |
| Rugs, mats and underpadding | 17 |
| Window coverings and household textiles | 100 |
| Room air conditioners, portable humidifiers and dehumidifiers | 8 |
| Microwave and convection ovens | 12 |
| Small electric food preparation appliances | 23 |
| Sewing machines, vacuum cleaners and other rug cleaning equipment | 11 |
| Other electric equipment and appliances | 20 |
| Attachments and parts for major appliances | 6 |
| Lamps and lampshades | 57 |
| Non-electric kitchen and cooking equipment | 52 |
| Cutlery, flatware and silverware | 29 |
| Non-electric cleaning equipment | 30 |
| Other household equipment, parts and accessories | 74 |
| Maintenance and repairs of furniture and equipment | 13 |
| Services related to furnishings and equipment | 36 |
| Other medicines and pharmaceutical products | 141 |
| Personal care | 1,171 |
| Sports and athletic equipment | 148 |
| Toys and children's vehicles | 140 |
| Electronic games and parts | 169 |
| Home entertainment equipment and services | 488 |
| Movie theatres | 138 |
| Live sports events | 19 |
| Live performing arts | 29 |
| Admission to museums and other activities | 119 |
| Rental of cablevision and satellite services | 462 |
| Bicycles, parts and accessories | 40 |
| Bicycle maintenance and repairs | 4 |
| Membership fees for sports and recreation facilities | 149 |
| Children's camps | 71 |
| Reading materials and other printed matter | 117 |
| Supplies | 54 |
| Textbooks | 122 |
| Service charges from banks | 92 |
| Contributions to charity | 275 |
| Postal and other communication services | 28 |
| Luggage | 55 |
| Home security equipment | 1 |
| Photographic goods and services | 156 |
| Internet services | 340 |
| Computer equipment and supplies | 197 |
| Numerator TotalTable 3 Note 3 | 6,916 |
| Denominator | |
| Expenditure category description | |
| Food purchased from stores | 6,161 |
| Women's and Girls' wear - Clothing | 714 |
| Women's and Girls' wear - Footwear | 204 |
| Women's and Girls' wear - Accessories | 64 |
| Men's and Boys' wear - Clothing | 597 |
| Men's and Boys' wear - Footwear | 175 |
| Men's and Boys' wear - Accessories | 35 |
| Children's wear - Clothing and cloth diapers | 155 |
| Children's wear - Footwear | 21 |
| Laundry and dry-cleaning service | 22 |
| Laundromats and self-service dry cleaning | 122 |
| Other clothing services | 17 |
| Board paid to private householdsTable 3 Note 4 | 51 |
| Food purchased from restaurantsTable 3 Note 4 | 1,046 |
| Denominator TotalTable 3 Note 3 | 8,834 |
| Annual Ratio | 0.783 |
|
|
Conclusion
This technical paper describes how the cost for “other necessities” is estimated in the 2018-base MBM. It provides a brief overview of the theory and application of techniques for estimating costs of “other necessities” in poverty lines and deconstructs the 2018-base MBM other necessities component to provide insights on how it is constructed. The paper is intended for use by persons interested in the details of how the other necessities component is estimated. Persons interested in contacting Statistics Canada on the topic of the MBM are encouraged to do so by sending an email to:
statcan.market.basket.measure-mesure.du.panier.de.consommation.statcan@statcan.gc.ca.
Appendix
| 2014 | 2015 | 2016 | |
|---|---|---|---|
| dollars | |||
| Numerator | |||
| Expenditure category description | |||
| Telephones and equipment | 66 | 87 | 200 |
| Landline telephone services | 379 | 391 | 306 |
| Household cleaning supplies and equipment | 149 | 191 | 259 |
| Paper, plastic and foil supplies | 262 | 285 | 396 |
| Other household supplies | 200 | 46 | 161 |
| Furniture | 854 | 375 | 591 |
| Rugs, mats and underpadding | 22 | 8 | 25 |
| Curtains and interior blinds | 0 | 1 | 0 |
| Linens | 5 | 40 | 4 |
| All other household furnishings | 6 | 44 | 0 |
| Room air conditioners, portable humidifiers and dehumidifiers | 58 | 18 | 9 |
| Microwave ovens | 10 | 11 | 12 |
| Other electric equipment and appliances (including parts and attachments) | 339 | 59 | 1,283 |
| Lamps and lampshades | 1 | 0 | 0 |
| Non-electric kitchen and cooking equipment | 29 | 139 | 113 |
| Other household equipment, parts and accessories | 58 | 147 | 797 |
| Maintenance and repairs of household furnishings and equipment | 0 | 0 | 0 |
| Services related to household furnishings and equipment | 66 | 130 | 88 |
| Non-prescribed medicines and pharmaceutical products | 137 | 465 | 590 |
| Personal care | 1,231 | 1,010 | 1,857 |
| Sports, athletic and recreation equipment | 268 | 8 | 0 |
| Children's toys | 352 | 54 | 1,178 |
| Video game systems and accessories (excluding for computers) | 125 | 25 | 0 |
| Home entertainment equipment and services | 443 | 167 | 151 |
| Movie theatres | 201 | 38 | 75 |
| Live sporting events | 236 | 0 | 2 |
| Live performing arts events | 1,058 | 0 | 0 |
| Admission fees to museums, zoos and other sites | 22 | 84 | 126 |
| Television and satellite radio services (including installation, service and pay TV charges) | 586 | 566 | 487 |
| Bicycles, parts and accessories | 67 | 27 | 80 |
| Bicycle maintenance and repairs | 0 | 0 | 0 |
| Dues and fees for sports and recreation facilities | 208 | 297 | 346 |
| Children's camps | 140 | 207 | 103 |
| Reading materials and other printed matter | 73 | 99 | 203 |
| School supplies | 60 | 62 | 4 |
| Textbooks | 53 | 39 | 121 |
| Service charges for banks and other financial institutions | 224 | 268 | 154 |
| Charitable contributions | 245 | 287 | 475 |
| Postal, courier and other communication services | 57 | 2 | 105 |
| Photographic goods and services | 94 | 92 | 114 |
| Internet access services | 629 | 597 | 699 |
| Computer equipment and supplies | 427 | 225 | 372 |
| Numerator TotalTable A.1 Expenditure categories in the numerator and denominator of an experimental MBM other component multiplier and their average expenditures1 by household2, Canada, 2014 to 2016 Note 3 |
9,439 | 6,593 | 11,488 |
| Denominator | |||
| Expenditure category description | |||
| Food purchased from stores | 7,800 | 6,013 | 6,542 |
| Clothing (women and girls) | 1,234 | 938 | 1,657 |
| Footwear (women and girls) | 381 | 313 | 439 |
| Accessories (women and girls) | 131 | 95 | 196 |
| Clothing (men and boys) | 769 | 650 | 1,074 |
| Footwear (men and boys) | 333 | 324 | 349 |
| Accessories (men and boys) | 55 | 16 | 82 |
| Clothing and cloth diapers | 289 | 226 | 173 |
| Footwear (children) | 76 | 20 | 82 |
| Laundry and dry-cleaning services | 41 | 23 | 12 |
| Laundromats and self-service dry cleaning | 66 | 14 | 66 |
| Clothing rental, tailoring, alteration services and other clothing services | 0 | 34 | 0 |
| Child care offered in private householdsTable A.1 Expenditure categories in the numerator and denominator of an experimental MBM other component multiplier and their average expenditures1 by household2, Canada, 2014 to 2016 Note 4 |
32 | 447 | 114 |
| Food purchased from restaurantsTable A.1 Expenditure categories in the numerator and denominator of an experimental MBM other component multiplier and their average expenditures1 by household2, Canada, 2014 to 2016 Note 4 |
1,872 | 2,136 | 1,656 |
| Denominator TotalTable A.1 Expenditure categories in the numerator and denominator of an experimental MBM other component multiplier and their average expenditures1 by household2, Canada, 2014 to 2016 Note 3 |
12,127 | 9,959 | 11,556 |
| Annual Ratio | 0.778 | 0.662 | 0.994 |
| Other necessities multiplier | Note ...: not applicable | Note ...: not applicable | 0.811 |
... not applicable
|
|||
References
Djidel, Samir, Burton Gustajtis, Andrew Heisz, Keith Lam, Isabelle Marchand and Sarah McDermott (2020), “Report on the second comprehensive review of the Market Basket Measure”. Catalogue no. 75F0002M2020002.
Djidel, Samir, Burton Gustajtis, Andrew Heisz, Keith Lam and Sarah McDermott (2019a), “Towards an update of the Market Basket”. Catalogue no. 75F0002M2019013.
Djidel, Samir, Burton Gustajtis, Andrew Heisz, Keith Lam and Sarah McDermott (2019b), “Defining disposable income in the Market Basket Measure”. Catalogue no. 75F0002M2019014.
Employment and Social Development Canada (2018), “Opportunity for All – Canada’s First Poverty Reduction Strategy”. Catalogue no. SSD-212-08-18E.
Hatfield, Michael (2002), “Constructing the Revised Market Basket Measure”. Applied Research Branch Strategic Policy Human Resources Development Canada.
Hatfield, Michael, Wendy Pyper and Burton Gustajtis (2010), “First Comprehensive Review of the Market Basket Measure of Low Income”. Applied Research Branch paper, Human Resources and Skills Development Canada.
Heisz, Andrew (2019), “An update on the Market Basket Measure comprehensive review”. Catalogue no. 75F0002M2019009.
Statistics Canada (2019), “Methodological changes to the Market Basket Measure in 2019”. Catalogue no. 75F0002M2019005.
UNECE (2017), “Guide on Poverty Measurement”.
- Date modified: