
Housing Statistics in Canada
The homeownership trajectories of recent immigrants
Text begins
Overview
This article examines homeownership among recent immigrants to Canada and their pathways leading up to homeownership. It combines information from the Canadian Housing Statistics Program on homeowners in seven provinces—Prince Edward Island, Nova Scotia, New Brunswick, Ontario, Manitoba, Alberta and British Columbia—with immigration data for individuals who were admitted as permanent residents from 2017 to 2021. This is the second in a series of articles published in Housing Statistics in Canada that investigate homeownership among newcomers to Canada.
Key findings
- From 2018 to 2021, the homeownership rate increased for recent immigrants and decreased for Canadian-born individuals. In Ontario, the homeownership rate for recent immigrants in the fifth year after admission rose from 35.7% in 2018 to 40.2% in 2021, while it fell from 50.7% to 47.8% for Canadian-born individuals.
- By their fifth year after admission to Canada, economic-class immigrants had homeownership rates comparable to those of Canadian-born individuals. In British Columbia, economic-class immigrants in their fifth year after admission had a homeownership rate of 40.1%, compared with 43.3% for Canadian-born individuals.
- By their fifth year after admission to Canada, recent immigrants in the Maritime provinces and Manitoba had homeownership rates similar to those of Canadian-born individuals. The homeownership gap between recent immigrants and Canadian-born individuals was larger in Ontario, Alberta and British Columbia.
- Immigrant homeownership rates varied significantly by province and by region of the world in which immigrants were born.
- Recent immigrant homebuyers had lower incomes but purchased more expensive homes than Canadian-born buyers. This difference may be associated with higher mortgage debt and lower retirement savings among recent immigrant homebuyers.
Introduction
For the past 25 years, Canada’s population growth has been largely driven by immigration (Statistics Canada, 2025a). From 2022 to 2024, Canada admitted a historic number of newcomers (Statistics Canada, 2024a). Though the number of admissions decreased in 2024, the rate of homeownership among those already admitted may increase as they spend more time in the country (Zhang and Hou, 2025).
Canada has long maintained policies designed to promote homeownership, such as capital gains tax exemptions on primary residences and mortgage loan guarantees (Evans and Wikander, 2024). Owning a home has been found to be associated with wealth accumulation (Statistics Canada, 2024b) and improved mental health (Montazer, 2022). For immigrants specifically, wealth is largely composed of housing equity (Morissette, 2019), and homeownership is often viewed as an indicator of economic integration into Canadian society (Edmonston and Lee, 2013). Moreover, recent research has linked changes in the share of immigrants within a municipality to changes in local rental costs and house prices (Hou, Koumaglo and Zhang, 2025).
This article—the second in a series on homeownership among newcomers—examines homeownershipNote among recent immigrants, using a new data linkage between the Canadian Housing Statistics Program and the Longitudinal Immigration Database. These administrative data sources allow for more granular and geographically disaggregated results on recent immigrant homeownership than were previously available. The first article in this series leveraged these data to analyze a previously unmeasured population, homeowners who were in Canada on a temporary basis (such as international students or foreign workers).
This study focuses on tax filers aged 25 to 54 in the reference year who were recent immigrants, that is, individuals who were in their first five years after admission as permanent residents (see Definitions section).Note The data cover Prince Edward Island, Nova Scotia, New Brunswick, Ontario, Manitoba, Alberta and British Columbia. Individuals are not followed longitudinally but are instead observed cross sectionally in 2021 based on snapshots taken in their first, third or fifth year after being admitted as permanent residents. The analysis captures the first two years of the COVID-19 pandemic, includes the large decrease in immigration in 2020 associated with pandemic-era travel restrictions and precedes the sharp increase in immigration that began in 2022. The results should be interpreted within the dynamic context of this period.
1 Homeownership trajectories
1.1 Homeownership in the first five years
Homeownership was more common for recent immigrants who had been in Canada longer. This is consistent with the idea that owning a home is typically preceded by a period of income growth, credit building and wealth accumulation in the host country. The highest homeownership rates were for recent immigrants living in the Maritime provinces and Manitoba. Homeownership among recent immigrants generally mirrored provincial trends among the Canadian-born population, who experienced higher ownership rates in the Maritime provinces and Manitoba and lower rates in Ontario and British Columbia. By their fifth year in Canada, recent immigrants in the comparatively more affordable Maritime provinces and Manitoba had homeownership rates similar to those of Canadian-born tax filers aged 25 to 54.
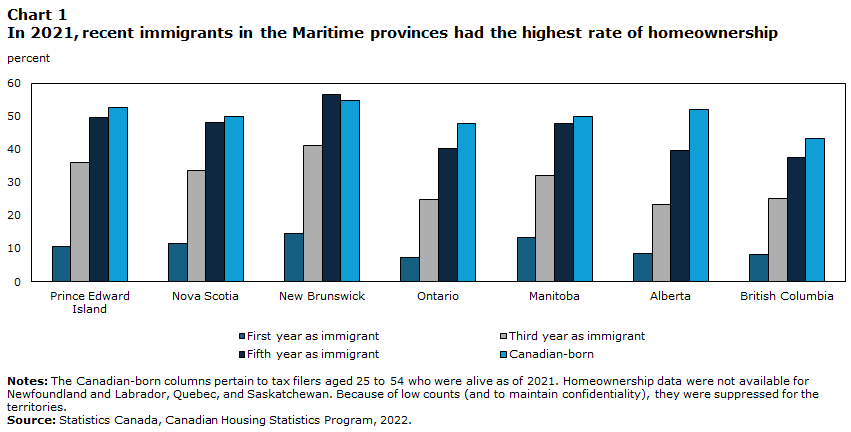
Data table for Chart 1
| Province | First year as immigrant | Third year as immigrant | Fifth year as immigrant | Canadian-born |
|---|---|---|---|---|
| percent | ||||
| Notes: The Canadian-born columns pertain to tax filers aged 25 to 54 who were alive as of 2021. Homeownership data were not available for Newfoundland and Labrador, Quebec, and Saskatchewan. Because of low counts (and to maintain confidentiality), they were suppressed for the territories.
Source: Statistics Canada, Canadian Housing Statistics Program, 2022. |
||||
| Prince Edward Island | 10.5 | 35.9 | 49.8 | 52.5 |
| Nova Scotia | 11.5 | 33.5 | 48.1 | 49.8 |
| New Brunswick | 14.5 | 41.3 | 56.6 | 54.8 |
| Ontario | 7.4 | 24.9 | 40.2 | 47.8 |
| Manitoba | 13.4 | 32.0 | 47.9 | 50.0 |
| Alberta | 8.3 | 23.4 | 39.7 | 51.9 |
| British Columbia | 8.2 | 25.0 | 37.5 | 43.3 |
Most immigrants who owned a home in their first year had previous Canadian experience. In each province covered, over 85% of those who owned homes in their first year as recent immigrants had already lived in Canada as non-permanent residents—on work or study permits, or on asylum claims—before being admitted as permanent residents.
1.2 Changes in the rate of homeownership across time
Recent immigrant cohorts had higher homeownership rates in 2021 than in 2018. In the three provinces for which multiple years of data were available—Nova Scotia, Ontario and British Columbia—recent immigrants were more likely to be homeowners in 2021 than in 2018, regardless of their arrival cohort.Note During this same period, the Canadian-born group experienced a decline in homeownership in all three provinces analyzed, a trend that began in 2011 and could be tied to housing costs outpacing wage growth (Statistics Canada, 2025a; Zhu, Chen and Su, 2025).
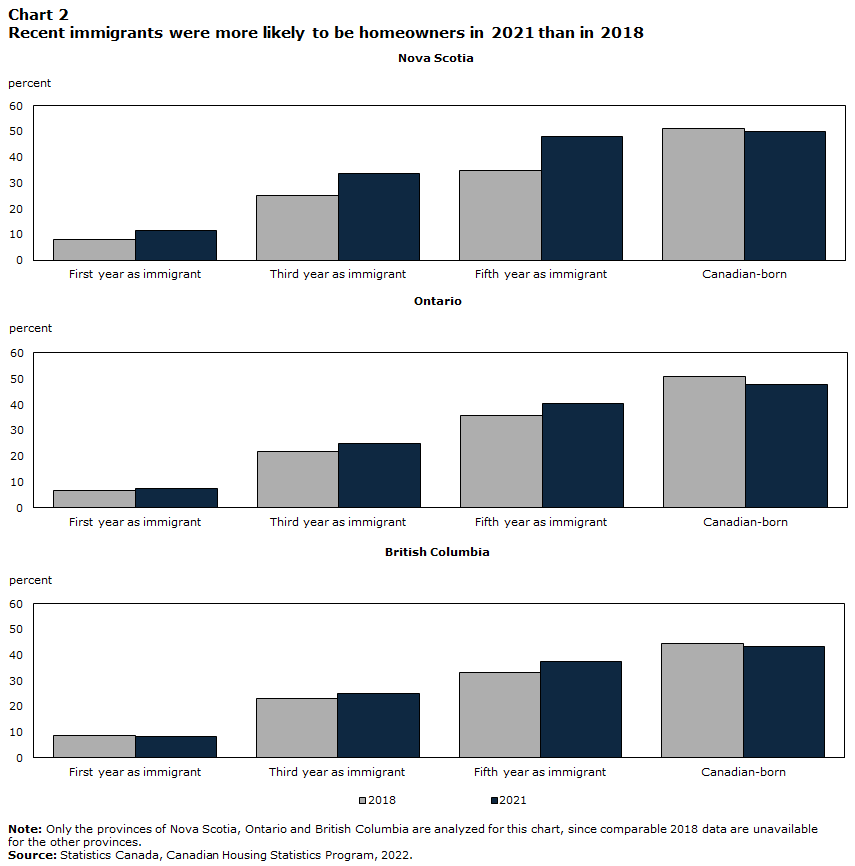
Data table for Chart 2
| Nova Scotia | Ontario | British Columbia | |
|---|---|---|---|
| percent | |||
| Note: Only the provinces of Nova Scotia, Ontario and British Columbia are analyzed for this chart, since comparable 2018 data are unavailable for the other provinces.
Source: Statistics Canada, Canadian Housing Statistics Program, 2022. |
|||
| 2018 | |||
| First year as immigrant | 8.18 | 6.70 | 8.65 |
| Third year as immigrant | 24.96 | 21.88 | 22.99 |
| Fifth year as immigrant | 34.78 | 35.70 | 33.39 |
| Canadian-born | 51.11 | 50.70 | 44.66 |
| 2021 | |||
| First year as immigrant | 11.49 | 7.38 | 8.20 |
| Third year as immigrant | 33.48 | 24.86 | 25.03 |
| Fifth year as immigrant | 48.12 | 40.25 | 37.54 |
| Canadian-born | 49.82 | 47.82 | 43.26 |
Yet recent immigrants experienced significant gains in wages during this same period. In Ontario, the median family income of recent immigrants was $61,000 in 2018 and $75,000 in 2021, a $14,000 increase.Note By comparison, the median family income of Canadian-born individuals in Ontario increased by $2,000, from $107,000 in 2018 to $109,000 in 2021.
Paired with historically low interest rates starting in 2020, the larger income gains among recent immigrants may have contributed to their increased homeownership rate in 2021, even as ownership rates declined among the Canadian-born population.
1.3 Homeownership rate by immigration class
By their fifth year in Canada, recent economic-class immigrants had homeownership rates comparable to those of Canadian-born individuals. Meanwhile, recent family-sponsored immigrants had the second-highest homeownership rates and refugees had the lowest, regardless of province or years since admission.Note Nonetheless, in several provinces, at least 1 in 10 refugees were homeowners after five years of settlement, including nearly 1 in 5 in Ontario.
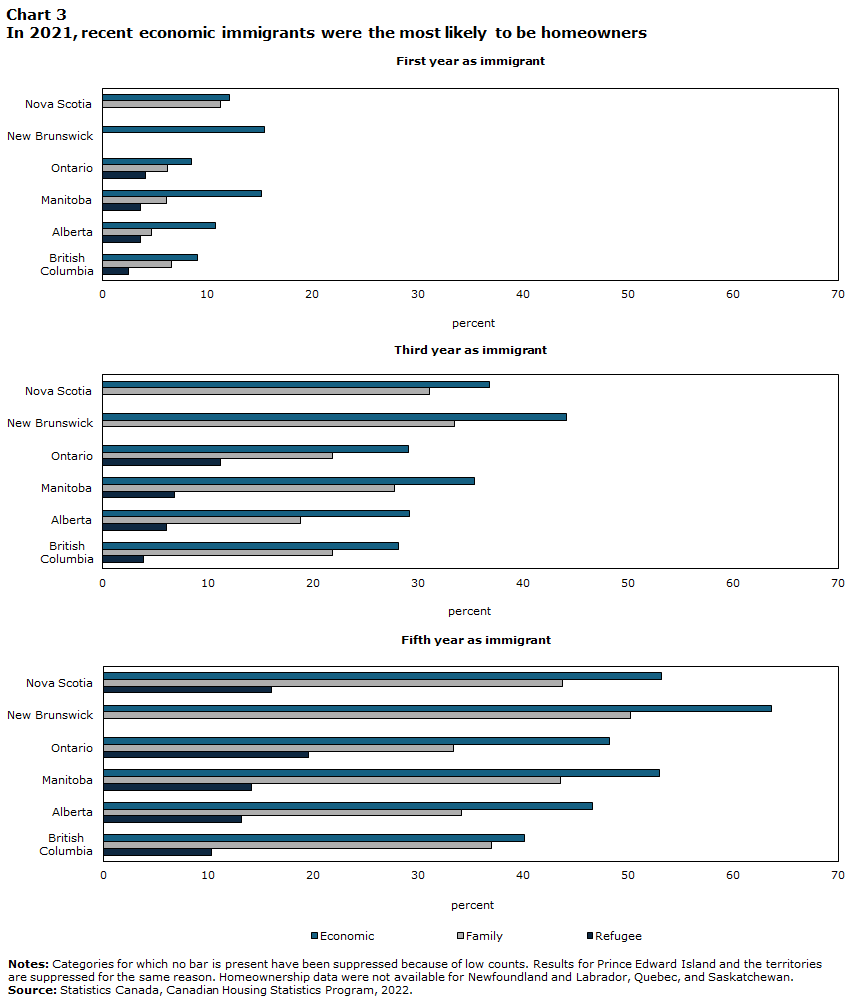
Data table for Chart 3
| First year as immigrants | Third year as immigrants | Fifth year as immigrants | |
|---|---|---|---|
| percent | |||
Source: Statistics Canada, Canadian Housing Statistics Program, 2022. |
|||
| Economic | |||
| Nova Scotia | 12.11 | 36.76 | 53.20 |
| New Brunswick | 15.37 | 44.09 | 63.66 |
| Ontario | 8.40 | 29.11 | 48.25 |
| Manitoba | 15.15 | 35.37 | 52.93 |
| Alberta | 10.70 | 29.16 | 46.64 |
| British Columbia |
9.00 | 28.10 | 40.11 |
| Family | |||
| Nova Scotia | 11.24 | 31.07 | 43.77 |
| New Brunswick | F too unreliable to be published | 33.46 | 50.23 |
| Ontario | 6.12 | 21.84 | 33.40 |
| Manitoba | 6.10 | 27.71 | 43.56 |
| Alberta | 4.61 | 18.79 | 34.08 |
| British Columbia |
6.50 | 21.87 | 36.94 |
| Refugee | |||
| Nova Scotia | F too unreliable to be published | F too unreliable to be published | 16.04 |
| New Brunswick | F too unreliable to be published | F too unreliable to be published | F too unreliable to be published |
| Ontario | 4.04 | 11.22 | 19.59 |
| Manitoba | 3.61 | 6.84 | 14.11 |
| Alberta | 3.55 | 6.07 | 13.18 |
| British Columbia |
2.46 | 3.84 | 10.36 |
1.4 Homeownership rate by world area of birth
There were significant differences in homeownership rates among recent immigrants based on their province of residence and their world area of birth (Chart 4).Note Note Some groups experienced comparable ownership rates across provinces. For example, South Asians in their fifth year after admission had homeownership rates from 46.0% in British Columbia to 53.8% in Ontario. Other groups exhibited larger geographic variation: the homeownership rates of Southeast AsiansNote in their fifth year ranged from 23.3% in Ontario to 59.9% in New Brunswick. Uncovering within-group, cross-provincial differences in homeownership rates is a novel contribution made possible by newly available administrative data sources on housing and immigration.
Several factors could be leading to such within-group geographic variation. The entry profile of recent immigrants (with respect to previous Canadian experience [Hou and Picot, 2024]), experiences of discrimination (Lewis and Moriah, 2024) and house prices (Canadian Real Estate Association, 2025), among other factors, may all vary across provinces. Exploring the interplay of these different factors requires complex modelling beyond the scope of this article.
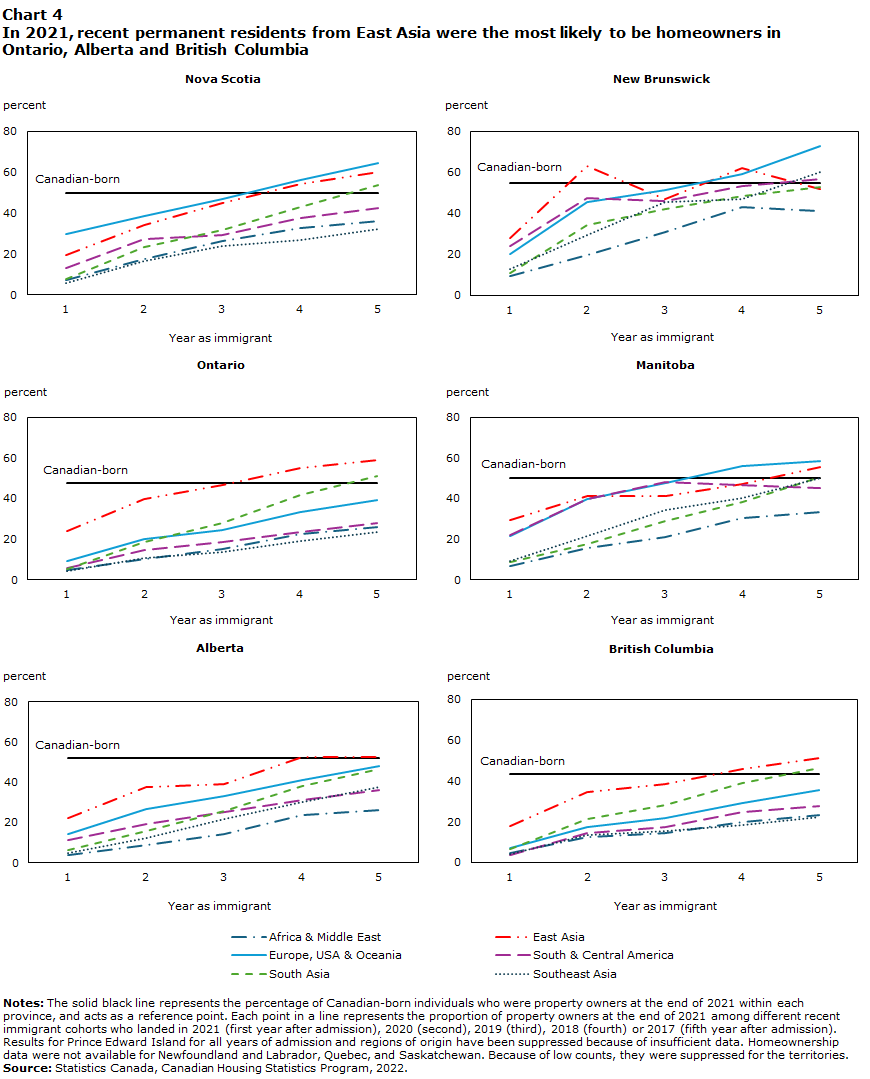
Data table for Chart 4
| Region of birth and year as immigrant | Nova Scotia | New Brunswick | Ontario | Manitoba | Alberta | British Columbia |
|---|---|---|---|---|---|---|
| percent | ||||||
| Notes: The solid black line represents the percentage of Canadian-born individuals who were property owners at the end of 2021 within each province, and acts as a reference point. Each point in a line represents the proportion of property owners at the end of 2021 among different recent immigrant cohorts who landed in 2021 (first year after admission), 2020 (second), 2019 (third), 2018 (fourth) or 2017 (fifth year after admission). Results for Prince Edward Island for all years of admission and regions of origin have been suppressed because of insufficient data. Homeownership data were not available for Newfoundland and Labrador, Quebec, and Saskatchewan. Because of low counts, they were suppressed for the territories.
Source: Statistics Canada, Canadian Housing Statistics Program, 2022. |
||||||
| Africa & Middle East | ||||||
| 1 | 6.97 | 9.39 | 4.59 | 6.85 | 3.98 | 4.69 |
| 2 | 17.37 | 19.73 | 10.38 | 15.53 | 8.70 | 12.59 |
| 3 | 26.02 | 30.72 | 15.14 | 21.04 | 14.31 | 14.42 |
| 4 | 32.56 | 42.95 | 22.51 | 30.21 | 23.64 | 20.01 |
| 5 | 36.06 | 41.35 | 25.92 | 33.53 | 26.23 | 23.14 |
| Canadian-born | ||||||
| 1 | 49.82 | 54.82 | 47.82 | 50.01 | 51.92 | 43.26 |
| 2 | 49.82 | 54.82 | 47.82 | 50.01 | 51.92 | 43.26 |
| 3 | 49.82 | 54.82 | 47.82 | 50.01 | 51.92 | 43.26 |
| 4 | 49.82 | 54.82 | 47.82 | 50.01 | 51.92 | 43.26 |
| 5 | 49.82 | 54.82 | 47.82 | 50.01 | 51.92 | 43.26 |
| East Asia | ||||||
| 1 | 19.23 | 27.89 | 23.81 | 29.23 | 21.97 | 17.77 |
| 2 | 34.21 | 63.30 | 39.83 | 41.07 | 37.71 | 34.61 |
| 3 | 44.72 | 47.18 | 46.66 | 41.31 | 39.24 | 38.42 |
| 4 | 53.99 | 62.24 | 54.83 | 46.91 | 52.73 | 45.77 |
| 5 | 59.84 | 51.79 | 59.19 | 55.26 | 52.57 | 51.35 |
| Europe, USA & Oceania | ||||||
| 1 | 29.48 | 20.39 | 8.93 | 21.30 | 14.06 | 6.97 |
| 2 | 38.37 | 45.69 | 19.80 | 39.54 | 26.44 | 17.30 |
| 3 | 46.77 | 51.44 | 24.68 | 47.42 | 33.03 | 21.68 |
| 4 | 56.07 | 59.19 | 33.48 | 55.95 | 40.92 | 29.11 |
| 5 | 64.29 | 72.96 | 39.04 | 58.30 | 48.13 | 35.45 |
| South & Central America | ||||||
| 1 | 12.84 | 24.06 | 5.95 | 21.79 | 11.36 | 3.76 |
| 2 | 27.39 | 47.31 | 14.43 | 39.67 | 19.27 | 14.53 |
| 3 | 29.29 | 46.23 | 18.33 | 48.07 | 24.96 | 17.39 |
| 4 | 37.72 | 53.24 | 23.57 | 46.69 | 31.04 | 24.82 |
| 5 | 42.57 | 56.82 | 28.04 | 45.30 | 36.07 | 27.76 |
| South Asia | ||||||
| 1 | 7.50 | 10.87 | 4.98 | 8.71 | 6.55 | 6.52 |
| 2 | 23.09 | 34.17 | 18.43 | 17.80 | 15.78 | 21.18 |
| 3 | 31.84 | 41.88 | 27.83 | 28.84 | 25.57 | 27.88 |
| 4 | 42.91 | 48.37 | 41.60 | 38.43 | 38.27 | 38.72 |
| 5 | 53.81 | 53.05 | 50.85 | 50.80 | 46.70 | 45.98 |
| Southeast Asia | ||||||
| 1 | 5.45 | 13.06 | 4.32 | 9.14 | 4.95 | 3.90 |
| 2 | 16.67 | 29.27 | 10.79 | 21.70 | 12.43 | 13.36 |
| 3 | 23.63 | 45.66 | 13.68 | 34.56 | 21.55 | 15.32 |
| 4 | 26.49 | 47.16 | 19.04 | 40.38 | 30.38 | 18.48 |
| 5 | 31.99 | 59.94 | 23.29 | 50.20 | 37.76 | 22.29 |
2 Pathways to homeownership
Recent immigrant first-time homebuyersNote paid more to purchase a homeNote while earning lower incomes than Canadian-born first-time homebuyers (Table 1).Note This section seeks to determine whether certain pathways to homeownership (such as buying in groups of three or more people or taking on more mortgage debt) are more common among recent immigrants. The analysis focuses on market sales in Nova Scotia, New Brunswick, Manitoba and British Columbia, where sales data are currently available from the Canadian Housing Statistics Program.
| Province | Recent immigrants | Canadian-born | ||||
|---|---|---|---|---|---|---|
| Median purchase price ($) | Median family income ($) | Median PFIR | Median purchase price ($) | Median family income ($) | Median PFIR | |
| dollars | number | dollars | number | |||
| Note: PFIR = price-to-family-income ratio.
Sources: Statistics Canada, Canadian Housing Statistics Program, T1 Family File and Longitudinal Immigration Database. |
||||||
| Nova Scotia | 390,000 | 105,000 | 3.53 | 285,000 | 110,000 | 2.53 |
| New Brunswick | 250,000 | 90,000 | 2.69 | 200,000 | 95,000 | 2.03 |
| Manitoba | 340,000 | 90,000 | 3.64 | 295,000 | 100,000 | 2.84 |
| British Columbia | 660,000 | 125,000 | 4.93 | 580,000 | 135,000 | 4.35 |
One way to attain homeownership despite lower incomes is to invest more in housing equity than in other investment vehicles. Indeed, recent immigrants who purchased a home in 2021 were less likely to contribute to a Registered Retirement Savings Plan (RRSP)Note in that year than Canadian-born homebuyers (Table 2).Note Prioritizing property over registered retirement savings may therefore represent a favoured pathway to homeownership among recent immigrants.Note
| Province | Recent immigrants | Canadian-born |
|---|---|---|
| percent | ||
| Note: The table pertains to tax-filing buyers aged 25 to 54 who were alive as of 2021.
Sources: Statistics Canada, T1 Family File and Longitudinal Immigration Database. |
||
| Nova Scotia | 28.3 | 43.5 |
| New Brunswick | 24.8 | 41.0 |
| Manitoba | 28.4 | 45.9 |
| British Columbia | 16.8 | 36.1 |
Pooling resources via group or off-market purchases does not seem to have been a major pathway to homeownership among recent immigrants.Note In 2021 in British Columbia, 5.9% of purchases among recent immigrants involved three or more buyers, compared with 8.5% among the Canadian-born population, a trend mirrored in other provinces.Note
Larger mortgage debt, however, may have been more common among recent immigrants.Note According to data from Statistics Canada surveys, homeowner households headed by recent immigrants younger than 35 yearsNote paid higher monthly mortgages in the period from 2018 to 2021 than comparable Canadian-born households (Table 3). A similar trend of higher recent immigrant mortgage debt also held with regard to the amount of the mortgage loan that remained to be repaid, also known as outstanding mortgage debt (see Appendix A).
| Year | Average monthly mortgage payment | |
|---|---|---|
| Recent immigrants | Canadian-born (ref.) | |
| dollars | ||
Sources: Statistics Canada, Canadian Housing Survey, 2018, 2021 and 2022; Survey of Financial Security, 2019 and 2023; and Canadian Income Survey, 2017 to 2021. |
||
| 2017 | 1,355 | 1,275 |
| 2018 | 1,640 Table 3 Note * | 1,335 |
| 2019 | 1,700 Table 3 Note * | 1,375 |
| 2020 | 2,060 Table 3 Note ** | 1,370 |
| 2021 | 1,920 Table 3 Note ** | 1,420 |
Another possibility is the use of unaccounted funds—specifically, accumulated wealth or undeclared income from abroad—to help make up the difference between declared income and purchase prices. Price-to-family-income ratios (PFIRs) provide an indirect test of this possibility.Note If the purchase price among recent immigrant first-time homebuyers is much higher than their declared annual family income, it may indicate greater use of unaccounted funds to purchase properties (but may also indicate a greater use of mortgage debt).Note In 2021, in British Columbia, the PFIRs for first-time homebuyers were 4.9 among recent immigrants and 4.4 among the Canadian-born population (similar trends were found in the other provinces; see Table 1).Note While the results suggest that unaccounted funds could play a role in explaining the difference in PFIRs, additional modelling work is needed to explore this hypothesis further.Note
In conclusion, these findings suggest that the recent immigrant path to homeownership is characterized by higher mortgage debt and a greater emphasis on building equity through the purchase of a principal residence rather than through retirement contributions. Consequently, recent immigrant buyers may have been more exposed to shifts in the housing market than their Canadian-born counterparts. In the short and medium term, higher purchase prices may have resulted in larger mortgages and higher monthly payments for many recent buyers. In the longer term, lower retirement savings and higher mortgage debt may tie the financial security of recent immigrant homeowners more closely to the value of their residential properties.Note
Appendix A
According to nationally representative surveys, average outstanding mortgage debt—that is, how much remains to be paid—for homeowner households with a mortgage headed by a recent immigrant or a Canadian-born person younger than 35 years was as follows:
| Year | Recent immigrants | Canadian-born | p-value |
|---|---|---|---|
| dollars | number | ||
| Notes: Statistical significance is calculated only for the difference between recent immigrant and Canadian-born households, for a particular year. Other differences, such as those among recent immigrants across multiple years, have not been assessed for statistical significance. The results pertain to a nationally representative sample (across Canada’s 10 provinces) of homeowner households that had a mortgage on their principal residence and that did not hold a second or third mortgage or more. The immigrant status and age of the principal respondent were applied to the entire household, and the sample was restricted to instances where the principal respondent was younger than 35.
Sources: Statistics Canada, Canadian Housing Survey, 2018, 2021 and 2022; and Survey of Financial Security, 2016, 2019 and 2023. |
|||
| 2016 | 320,000 | 230,000 | 0.000 |
| 2018 | 305,000 | 220,000 | 0.045 |
| 2019 | 315,000 | 240,000 | 0.121 |
| 2021 | 330,000 | 260,000 | 0.220 |
| 2022 | 400,000 | 310,000 | 0.109 |
| 2023 | 450,000 | 265,000 | 0.000 |
Because data on outstanding mortgage debt were available less frequently, a slightly longer interval of years is used. In addition, smaller survey sample sizes make it more difficult to establish statistically significant differences between estimates for the recent immigrant and Canadian-born subsamples, even though estimates of average outstanding mortgage debt were higher among recent immigrant households in all years analyzed.
Note to readers
The housing data in this study are compiled from the Canadian Housing Statistics Program (CHSP) for the 2022 reference year. The geographical coverage for homeowners in the study includes all provinces and territories (except Newfoundland and Labrador, Saskatchewan, and Quebec), while the geographical coverage for homebuyers is Nova Scotia, New Brunswick, Manitoba and British Columbia.
Permanent resident homeownership estimates are derived from linkage between the CHSP and the permanent resident landing file of the Longitudinal Immigration Database, up to the end of the 2021 reference year. The landing file includes all individuals who received permanent resident status from 1980 onward. For the 2021 reference year, if a recent immigrant received their permanent resident status in 2021, they were considered to be in their first year after admission, those who received it in 2019 were in their third year and those who received it in 2017 were in their fifth year.
For the Canadian-born population and immigrants, the province in which income taxes were filed was taken to be the province of residence. Information on the tax province of an individual was obtained through linkage to the T1 Family File. Consequently, this study is limited to individuals aged 25 to 54 years in the reference year who filed income taxes. The income tax-filing rates of permanent residents in the first five years after arrival were 80% to 90% for the 2021 reference year, varying by province and by time since admission as a permanent resident.
To ensure confidentiality, all domains and subcategories used to derive results—for example, the number of immigrants in their third year after admission as permanent residents who own homes, reside in Alberta and arrived as refugees (the numerator in a homeownership proportion calculation)—include at least 30 individuals. Figures were suppressed when this threshold was not met.
The CHSP disseminates data based on the geographical boundaries from the Standard Geographical Classification 2021. The CHSP database does not contain information about residential properties on reserves.
For this article, a non-standard geographical classification of world areas of birth was used, and it comprises six categories: East Asia (including China, Taiwan, Hong Kong, Japan, North Korea, South Korea, Macao and Mongolia); South Asia (including Bangladesh, Bhutan, the British Indian Ocean Territory, Sri Lanka, India, Maldives, Nepal, Pakistan and Tibet); Southeast Asia (including Brunei Darussalam, Myanmar, Cambodia, Indonesia, Laos, Malaysia, the Philippines, Timor-Leste, Singapore, Viet Nam and Thailand); Africa and the Middle East (including all countries on the African continent and surrounding island nations, as well as Afghanistan, Azerbaijan, Bahrain, Armenia, Cyprus, Georgia, the West Bank and Gaza, Iran, Iraq, Israel, Kazakhstan, Jordan, Kuwait, Kyrgyzstan, Lebanon, Oman, Qatar, Saudi Arabia, Syria, the United Arab Emirates, Türkiye, Turkmenistan, Uzbekistan, and Yemen); South and Central America (including all countries in the Americas south of the United States of America and all Caribbean island nations); and Europe, the United States and Oceania (including all European countries, the United States, and all Oceanic states and territories).
In this paper, multiple survey sources were combined to increase the accuracy of an estimate. This was done using the “separate approach” methodology and accompanying best practices described by Binder and Roberts (2009), and Wendt (2007). Under the separate approach, an estimate was sought as the linear combination of M survey estimates:
where are survey estimates with true, finite design-based variance . After verifying that the survey estimates are contextually consistent and stochastically independent, the coefficients (non-negative and summing to 1) resulting in the lowest variance for the combined estimate can be derived using Lagrange multipliers:
This is intuitively sound, as the most accurate estimate should have the largest coefficient. In practice, the true variances are unknown and must be estimated from the corresponding survey sources. Because the estimated variance is expected to be close to the true variance, and the optimization’s objective function is relatively flat in the neighbourhood around its optimum, the coefficients calculated using the variance estimates are expected to be reasonable choices as the nearly optimal values. Finally, for each combined estimate, the estimated variance was verified to ensure it was lower than that of the most precise individual estimate, as there is no general guarantee that the combined estimate will improve on the estimates to be combined.
Definitions
Recent immigrants are defined for this article as all individuals who received permanent resident status in the five years prior to the reference year, were alive and filed income taxes in the reference year, and were aged 25 to 54. This age range represents the prime working years, when most homes are bought by those who ultimately become homeowners.
Canadian-born individuals are non-immigrants and include individuals born in Canada and individuals born outside Canada to Canadian citizens who received Canadian citizenship by descent. This group is limited to people aged 25 to 54 who were alive and filed income taxes in the reference year.
A homeowner or residential property owner refers, for this analysis, to an individual who owns one or more residential properties, excluding those who own only vacant land. This definition includes only individuals whose names appear on property titles and exclude others (such as spouses) who reside in an owned property but whose name does not appear on the title.
First-time homebuyer refers to a person who purchased a residential property during the reference period and did not previously own a residential property in the analyzed provinces. This includes buyers who claimed the Home Buyers’ Amount and buyers whose spouse or common-law partner was a buyer in the same sale and who claimed the amount.
Market sale refers to an arm’s length transaction where all parties act independently with no influence over the other.
References
Canadian Real Estate Association [CREA] (2025). Canadian Housing Market Stats [Dataset]. CREA. https://www.crea.ca/housing-market-stats/canadian-housing-market-stats
Costa-Font, Joan, Paola Giuliano and Berkay Ozcan (2018). “The cultural origin of saving behavior.” PLOS One, 13(9), e0202290. https://doi.org/10.1371/journal.pone.0202290
Edmonston, Barry, and Sharon M. Lee (2013). “Immigrants’ transition to homeownership, 1991 to 2006.” Canadian Studies in Population, 40(1-2), 57-74. ttps://journals.library.ualberta.ca/csp/index.php/csp/article/view/19632/15172
Evans, Joshua, and Pablo Wikander (2024). “The Housing Vulnerability Deadlock: A View from Canada.” Housing, Theory and Society, 41(4), 469-485. https://doi.org/10.1080/14036096.2023.2282645
Frenette, Marc (2018). “Economic immigrants in gateway cities: Factors involved in their initial location and onward migration decisions.” Analytical Studies Branch Research Series. Statistics Canada Catalogue no. 11F0019M. https://www150.statcan.gc.ca/n1/pub/11f0019m/11f0019m2018411-eng.htm
Gordon, Joshua C. (2020). “Reconnecting the housing market to the labour market: Foreign ownership and housing affordability in urban Canada.” Canadian Public Policy, 46(1), 1-22. https://doi.org/10.3138/cpp.2019-009
Gougeon, Annik, and Oualid Moussouni (2021a). “Residential real estate sales in 2018: Who is purchasing real estate?” Housing Statistics in Canada. Statistics Canada Catalogue no. 46-28-0001. https://www150.statcan.gc.ca/n1/pub/46-28-0001/2021002/article/00002-eng.htm
Gougeon, Annik, and Oualid Moussouni (2021b). “Residential real estate sales in 2018: The relationship between house prices and incomes.” Housing Statistics in Canada. Statistics Canada Catalogue no. 46-28-0001. https://www150.statcan.gc.ca/n1/pub/46-28-0001/2021002/article/00003-eng.htm
Haan, Michael (2007). “The homeownership hierarchies of Canada and the United States: The housing patterns of White and non-White immigrants of the past thirty years.” International Migration Review, 41(2), 433-465. https://doi.org/10.1111/j.1747-7379.2007.00074.x
Haan, Michael, Yuchen Li, and Lindsay Finlay (2024). “Stay a while: The retention of immigrants in rural Canada.” Journal of International Migration and Integration, 25(2), 715-736. https://doi.org/10.1007/s12134-023-01099-5
Hou, Feng (2025). “From Temporary to Permanent Residency: Recent Trends in Canada’s Two-Step Immigration Selection.” Centre of Excellence on the Canadian Federation. Data Brief no. 3, September 2025. https://centre.irpp.org/research-studies/from-temporary-to-permanent-residency/
Hou, Feng, and Garnett Picot (2024). “Earnings of one-step and two-step economic immigrants: Comparisons from the arrival year.” Economic and Social Reports. Statistics Canada Catalogue no. 36-28-0001. https://www150.statcan.gc.ca/n1/pub/36-28-0001/2024001/article/00006-eng.htm
Hou, Feng, Évamé Koumaglo and Haozhen Zhang (2025). “Immigration and housing prices across municipalities in Canada.” Immigration, Refugees and Citizenship Canada (IRCC) Research Reports. Project reference number: R6-2023. https://www.canada.ca/en/immigration-refugees-citizenship/corporate/reports-statistics/research/immigration-housing-prices-municipalities-canada.html
Huber, Stefanie J., and Tobias Schmidt (2022). “Nevertheless, they persist: Cross-country differences in homeownership behavior.” Journal of Housing Economics, 55, 101804. https://doi.org/10.1016/j.jhe.2021.101804
Khalid, Aisha, Joshua Gordon and Michael Mirdamadi (2024). “Intergenerational housing outcomes in Canada: Parents’ housing wealth, adult children’s property values and parent–child co-ownership.” Housing Statistics in Canada. Statistics Canada Catalogue no. 46-28-0001. https://www150.statcan.gc.ca/n1/pub/46-28-0001/2024001/article/00002-eng.htm
Ley, David (2011). Millionaire migrants: Trans-Pacific life lines. John Wiley & Sons.
Li, Yuchen, Michael Haan and Teresa Abada (2025). “Homeownership amongst second-generation immigrants in Canada.” Housing Studies, 40(5), 1111-1131. https://www.doi.org/10.1080/02673037.2024.2337271
Montazer, Shirin (2022). “Immigration, Homeownership, and Mental Health.” Socius, 8, 1-16. https://www.doi.org/10.1177/23780231221139361
Morissette, René (2019). “The Wealth of Immigrant Families in Canada.” Analytical Studies Branch Research Paper Series. Statistics Canada Catalogue no. 11F0019M—No. 422. https://www150.statcan.gc.ca/n1/pub/11f0019m/11f0019m2019010-eng.htm
Statistics Canada (2022, September 21). “To buy or to rent: The housing market continues to be reshaped by several factors as Canadians search for an affordable place to call home.” The Daily. https://www150.statcan.gc.ca/n1/daily-quotidien/220921/dq220921b-eng.htm
Statistics Canada (2024a, March 27). “Canada’s population estimates: Strong population growth in 2023.” The Daily. https://www150.statcan.gc.ca/n1/daily-quotidien/240327/dq240327c-eng.htm
Statistics Canada (2024b, October 29). “Survey of Financial Security, 2023.” The Daily. https://www150.statcan.gc.ca/n1/daily-quotidien/241029/dq241029a-eng.htm
Statistics Canada (2024c). Table 46-10-0062-01. Residential property buyers: Demographic data, first-time home buyer status, and price-to-income ratio.[Data table]. https://doi.org/10.25318/4610006201-eng
Statistics Canada (2025a). Research to Insights: Wages in Canada, 1981 to 2024. Research to Insights. Statistics Canada Catalogue no. 11-613-X. https://www150.statcan.gc.ca/n1/pub/11-631-x/11-631-x2025003-eng.htm
Statistics Canada (2025b, December 8). “The median entry wage of new immigrants decreased by 10.6% in 2023 but remained above its pre-COVID-19 pandemic level.” The Daily. https://www150.statcan.gc.ca/n1/daily-quotidien/251208/dq251208a-eng.htm
Statistics Canada (2025c). Table 46-10-0099-01. Price-to-income ratio of residential property buyers by first-time home buyer status. [Data table]. https://doi.org/10.25318/4610009901-eng
Tweedle, Jesse, Amélie Lafrance-Cooke, Rebecca Oakes and Attila Imecs (2023). “Immigrant credit visibility: Access to credit over time in Canada.” Economic and Social Reports. Statistics Canada Catalogue no. 36-28-0001. https://www150.statcan.gc.ca/n1/pub/36-28-0001/2023009/article/00001-eng.htm
Uppal, Sharanjit (2019). “Homeownership, mortgage debt and types of mortgage among Canadian families.” Insights on Canadian Society. Statistics Canada Catalogue no. 75-006-X. https://www150.statcan.gc.ca/n1/pub/75-006-x/2019001/article/00012-eng.htm
Zhang, Haozhen, and Feng Hou (2025). “Housing use of immigrants and non-permanent residents in ownership and rental markets.” Economic and Social Reports. Statistics Canada Catalogue no. 36-28-0001. https://www150.statcan.gc.ca/n1/pub/36-28-0001/2025005/article/00003-eng.htm
Zhang, Xuelin (2023). “Recent trends in families’ contributions to three registered savings accounts.” Income Research Paper Series. Statistics Canada Catalogue no. 75F0002M. https://www150.statcan.gc.ca/n1/pub/75f0002m/75f0002m2023008-eng.htm
Zhu, Yushu, Minheng Chen and Haofeng Su (2025). “The big contradiction between the dream and the reality of homeownership: Access to homeownership in Canada, 1986–2016.” Housing Studies, 40(11), 2528-2556. https://doi.org/10.1080/02673037.2024.2415048
- Date modified: