
Economic and Social Reports
Earnings of one-step and two-step economic immigrants: Comparisons from the arrival year
DOI: https://doi.org/10.25318/36280001202400100006-eng
Text begins
Abstract
Since the early 2000s, the two-step immigration selection process, through which economic immigrants are chosen from the pool of temporary foreign workers, has expanded rapidly. Previous research indicated that following their landing, high-skilled two-step immigrants had higher earnings than comparable one-step immigrants—those directly selected from abroad. However, an important question that has not been fully examined is whether the earnings advantage of two-step immigrants over one-step immigrants persisted if the two groups were compared from their arrival year rather than the year when they became permanent residents. At that point, neither group possessed any Canadian work experience, eliminating its potential influence on their earnings differences. The results of this study reveal that two-step immigrants consistently had higher annual earnings than their one-step counterparts within the same admission class when the comparison started from their initial arrival year. These earnings differences, although reduced, remained substantial after accounting for sociodemographic differences between the two groups and after 10 years following the initial arrival. Furthermore, these patterns generally held across successive arrival cohorts. The conclusion includes a discussion of the implications of these findings and explores potential reasons for these outcomes.
Keywords: two-step immigration selection, immigrants, Canadian work experience, earnings
Authors
Feng Hou is with the Social Analysis and Modelling Division, Analytical Studies and Modelling Branch, at Statistics Canada. Garnett Picot is with the Research and Data Branch at Immigration, Refugees and Citizenship Canada.
Acknowledgments
The authors would like to thank René Morissette at Statistics Canada, Tammy Anstey and Youn-Young Park in the Permanent Economic Immigration Branch at Immigration, Refugees and Citizenship Canada for their advice and comments on an earlier version of this paper.
Introduction
The expansion of the two-step immigration selection process has been a major development in the way economic immigrants are selected in Canada (Hou, Crossman & Picot, 2020a). In this approach, economic immigrants are chosen from the pool of temporary foreign workers (TFWs) and international students with some Canadian work experience. The percentage of economic principal applicants who were selected with pre-landing Canadian work experience increased from 12% in 2000 to around 60% in the late 2010s (Chart 1). The proportion rose to 78% in 2021 largely because of the COVID-19 pandemic.Note The growing two-step immigration selection was the driving factor behind the improvement in immigrant economic outcomes at landing since 2000 (Hou, Crossman & Picot, 2020b). Immigrants who had high-paying or high-skilled jobs during their time as TFWs (two-step immigrants) displayed superior post-migration labour market outcomes than comparable immigrants selected directly from abroad (one-step immigrants). The same result does not apply to low-wage or low-skilled two-step immigrants (Hou, Crossman & Picot 2020b; Sweetman & Warman, 2014).

Data table for Chart 1
| Year of gaining permanent residency | All economic immigrants | Economic principal applicants | Spouses and dependants |
|---|---|---|---|
| percent | |||
| 2000 | 5.7 | 11.7 | 1.2 |
| 2001 | 5.5 | 11.3 | 1.2 |
| 2002 | 5.7 | 11.6 | 1.3 |
| 2003 | 6.6 | 13.3 | 1.6 |
| 2004 | 8.0 | 16.0 | 2.2 |
| 2005 | 7.2 | 15.2 | 2.0 |
| 2006 | 11.3 | 22.8 | 3.3 |
| 2007 | 13.1 | 25.9 | 3.8 |
| 2008 | 15.7 | 31.1 | 4.4 |
| 2009 | 17.9 | 34.5 | 5.1 |
| 2010 | 16.6 | 32.9 | 4.5 |
| 2011 | 16.6 | 32.8 | 4.5 |
| 2012 | 20.2 | 39.8 | 5.8 |
| 2013 | 24.2 | 44.8 | 7.2 |
| 2014 | 33.3 | 57.4 | 10.1 |
| 2015 | 32.3 | 58.3 | 9.6 |
| 2016 | 32.0 | 58.4 | 10.1 |
| 2017 | 40.4 | 67.1 | 12.8 |
| 2018 | 35.7 | 58.2 | 11.9 |
| 2019 | 35.9 | 56.6 | 13.1 |
| 2020 | 46.6 | 66.8 | 20.6 |
| 2021 | 71.1 | 88.4 | 35.8 |
| Source: Statistics Canada, Longitudinal Immigration Database. | |||
There are at least two potential explanations of why skilled two-step immigrants outperform one-step immigrants with otherwise similar characteristics such as education, official language ability and source region.
The first explanation relates to the concept of a multiple selection process (Hou & Bonikowska, 2018). Two-step selection can improve the match between immigrant skills and labour market demands because employers can directly assess TFWs’ skills and intangible qualities. At the same time, these foreign workers can experience life in Canada before committing to permanent residency. Immigrants who excel as TFWs are less likely to encounter challenges related to the transferability of their skills, an issue often faced by one-step immigrants.
The second explanation centres on the advantage gained by acquiring a head start in Canadian work experience. Two-step immigrants have already accumulated several years of work experience in Canada before attaining permanent residency (i.e., at the time of landing). Since Canadian work experience is a strong predictor of immigrants’ earnings, these individuals have an advantage over one-step immigrants who lack this prior exposure.
Previous research typically assessed economic outcomes of immigrants after their landing year. Since the objective is to provide information that will potentially improve the selection of permanent residents (PRs), it is necessary to know their economic outcomes as PRs. In making the selection decision, the system is confronted with two types of applicants: those who have prior Canadian work experience and those who do not. The issue is which group will have better outcomes after immigration, in the short and longer run. Therefore, the landing year has mostly been used as the starting point of comparison in previous research. However, the comparison starting from the landing year could not answer the question of whether two-step immigrants still outperform one-step immigrants in earnings if they are compared following the arrival year, when neither group has any Canadian work experience.
One previous study conducted a partial examination of the earnings differences between the two groups based on the arrival year (Hou & Bonikowska, 2018). It found that skilled TFWs who first arrived in the 1990-to-2006 period had a large earnings advantage over one-step economic immigrants from the arrival year, and that this advantage persisted even 15 years after arrival. However, non-skilled TFWs had lower initial earnings and slower earnings growth than comparable one-step immigrants. One limitation of the study is that it relied on the occupational skill level listed in employer-specific work permits to identify skilled and non-skilled TFWs, but this approach was not suitable for TFWs with open work permits, which do not specify occupations.
More broadly, one- and two-step immigrants are often selected through different economic immigration programs that have large impacts on earnings. Specifically, the Canadian Experience Class (CEC) and Live-in Caregiver Program (LCP) are applicable to two-step immigrants but not to one-step immigrants. CEC immigrants often have high earnings, but LCP immigrants have low earnings. It is not appropriate to compare either group with one-step immigrants, where these classes do not exist. A better comparison is between one- and two-step immigrants in the same admission class, in particular the Federal Skilled Worker Program (FSWP) and Provincial Nominee Program (PNP)—two major programs applicable to one- and two-step immigrants.
This article compares earnings of one- and two-step economic immigrants from the year of arrival, with a focus on the comparison within major admission classes. It further examines whether the results of the comparison have changed across arrival cohorts from the 2000s to the 2010s. Significant changes in immigration programs, including the introduction of the CEC in 2008, the expansion of the PNP and the implementation of the Express Entry system in 2015, may have altered the composition of one- and two-step immigrants and thus affected their relative earnings.
The analysis uses the Longitudinal Immigration Database and focuses on economic principal applicants aged 25 to 54 in the year of arrival. In this article, two-step immigrants refer to those who initially came to Canada with a work permit, or who came with a study permit and had earnings in Canada, and subsequently became economic immigrants.Note One-step immigrants refer to economic immigrants without any Canadian work or study experience before obtaining permanent residency. For two-step immigrants, the year of arrival is the year when the first work permit was issued or the year when the first study permit was issued if the study permit holder did not have a work permit but reported earnings. For one-step immigrants, the year of arrival is the year of landing.
Large changes in the distribution by admission program
Table 1 shows large shifts in admission programs for one- and two-step immigrants from the 2000s to the 2010s. Among one-step immigrants, there was a substantial decrease in the proportion of immigrants admitted through the FSWP (from 70% to 51%), accompanied by a large increase in the PNP (from 6% to 25%).
| One-step immigrants | Two-step immigrants | |
|---|---|---|
| percent | ||
| 2000-to-2009 arrivals | ||
| Canadian Experience Class | 0.0 | 7.4 |
| Federal Skilled Worker Program | 70.0 | 18.1 |
| Provincial Nominee Program | 5.7 | 24.3 |
| Caregiver programs | 0.0 | 42.5 |
| Other economic programs | 24.4 | 7.7 |
| 2010-to-2014 arrivals | ||
| Canadian Experience Class | 0.0 | 22.0 |
| Federal Skilled Worker Program | 41.0 | 6.7 |
| Provincial Nominee Program | 22.0 | 35.9 |
| Caregiver programs | 0.0 | 23.2 |
| Other economic programs | 37.1 | 12.1 |
| 2015-to-2019 arrivals | ||
| Canadian Experience Class | 0.0 | 39.4 |
| Federal Skilled Worker Program | 52.7 | 8.0 |
| Provincial Nominee Program | 24.9 | 32.0 |
| Caregiver programs | 0.0 | 5.3 |
| Other economic programs | 22.5 | 15.3 |
| Source: Statistics Canada, Longitudinal Immigration Database. | ||
Among two-step immigrants, over the same period, there was a substantial decrease in the proportion admitted through the LCP (from 43% to 5%) and the FSWP (from 18% to 8%). At the same time, there was a considerable increase in the proportions in the CEC (from 7% to 39%) and the PNP (from 24% to 32%).
These large changes in the admission program composition among one- and two-step immigrants affected average and median earnings, because immigrants in different admission programs have very different earnings levels.
Two-step immigrants earned more than one-step immigrants in the Federal Skilled Worker Program and Provincial Nominee Program
When in the same admission programs, two-step immigrants consistently had higher earnings than one-step immigrants, both in the initial years and a decade after their arrival (Table 2).Note This pattern held true for the FSWP, PNP and “other” economic programs (e.g., Federal Skilled Trades Program and Quebec selection), and for all three arrival cohorts used in the analysis. It also held true for unadjusted (raw) results and adjusted results (after accounting for differences in sociodemographic characteristics).
| Arrival cohorts and year since arrival | One-step immigrants | Two-step immigrants | ||||||||
|---|---|---|---|---|---|---|---|---|---|---|
| All | FSWP | PNP | Others | All | CEC | FSWP | PNP | Caregivers | Others | |
| 2020 dollars | ||||||||||
| 2000-to-2009 arrivals | ||||||||||
| 1 | 25,700 | 27,400 | 29,200 | 20,200 | 27,200 | 38,300 | 48,400 | 42,200 | 20,800 | 36,400 |
| 2 | 32,000 | 34,700 | 32,900 | 25,400 | 29,100 | 42,900 | 54,700 | 44,000 | 21,700 | 41,400 |
| 3 | 36,700 | 40,000 | 35,800 | 29,700 | 31,700 | 45,700 | 58,400 | 46,000 | 22,200 | 44,900 |
| 4 | 41,200 | 45,000 | 38,400 | 33,800 | 35,900 | 49,400 | 63,100 | 48,800 | 24,900 | 48,200 |
| 5 | 45,000 | 49,400 | 40,200 | 37,200 | 39,300 | 53,100 | 67,600 | 51,800 | 27,800 | 51,100 |
| 6 | 48,600 | 53,300 | 42,300 | 40,500 | 41,900 | 56,800 | 71,100 | 54,500 | 30,100 | 54,000 |
| 7 | 51,400 | 56,300 | 43,300 | 43,200 | 43,900 | 60,100 | 74,200 | 56,000 | 31,900 | 56,300 |
| 8 | 53,600 | 58,700 | 44,200 | 45,600 | 45,400 | 62,600 | 76,400 | 56,600 | 33,600 | 58,500 |
| 9 | 55,700 | 60,600 | 45,300 | 48,200 | 47,000 | 64,400 | 78,800 | 57,900 | 35,200 | 60,900 |
| 10 | 57,500 | 62,400 | 46,200 | 50,400 | 48,500 | 66,600 | 80,700 | 58,900 | 36,900 | 64,200 |
| 2010-to-2014 arrivals | ||||||||||
| 1 | 23,700 | 26,100 | 27,100 | 18,700 | 31,100 | 43,800 | 39,700 | 35,300 | 23,400 | 35,300 |
| 2 | 29,000 | 33,200 | 31,900 | 23,300 | 35,200 | 50,000 | 50,000 | 39,500 | 24,000 | 40,400 |
| 3 | 33,200 | 38,300 | 34,500 | 27,900 | 38,700 | 54,700 | 55,600 | 42,600 | 25,100 | 43,600 |
| 4 | 37,400 | 43,400 | 36,700 | 32,700 | 42,600 | 59,500 | 63,400 | 45,300 | 28,900 | 47,300 |
| 5 | 40,800 | 47,400 | 38,600 | 37,000 | 45,600 | 63,800 | 68,700 | 47,900 | 32,000 | 51,000 |
| 6 | 44,200 | 50,800 | 40,200 | 41,100 | 48,400 | 67,700 | 74,500 | 50,300 | 33,900 | 54,500 |
| 2015-to-2019 arrivals | ||||||||||
| 1 | 32,300 | 39,400 | 30,500 | 23,000 | 40,700 | 50,800 | 49,600 | 38,900 | 25,000 | 30,300 |
| 2 | 39,969 | 50,429 | 36,552 | 29,052 | 46,037 | 57,634 | 61,664 | 42,674 | 26,763 | 33,551 |
|
Notes: FSWP: Federal Skilled Worker Program; PNP: Provincial Nominee Program; CEC: Canadian Experience Class. Others includes the Federal Skilled Trades Program, Quebec selection and the business class. Source: Statistics Canada, Longitudinal Immigration Database. |
||||||||||
Regarding the unadjusted results (Table 2), for immigrants arriving from 2000 to 2009, the absolute gap in median earnings between two- and one-step immigrants remained relatively stable over the 10 years following arrival. It amounted to between $18,000 and $21,000 for the FSWP and between $11,000 and $13,000 for the PNP. For the 2010-to-2014 cohort, the earnings gap increased with years spent in Canada.Note
However, the relative gap—expressed as a percentage difference—decreased rapidly within the first five years and more gradually thereafter. The adjusted and unadjusted gaps are shown in charts 2 and 3 based on average earnings. The adjusted results are derived from a regression model that controls for differences in sociodemographic characteristics between one- and two-step immigrants.Note
The adjusted gap is somewhat smaller than the unadjusted gap because, compared with one-step immigrants, two-step immigrants had more characteristics associated with higher earnings. For example, in the 2010-to-2014 cohort of FSWP immigrants, two-step immigrants were younger at arrival,Note were more likely to be male, had a higher percentage with English or French as their mother tongue, and had a larger proportion from South Asia and Southeast Asia, compared with one-step immigrants. These differences accounted for 41% of the earnings gap between the two groups in the first year after arrival and 63% in the sixth year.
After accounting for sociodemographic differences (adjusted results), among the 2000-to-2009 cohort, two-step immigrants in the PNP earned 51% more on average than their one-step counterparts in the first year after arrival, and 25% more in the sixth year, after which the difference remained stable (Chart 2). A similar pattern was observed for those in the FSWP, although the numbers were somewhat different. The 2010-to-2014 cohort also displayed a similar pattern. In the PNP and the FSWP, two-step immigrants earned about 39% to 45% more than one-step immigrants in the first year after arrival, falling to 17% to 19% in the sixth year (Chart 3).
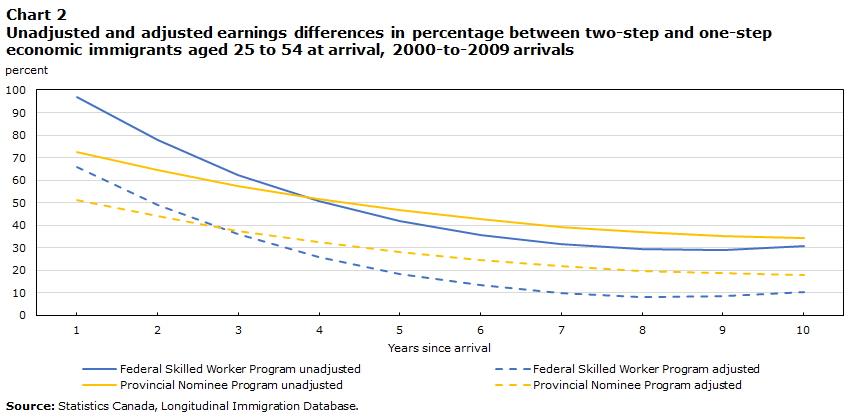
Data table for Chart 2
| Years since arrival | Federal Skilled Worker Program | Provincial Nominee Program | ||
|---|---|---|---|---|
| unadjusted | adjusted | unadjusted | adjusted | |
| percent | ||||
| 1 | 97.0 | 65.9 | 72.6 | 51.4 |
| 2 | 77.6 | 49.0 | 64.4 | 43.9 |
| 3 | 62.5 | 36.0 | 57.5 | 37.6 |
| 4 | 50.8 | 26.0 | 51.5 | 32.4 |
| 5 | 42.0 | 18.5 | 46.6 | 28.0 |
| 6 | 35.7 | 13.3 | 42.6 | 24.5 |
| 7 | 31.5 | 9.9 | 39.3 | 21.9 |
| 8 | 29.3 | 8.3 | 36.9 | 19.9 |
| 9 | 29.1 | 8.4 | 35.2 | 18.7 |
| 10 | 30.7 | 10.2 | 34.1 | 18.1 |
| Source: Statistics Canada, Longitudinal Immigration Database. | ||||
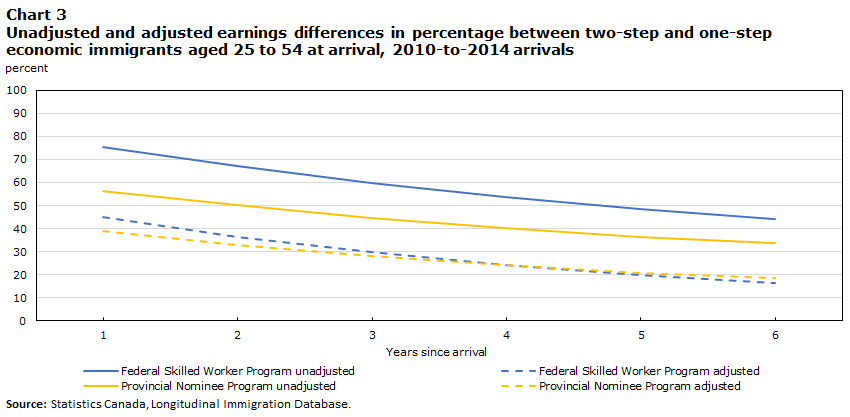
Data table for Chart 3
| Years since arrival | Federal Skilled Worker Program | Provincial Nominee Program | ||
|---|---|---|---|---|
| unadjusted | adjusted | unadjusted | adjusted | |
| percent | ||||
| 1 | 75.5 | 44.8 | 56.5 | 39.0 |
| 2 | 67.0 | 36.5 | 50.0 | 33.1 |
| 3 | 59.7 | 29.6 | 44.6 | 28.1 |
| 4 | 53.6 | 24.1 | 40.2 | 24.1 |
| 5 | 48.5 | 19.8 | 36.5 | 20.9 |
| 6 | 44.4 | 16.6 | 33.7 | 18.5 |
| Source: Statistics Canada, Longitudinal Immigration Database. | ||||
The differences in initial earnings between two- and one-step immigrants narrowed from the 2000-to-2009 arrival cohort to the 2010-to-2014 arrival cohort for the FSWP and PNP (charts 2 and 3). This change likely occurred because fewer high-skilled TFWs (who generally have high post-immigration earnings) applied through either the FSWP or PNP since they became eligible to apply through the CEC starting in 2009, reducing their number in the FSWP and PNP in the more recent arrival cohorts. Before 2009, they had to apply through either the FSWP or the PNP.
From the 2010-to-2014 cohort to the 2015-to-2019 cohort, the first-year earnings gap between two- and one-step immigrants in the FSWP decreased further, as one-step immigrants experienced a large increase in earnings (Table 2). This was likely caused by the implementation of a mandatory pre-migration educational credential assessment in 2013, which resulted in a substantial rise in earnings among one-step immigrants. However, this increase did not apply to two-step immigrants, likely because their educational qualifications had already been directly assessed by employers (Banerjee et al., 2021).
If the unadjusted earnings of all two-step immigrants are compared with those of all one-step immigrants—that is, differences in admission programs are not considered—then among the 2000-to-2009 cohort, one-step immigrants earned more than two-step immigrants (Table 2). This was because two-step immigrants included caregivers who had low earnings, and their large proportion lowered the overall earnings of all two-step immigrants below those of their one-step counterparts. However, in the 2010-to-2014 and 2015‑to‑2019 cohorts, two-step immigrants overall had higher earnings than one-step immigrants, despite the differences in admission classes. This occurred because the proportion of LCP immigrants among two-step immigrants decreased substantially in the more recent cohorts. These results make it clear that comparing the unadjusted results of all one- and two-step immigrants is not a valid assessment of the earnings differences between the two groups because of their differences in selection programs and socioeconomic backgrounds.
Conclusion
Two-step immigrants in the FSWP and the PNP consistently had higher annual earnings than their one-step counterparts within the same admission class when the comparison begins from the year of their initial arrival. This result held for unadjusted (actual) and adjusted earnings when sociodemographic differences between the groups are considered.
The earnings gaps narrowed somewhat across successive arrival cohorts. From the 2000‑to‑2009 cohort to the 2010-to-2014 cohort, the earnings gaps between two- and one-step immigrants in the initial years following arrival narrowed in the FSWP and PNP. This change can be attributed to a shift in the types of programs through which two-step immigrants were admitted. Notably, after 2008, high-skilled TFWs could apply through the CEC, reducing the share of two-step immigrants with high earnings potential in the FSWP and PNP. Moreover, the earnings differences between two- and one-step immigrants in the FSWP diminished further from the 2010-to-2014 cohort to the 2015-to-2019 cohort. This reduction was likely caused by the introduction of a mandatory pre-migration educational credential assessment in 2013, which resulted in a significant improvement in the earnings of one-step immigrants.
As noted in the introduction, there are two major hypotheses regarding why two-step immigrants tend to earn more than one-step immigrants following landing. One explanation relates to the multiple selection processes applied to two-step immigrants. The second refers to the advantage gained by two-step immigrants because of their Canadian work experience, which one-step immigrants do not have at the time of landing. Since neither one- nor two-step immigrants have any Canadian work experience when earnings are evaluated from the arrival year, the adjusted earnings difference observed in this study is consistent with the multiple selection process hypothesis.
For example, the earnings gaps between one- and two-step immigrants were large during the first few years after arrival (a 40% to 60% adjusted gap) and decreased with years since arrival, although they persisted (close to 20% in the sixth year). Differences in the selection process may be responsible. TFWs are typically chosen by employers for jobs that match their skill level from the beginning, especially those with higher skills. This is not always true for one-step immigrants, who may need time to adapt to the Canadian labour market, making their skills less immediately applicable. Consequently, there is a significant earnings disparity between these two groups in the initial years after their arrival. This disparity tends to diminish, but does not disappear, in the long term.
The analysis points to the importance of producing adjusted results. Making earnings comparisons between one- and two-step immigrants without accounting for differences in admission classes and other sociodemographic characteristics does not provide a valid evaluation of the effect of the one- and two-step processes on earnings. More generally, earlier research has emphasized the importance of differentiating between two-step immigrants based on the quality of their pre-immigration Canadian work experience, assessed through the level of their pre-immigration Canadian earnings. This metric is likely indicative of the “realized market value” of immigrants’ skills and qualifications (Hou & Picot, 2016; Picot et al., 2020).
While two-step immigrants have demonstrated better labour market outcomes than one-step immigrants with similar human capital factors—whether measured from the arrival or landing year—the sustained success of the two-step selection process depends on the skill level of immigrants chosen from the pool of TFWs. Previous research indicates that TFWs engaged in low-skilled or low-paying jobs generally face lower earnings and slower earnings growth than comparable one-step immigrants (Hou & Bonikowska, 2018). Also, the increasing presence of TFWs and international students in the labour force poses potential challenges (see Crossman, Hou & Picot [2020] for an overview). There is a risk that TFWs may be vulnerable to exploitation and substandard working conditions. A large supply of TFWs could exert downward pressure on the wages of domestic workers and reduce incentives for employers to enhance productivity through technology and capital investment. Employers seeking low-cost labour may prioritize short-term demand over long-term competitiveness. Consequently, employer-sponsored programs may not effectively address the long-term needs of the labour market and the broader economy. These considerations suggest the need for a careful examination of the benefits and potential challenges of two-step immigration selection.
References
Banerjee, R., Hou, F., Reitz, J., & Zhang, T. (2021). Evaluating foreign skills: Effects of credential assessment on skilled immigrants’ labour market performance in Canada. Canadian Public Policy.
Crossman, E., Hou, F., & Picot, G. (2020). Two-step Immigration Selection: A Review of Benefits and Potential Challenges. Statistics Canada: Economic Insights, Catalogue no. 11‑626‑X — 2020009 - no. 111.
Hou, F., & Bonikowska, A. (2018). Selections before the selection: Earnings advantages of immigrants who were former skilled temporary foreign workers in Canada. International Migration Review, 52(3): 695–723.
Hou, F., Crossman, E., & Picot, G. (2020a). Two-step Immigration Selection: An Analysis of Its Expansion in Canada. Economic Insights, no. 112. Statistics Canada Catalogue no. 11-626-X. Ottawa: Statistics Canada.
Hou, F., Crossman, E., & Picot, G. (2020b). Two-step Immigration Selection: Recent Trends in Immigrant Labour Market Outcomes. Economic Insights, no. 113. Statistics Canada Catalogue no. 11-626-X. Ottawa: Statistics Canada.
Hou, F., & Picot, G. (2016). Changing immigrant characteristics and pre-landing Canadian earnings: Their effect on entry earnings over the 1990s and 2000s. Canadian Public Policy, 42(3): 308–232.
Picot, G., Hou, F., Xu, L., & Bonikowska, A. (2020). Which immigration selection factors best predict the earnings of economic principal applicants? Immigration, Refugees and Citizenship Canada. Policy Research Branch.
Sweetman, A., & Warman, C. (2014). Former temporary foreign workers and international students as sources of permanent immigration. Canadian Public Policy, 40(4): 392–407.
- Date modified: