
Housing Statistics in Canada
Residential real estate sales in 2018: Who is purchasing real estate?
by Annik Gougeon and Oualid Moussouni
Investment,
Science and Technology Division
Overview
The Canadian Housing Statistics Program (CHSP) uses new data on sales to explore the characteristics of properties sold and their buyers in a three-part series. As the second part of this series, this article examines the profile of buyers who purchased a residential property from January 1 to December 31, 2018, in Nova Scotia, New Brunswick and British Columbia. New insights are provided on differences by sex, number of buyers as part of a sale, family type, first-time home buyers and immigration status.
Key findings
- Couple families with children who purchased residential properties showed important differences between the income of male and female buyers, particularly in British Columbia.
- First-time home buyers had higher incomes compared with repeat buyers in British Columbia, whereas the opposite was true in Nova Scotia and New Brunswick.
- A minority of buyers purchased a property alone in the three provinces. In New Brunswick, 35.5% of buyers purchased a property on their own, compared with 25.3% in British Columbia, where properties were almost four times more expensive.
- British Columbia had the largest share of purchases made by a group of three or more buyers. Such purchases were more prevalent amongst immigrant than non-immigrant buyers.
- Immigrants purchased more expensive properties compared with non-immigrants. These properties were newer, and tended to be located in metropolitan areas with broader access to social services, community support and jobs. Most immigrant buyers were admitted to Canada through economic entry categories where the applicants are highly skilled and have previous work experience.
Introduction
For the first time, the Canadian Housing Statistics Program (CHSP) is providing information on real estate buyers and properties purchased from January 1 to December 31, 2018, in Nova Scotia, New Brunswick and British Columbia. The first part of this three-part series provided an overview of properties sold and their characteristics, including geographic distributions, property types, sale prices and living areas.
This second article provides a profile of the buyers in a residential property market sale.Note Non-individual buyers (such as firms and governments) represented a small share of all buyers, 6.5% in Nova Scotia, and 4.4% in New Brunswick and British Columbia. The remainder of the analysis focuses on individual (persons) resident buyers.
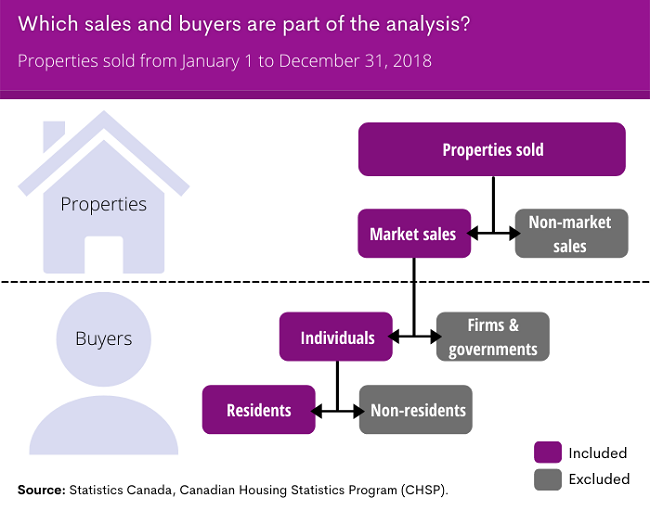
Description of the infographic
The title of this infographic is "Which sales and buyers are part of the analysis?"The infographic lists the different types of sales and buyers and defines which ones are included or excluded from the analysis. The first half of the imageshows that properties can be sold either via market or non-market sales: only market sales are included in the analysis. Focusing on market sales, the second half of the image shows that buyers may be either individuals or firms and governments: only individuals are included in the analysis. Finally, individual buyers may be residents or non-residents: only residents are included in the analysis.
The infographic shows how one arrives at the subset of properties and buyers that are part of the analysis.
In the legend, the colour purple is assigned to sales and buyers that are included in the analysis and the colour grey is assigned to sales and buyers that are excluded from the analysis.
Detailed information on the profile of home buyers has been a long standing data gap in Canada. By addressing this gap, this article provides insights that can support decision making by builders, urban planners and governments. Moreover, it provides insights on some of the challenges faced by home buyers and those who seek homeownership. These findings will serve as a point of comparison to determine the effects of the pandemic and its aftermath on the real estate sector and consumer preferences.
The first section of this article explores income and home price differences by sex and family type. The second section examines the number of buyers as part of a sale. The third section provides an overview of first-time home buyers and their incomes, while the fourth section explores the incomes and sale prices of properties purchased by immigrants.
Section 1: Income and home price differences by sex and family type
The literature on income inequality between men and women is well documented, with studies showing that the income gap has narrowed over time in many Organisation for Economic Co-operation and Development countries (Fortin, 2005). Still, there continues to be a gap even if women have higher educational attainments and have increased their participation in higher paying industries in Canada (Pelletier et al., 2019). Despite progress in narrowing the income gap, there are important differences between women and men when it comes to home buying.
Females represented under half of the buyers in Nova Scotia (48.4%) and New Brunswick (47.4%), this being slightly below their shares of the overall population, at 51.6% in Nova Scotia and 51.1% in New Brunswick.Note In British Columbia, the share of male and female buyers was more similar, with females constituting 50.1% of the buyers, while representing 51.0% of the total population. Overall, females accounted for a slightly smaller share of home buyers relative to the total population in all three provinces.
Female buyers have lower incomes than male buyers, but purchase similarly priced homes
Male and female buyers bought similarly priced properties in all three provinces, as shown by Table 1. By contrast, the median income of male buyers was higher than that of female buyers, especially in British Columbia, where the income of male buyers was over 50% higher than that of female buyers.
The income gap between male and female buyers narrowed when excluding those who reported no employment income.Note Buyers who did not report employment income represented a smaller share of the buyers, ranging from 14.8% in New Brunswick, to 17.2% in British Columbia. When including only buyers who reported employment income, the income gap between male and female buyers decreased from the shares shown in Table 1 to 34.2% in Nova Scotia, 31.1% in New Brunswick, and to 44.5% in British Columbia.
| Province | Sex | Median sale price | Median income | Difference in median income between males and females |
|---|---|---|---|---|
| dollars | percent | |||
| Nova Scotia | Female | 180,000 | 46,500 | 40.0 |
| Male | 175,000 | 65,100 | ||
| New Brunswick | Female | 145,000 | 44,400 | 34.9 |
| Male | 140,000 | 59,900 | ||
| British Columbia | Female | 542,000 | 46,800 | 51.7 |
| Male | 542,000 | 71,000 | ||
| Source: Statistics Canada, Canadian Housing Statistics Program (CHSP). | ||||
Couples with children have the largest income gap between male and female buyers
Pelletier et al. (2019) showed that more than two-thirds of the gender wage gap in Canada could not be explained by factors measured in the data.Note Looking at family composition, Frank and Frenette (2021) reported that women in 2-parent households with at least 1 child younger than 5 years old assumed most of the household responsibilities, with over a third of couples reporting that women performed most of the child care tasks.
By isolating for family type and the presence of children, CHSP data shows that the income gap between male and female buyers was most pronounced among couples with children in the three provinces. Male buyers in couple families with children had an income 45.5% higher than female buyers in couple families with children in New Brunswick, while the gap reached 69.1% in British Columbia. However, the presence of children alone was not sufficient in explaining these income differences: as Chart 1 shows, income gaps were smallest among lone parents.

Data table for Chart 1
| Province | Couple families without children | Couple families with children | Lone parents | Lone individuals |
|---|---|---|---|---|
| percent | ||||
| Nova Scotia | 40.1 | 54.0 | 7.6 | 16.1 |
| New Brunswick | 40.0 | 45.5 | 14.0 | 16.1 |
| British Columbia | 44.8 | 69.1 | 20.2 | 36.0 |
| Source: Statistics Canada, Canadian Housing Statistics Program (CHSP). | ||||
Section 2: Number of buyers as part of a sale
To further explore income differences between male and female home buyers, and to account for properties purchased by multiple buyers, the number of buyers involved in a sale is analyzed in this section. This analysis distinguishes between buyers that are single, paired (i.e., female–male, female–female and male–male) and groups involving three or more individuals.Note
Female–male paired buyers have the largest income differences
Paired buyers accounted for most of home buyers in all three provinces, as shown in Chart 2. Female–male buyers accounted for over 90% of all paired buyers and purchased the most expensive properties. Males in female–male pairs earned significantly more than their female counterparts in Nova Scotia (+53.3%), New Brunswick (+44.7%) and British Columbia (+60.8%).
Of all paired buyers, female–female buyers earned the lowest income in the three provinces and purchased the lowest priced properties in Nova Scotia and British Columbia. By comparison, male–male paired buyers earned a median individual income ranging from 8.9% higher in Nova Scotia to 23.6% higher in British Columbia relative to female–female buyers.

Data table for Chart 2
| Province | Single buyers | Paired buyers | Buyers in groups of three or more |
|---|---|---|---|
| percent | |||
| Nova Scotia | 30.7 | 65.2 | 4.1 |
| New Brunswick | 35.5 | 60.7 | 3.8 |
| British Columbia | 25.3 | 64.5 | 10.2 |
| Source: Statistics Canada, Canadian Housing Statistics Program (CHSP). | |||
British Columbia has the smallest share of buyers who purchased a property on their own, and the highest share of grouped buyers
British Columbia had the lowest share of lone-person home buyers, with a quarter of buyers purchasing a property on their own. One possible explanation is the higher property prices in the province, which can make homeownership more challenging for a single-earner household. By comparison, over a third of buyers were lone home buyers in New Brunswick, where property prices were significantly lower.
British Columbia also had the largest share of buyers purchasing residential properties in groups of three or more, more than double the proportions observed in Nova Scotia and New Brunswick. Buyers who purchased a property in a group of three or more had the lowest median individual incomes in all three provinces, as shown in Table 2. By combining their individual incomes, these buyers had the highest total incomes, thereby increasing their buying power. Buyers who purchased a property in such groups acquired properties with the highest median price in British Columbia.
| Number of buyers as part of a sale | Median individual income | Median total incomeTable 4 Note1 | ||||
|---|---|---|---|---|---|---|
| Nova Scotia | New Brunswick | British Columbia | Nova Scotia | New Brunswick | British Columbia | |
| dollars | dollars | |||||
| Single female | 53,700 | 48,000 | 53,000 | 53,700 | 48,000 | 53,000 |
| Single male | 64,200 | 59,300 | 73,500 | 64,200 | 59,300 | 73,500 |
| Female–male | 54,900 | 51,400 | 57,900 | 115,000 | 107,000 | 123,000 |
| Female–female | 48,200 | 46,000 | 50,000 | 104,000 | 94,600 | 107,000 |
| Male–male | 52,500 | 51,000 | 61,800 | 109,000 | 108,000 | 135,000 |
| Groups of three or more buyers | 46,700 | 42,800 | 48,200 | 169,000 | 162,000 | 174,000 |
| ||||||
Section 3: Income differences between first-time home buyers and repeat buyers
The comparison between first-time home buyers and repeat buyers provides insights into the difficulties of entering the real estate market. While repeat buyers may leverage equity and capital gains earned from previous homeownership, first-time home buyers must economize funds to cover the down payment and their subsequent mortgage. Another consideration is that repeat buyers may own multiple properties where additional income is earned. To mediate the difficulties of entering the real estate market, the Canadian government has implemented a number of initiatives aimed at first-time home buyers.Note Still, there continue to be important differences between first-time home buyers and repeat buyers, especially where property prices are higher, such as in British Columbia.
First-time home buyers represent a smaller share of buyers in British Columbia, compared with Nova Scotia and New Brunswick
The proportions of buyers who claimed the home buyers' amount (HBA), or purchased a property with an individual who claimed the home buyers' amountNote (first-time home buyer hereafter) were fairly similar in Nova Scotia (22.2%) and New Brunswick (22.4%). In these provinces, first-time home buyers purchased primarily single-detached houses, and purchased properties with higher median sale prices compared with those who did not claim the HBA (repeat buyers hereafter).
In British Columbia, first-time home buyers represented a smaller share of buyers (15.2%), and were more likely to purchase condominium apartments than other property types. This is consistent with previous data that showed that HBA claimants had higher ownership rates of condominium apartments and row houses (Al-Tawil, 2019).
First time-home buyers have higher incomes than repeat buyers in British Columbia
In the three provinces, first-time home buyers were more likely than repeat buyers to purchase a property in groups of three or more. This was especially pronounced in British Columbia, where 15.3% of first-time home buyers purchased properties in groups of three or more, compared with 9.3% of repeat buyers.
The median income of first-time home buyers was higher than the income of repeat buyers in British Columbia, whereas the opposite was true in Nova Scotia and New Brunswick. Despite first-time home buyers having higher incomes in British Columbia, they purchased lower priced homes than repeat buyers. The differences in income and sale prices between first-time home buyers and repeat buyers were most pronounced in the Vancouver census metropolitan area (CMA), where repeat buyers purchased properties with a median sale price 38.6% higher than first-time buyers, but earned an income 3.9% lower.

Data table for Chart 3
| Province | First-time home buyers | Repeat buyers |
|---|---|---|
| dollars | ||
| Nova Scotia | 53,300 | 56,700 |
| New Brunswick | 47,800 | 53,800 |
| British Columbia | 59,300 | 57,400 |
| Source: Statistics Canada, Canadian Housing Statistics Program (CHSP). | ||
Section 4: Home purchase price comparisons by immigration status
Immigration is the primary source of population growth in Canada, given that the natural rate of population growth (births minus deaths) has been on the decline since the 1950s (Statistics Canada, 2018). According to the 2016 Census, more than one in five Canadians was born abroad, and Statistics Canada (2017) is predicting that up to 30% of Canadians will have been born abroad by 2036. The share of immigrants is even more pronounced in some CMAs, representing 40.8% and 46.1% of Vancouver's and Toronto's populations, respectively.
Overall, immigrants accounted for a larger share of buyers relative to their share of the total population in all three provinces. They represented 10.1% of buyers in Nova Scotia and 8.4% of buyers in New Brunswick, with an approximately equal representation of recent immigrants and established immigrants.Note The 2016 Census showed that immigrants represented 6.1% of the population of Nova Scotia and 4.6% of the population of New Brunswick.
British Columbia had a higher share of immigrant buyers (35.2%), with over two-thirds of these buyers being established immigrants. Immigrants represented 28.3% of the population of this province.
Immigrants mainly purchase properties in metropolitan areas
There was a higher share of immigrant buyers in CMAs. In British Columbia, immigrants represented almost half of all buyers in CMAs, compared with under one-fifth of buyers in areas outside the metropolitan areas. In Nova Scotia and New Brunswick, over 10% of buyers in the CMAs were immigrants, compared with around 6.5% outside the metropolitan areas. These results are consistent with the 2016 Census, which shows that a higher share of immigrants lived in the CMAs.
The share of immigrant buyers was highest in areas near the core of the Vancouver CMA, as shown in Map 1. Of note, the Richmond census subdivision (CSD) had the largest proportion of immigrant buyers (78.2%), followed by the CSDs of Surrey and Burnaby (both around 66%). While these CSDs were among those with the highest share of immigrants in British Columbia, immigrants in these areas represented a larger share of buyers relative to their share of the CSD population.
The propensity for immigrants to settle in large cities has been well documented. Vézina and Houle (2017) showed that almost two-thirds of the immigrant population was living in the three largest CMAs in Canada, namely Vancouver, Montréal and Toronto. The study also noted that newer immigrants were more likely to settle in CMAs where there is broader access to social services, community support and job opportunities. This contributes to increasing their sense of belonging, which is vital to the social connection and integration of the immigrant population.
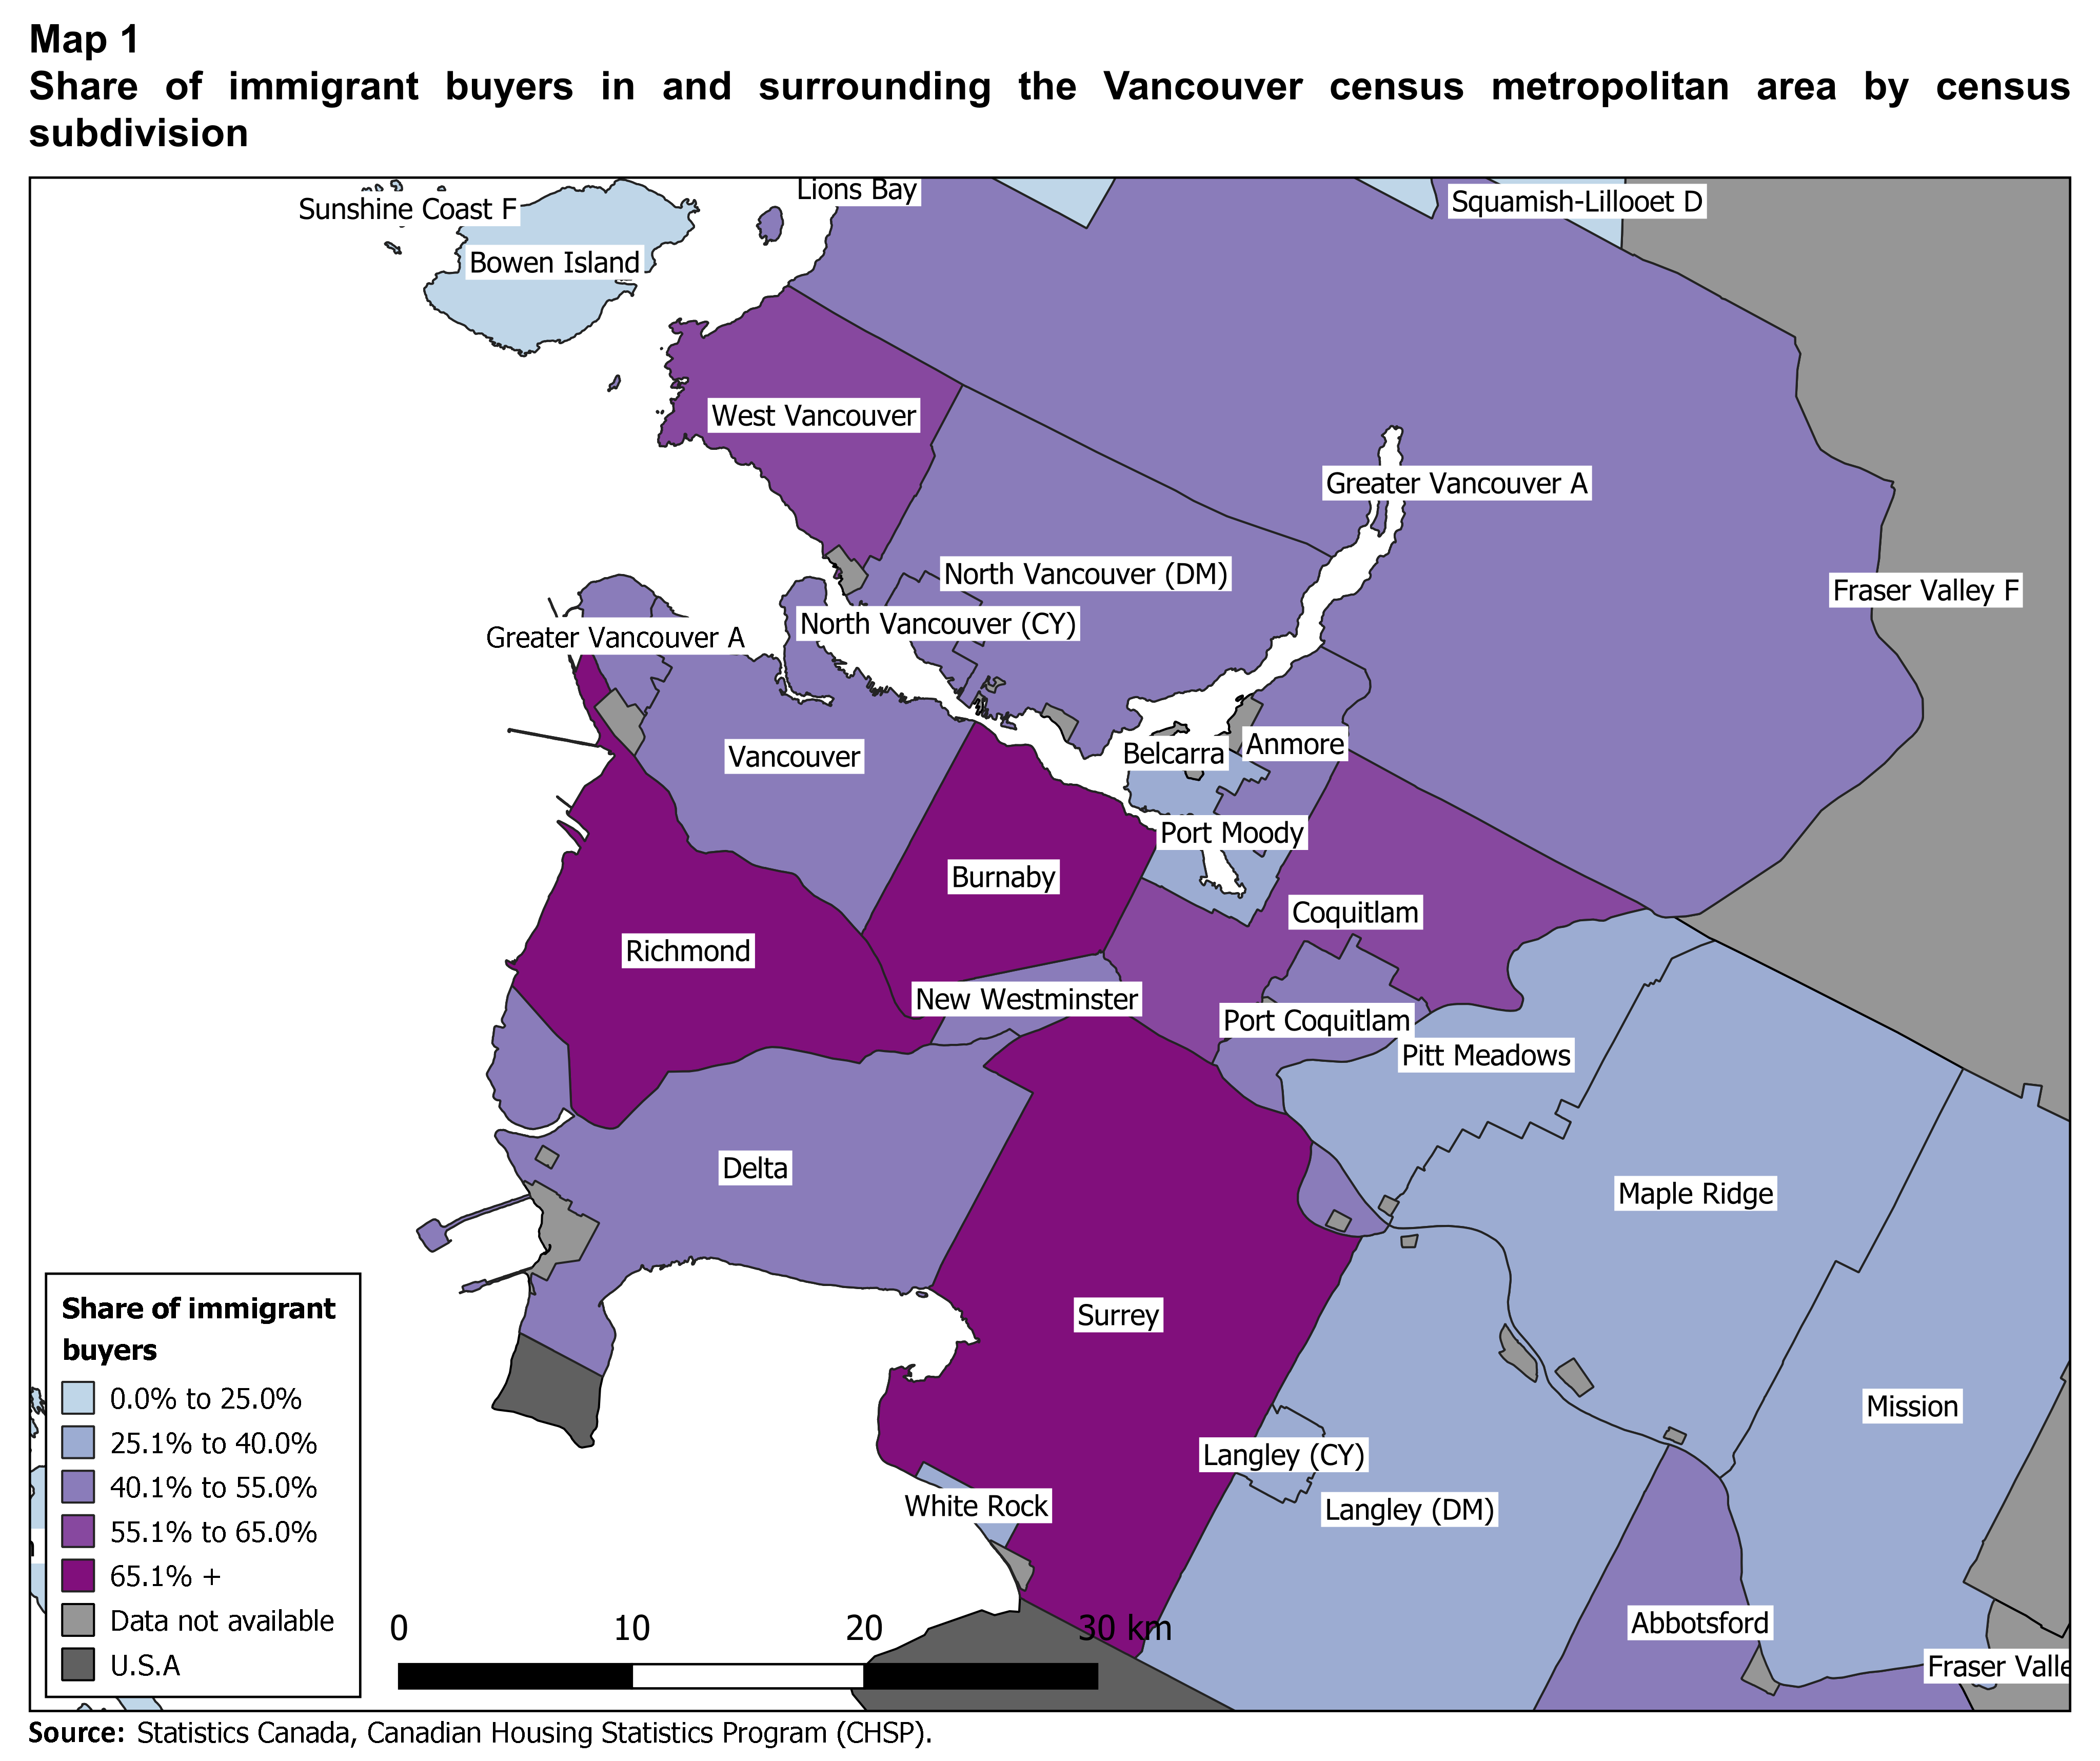
Data table for Map 1
| CSD name | Share of immigrant buyers |
|---|---|
| percent | |
| Abbotsford, City | 49.5 |
| Anmore, Village | 44.4 |
| Belcarra, Village | Note ...: not applicable |
| Bowen Island, Island municipality | 25.0 |
| Burnaby, City | 65.7 |
| Coquitlam, City | 64.5 |
| Delta, District municipality | 50.8 |
| Fraser Valley F, Regional district electoral area | Note ...: not applicable |
| Greater Vancouver A, Regional district electoral area | 50.0 |
| Langley, City | 38.6 |
| Langley, District municipality | 38.9 |
| Lions Bay, Village | 28.6 |
| Maple Ridge, City | 37.5 |
| Mission, District municipality | 31.8 |
| New Westminster, City | 47.2 |
| North Vancouver, City | 43.9 |
| North Vancouver, District municipality | 46.2 |
| Pitt Meadows, City | 31.8 |
| Port Coquitlam, City | 52.0 |
| Port Moody, City | 36.0 |
| Richmond, City | 78.2 |
| Squamish-Lillooet D, Regional district electoral area | 25.0 |
| Sunshine Coast F, Regional district electoral area | 19.2 |
| Surrey, City | 66.1 |
| Vancouver, City | 50.7 |
| West Vancouver, District municipality | 59.1 |
| White Rock, City | 33.3 |
|
... not available Source: Statistics Canada, Canadian Housing Statistics Program (CHSP). | |
Immigrants purchase more expensive properties than non-immigrants
In British Columbia, a higher share of immigrants (12.5%) purchased a property in a group of three or more, relative to non-immigrants (9.0%). The difference in these shares was smaller in Nova Scotia, while the opposite trend was observed in New Brunswick. Additionally, in British Columbia, a higher share of immigrants admitted to Canada through a family sponsorship purchased a property in groups of three or more (20.5%) relative to those admitted through economic programs (8.3%).
Properties purchased by immigrants were higher priced, relative to those bought by non-immigrants, as shown in Chart 4. In British Columbia, the average sale price of properties purchased by recent immigrants was $140,000 higher than that of those purchased by non-immigrants. The differences were relatively lower in Nova Scotia (+$90,000) and New Brunswick (+$35,000).
Similar differences were observed between established immigrants and non-immigrants, except in Nova Scotia, where the difference in mean sale prices between established immigrants and non-immigrants (+$50,000) was almost half that of recent immigrants and non-immigrants. These differences do not take into account other variations in the property and buyer characteristics.

Data table for Chart 4
| Province | Recent immigrants | Established immigrants | Non-immigrants |
|---|---|---|---|
| dollars | |||
| Nova Scotia | 310,000 | 270,000 | 220,000 |
| New Brunswick | 210,000 | 210,000 | 175,000 |
| British Columbia | 740,000 | 750,000 | 600,000 |
|
Note: As per Table 3 below, buyers who purchased multiple properties from January 1 to December
31, 2018, as well as buyers of properties with missing living area or of vacant land properties, were
excluded from the data. Source: Statistics Canada, Canadian Housing Statistics Program (CHSP). | |||
Property characteristics explain differences in home purchase prices between immigrants and non-immigrants
To account for differences in property characteristics, Table 3 presents estimates of the differences in sale prices by immigration status, factoring in the age of the property, its location, property type and property size.Note The results show that, after accounting for these characteristics, there were no significant differences in the sale price of properties purchased by immigrants and non-immigrants. This means that the difference in sale prices between these groups can be explained by property characteristics, such as purchasing newer properties or buying homes in more expensive cities. These findings are consistent with a previous analysis that found that property characteristics explained most of the difference in the assessment values of homes owned by immigrants and non-immigrants in Vancouver (Gellatly and Morissette, 2019).
In all three provinces, the differences in sale price of homes purchased by immigrants and non-immigrants remained elevated and significant after adjusting for buyer characteristics such as age, income, and whether the buyer was a multiple-property owner. This means that, for buyers with the same age and income, recent and established immigrants bought properties that were significantly more expensive than non-immigrants. British Columbia showed the highest differences, where recent immigrants with the same buyer characteristics bought properties with prices, on average, $165,000 higher than non-immigrants (+$85,000 and +$40,000 higher for Nova Scotia and New Brunswick, respectively). Similar magnitudes and trends were observed for established immigrants versus non-immigrants.
When comparing wealth accumulation between immigrants and non-immigrants, it was found that for immigrants, wealth accumulation through homeownership was more important than other types of assets such as registered pension plans (Morissette, 2019). This reflects the notion that immigrants may decide to hold a greater share of their wealth in housing but a smaller share in other asset classes compared to non-immigrants.
| Province | Recent immigrants | Established immigrants | ||||
|---|---|---|---|---|---|---|
| No adjustment | Property characteristics | Buyer characteristics | No adjustment | Property characteristics | Buyer characteristics | |
| dollars | dollars | |||||
| Nova Scotia | 90,000Table 8 Note*** | 5,000 | 85,000Table 8 Note*** | 50,000Table 8 Note*** | 10,000 | 60,000Table 8 Note*** |
| New Brunswick | 35,000Table 8 Note*** | 5,000 | 40,000Table 8 Note*** | 35,000Table 8 Note*** | 5,000 | 35,000Table 8 Note*** |
| British Columbia | 140,000Table 8 Note*** | 0 | 165,000Table 8 Note*** | 150,000Table 8 Note*** | -5,000 | 145,000Table 8 Note*** |
Source: Statistics Canada, Canadian Housing Statistics Program (CHSP). | ||||||
Most immigrant buyers were admitted to Canada through economic programs
The majority of immigrant buyers were admitted to Canada through economic immigration programs intended to attract skilled workers who can contribute to Canada's economy. Immigrant buyers in Nova Scotia and New Brunswick were most often admitted through the Provincial Nominee Program, which targets immigrants with the skills, education and work experience to contribute to a province or territory. In British Columbia, almost a third of the immigrant buyers were admitted through the Federal Skilled Worker program, which is for skilled workers with foreign work experience.Note
Around 1% of economic immigrant buyers in Nova Scotia and none of the buyers in New Brunswick were admitted through the Immigrant Investor Program or the Quebec Investor Program.Note By comparison, a larger share of economic immigrant buyers were admitted through the Immigrant Investor Program (5.5%) and the Quebec Investor Program (4.5%) in British Columbia. These programs required applicants to have specified years of business management experience, a minimum amount of net worth, and make an investment in the form of a loan to the governments of Canada or Quebec. Immigrant buyers admitted through investor programs purchased properties with the highest mean prices in British Columbia, with an average sale price almost two times higher than properties purchased by immigrants who were admitted through other economic programs.
As such, immigrants admitted to Canada tend to be highly skilled, have previous work experience and be entrepreneurs. Wealth, including from intergenerational transfers, or the level of indebtedness undertaken to purchase a home are not represented in the income measure.

Data table for Chart 5
| Province | Economic immigrants | Immigrants sponsored by family | Refugees | Other immigrants | Immigration before 1980 |
|---|---|---|---|---|---|
| percent | |||||
| Nova Scotia | 59.0 | 19.4 | 5.5 | 0.2 | 15.9 |
| New Brunswick | 63.4 | 17.4 | 5.7 | 0.4 | 13.2 |
| British Columbia | 53.7 | 28.6 | 5.2 | 0.7 | 11.9 |
| Source: Statistics Canada, Canadian Housing Statistics Program (CHSP). | |||||
Note to readers
The data used in this study are compiled from the Canadian Housing Statistics Program (CHSP). It includes properties sold from January 1 to December 31, 2018, which are linked to CHSP data for the reference year 2019. These data are integrated with the Longitudinal Immigration Database and the T1 Family File (T1FF) for tax year 2018.
The analysis in this article focuses on the buyers of properties sold in market sales which involve unrelated and independent parties. Buyers of properties sold in non-market sales, such as sales by related parties, sales of special interest, sales of part-interest, forfeitures and foreclosures, are not included. The data are restricted to buyers who are individuals and who filed a T1 tax return form in 2018. Non-individual buyers (such as firms and governments) and non-resident buyers are not included. There may be more than one buyer per property. Buyers are counted for every property they purchased from January 1 to December 31, 2018, and are located in the province and census metropolitan area of the property or properties they purchased.
Multiple properties may be included in the same sale, where one price was paid for multiple properties. A price adjustment is applied to these properties to estimate the price paid for each individual property.
The concept of family type is derived from the T1FF. Couple families with children include children in the family unit, without restriction on age.
Claimants of the home buyers' amount (HBA) are individuals who claimed the amount ($5,000) in their federal income tax return form for the taxation year in which the home was acquired, or who purchased a property with an individual who claimed the amount. Previous CHSP releases identified HBA claimants only. As such, including those who purchased a property with at least one HBA claimant broadens the definition of first-time home buyers. According to the Canada Revenue Agency rules, the claimant and their spouse must not have lived in another home they owned during the preceding four years and must intend to occupy their new home within one year of purchasing it.
Demographic analysis of individual resident buyers, including sex, includes only the population for which the demographic information is known and excludes unspecified values when calculating shares so that total shares equal 100%.
Geographical boundaries
Data from the CHSP is disseminated based on the geographical boundaries from the Standard Geographical Classification 2016.
Definitions
Sale of property refers to whether a property had a transfer of ownership from one party to another party through a contractual agreement. A property is considered to have been sold on the date that the property was transferred to, recorded in, registered in or otherwise carried in the name of the party who purchased the property.
Market sale refers to an arm's length transaction where all parties act independently with no influence over the other.
Non-market sale refers to non-arm's length transactions, which includes distressed sales, foreclosures, trade and forfeitures, sales of part-interest, and special interest sales.
Property refers to land with legally defined boundaries and the constructions, works and improvements of a permanent nature located on, above or below its surface for which the rights to use and dispose can be assigned. Sale price of property refers to the dollar amount set forth during the sale of the property as per the contractual agreement.
Sale price of property refers to the dollar amount set forth during the sale of the property as per the contractual agreement.
Total income includes income reported by tax filers from any of the following sources: employment income; dividends and interests; government transfers (including non-taxable income); private pensions; registered retirement savings plans; and other income such as net limited partnership income, rental net income, alimony, registered disability savings plans and other income (line 130 of the T1 form). It excludes veterans' disability and dependant pensioners' payments, war veterans' allowances, lottery winnings, and capital gains.
References
Al-Tawil, J. (2019, December 5). Homeownership, income, and residential property values. Housing statistics in Canada. Statistics Canada Catalogue no. 46-28-0001. https://www150.statcan.gc.ca/n1/pub/46-28-0001/2019001/article/00002-eng.htm
Fortin, N. (2005). Gender Role Attitudes and Labour-market Outcomes of Women across OECD Countries. Oxford Review of Economic Policy, 21(3), 416-438. https://doi.org/10.1093/oxrep/gri024
Frank, K. & Frenette, M. (2021, April 8). Couples' Perceptions of the Division of Household and Child Care Tasks: Are there Differences between Sociodemographic Groups? Analytical Studies Branch Research Paper Series, 460. Statistics Canada Catalogue no. 11F0019M. https://www150.statcan.gc.ca/n1/pub/11f0019m/11f0019m2021003-eng.htm
Gellatly, G. & Morissette, R. (2019, January 29). Immigrant Ownership of Residential Properties in Toronto and Vancouver. Economic Insights, 087. Statistics Canada Catalogue no. 11-626-X. https://www150.statcan.gc.ca/n1/pub/11-626-x/11-626-x2019001-eng.htm
Morissette, R. (2019, April 16). The Wealth of Immigrant Families in Canada. Analytical Studies Branch Research Paper Series, 422. Statistics Canada Catalogue no. 11F0019M. https://www150.statcan.gc.ca/n1/pub/11f0019m/11f0019m2019010-eng.htm
Pelletier R., Patterson, M. & Moyser, M. (2019, October 7). The gender wage gap in Canada: 1998 to 2018. Labour Statistics: Research Papers. Statistics Canada Catalogue no. 75-004-M. https://www150.statcan.gc.ca/n1/pub/75-004-m/75-004-m2019004-eng.htm
Statistics Canada. (2017, January 25). Study: A look at immigration, ethnocultural diversity and languages in Canada up to 2036, 2011 to 2036. The Daily. https://www150.statcan.gc.ca/n1/daily-quotidien/170125/dq170125b-eng.htm
Statistics Canada. (2018, May 17). Population growth: Migratory increase overtakes natural increase. The Daily. https://www150.statcan.gc.ca/n1/pub/11-630-x/11-630-x2014001-eng.htm
Statistics Canada. (2019, June 11). Canadian Housing Statistics Program, 2018. The Daily. https://www150.statcan.gc.ca/n1/daily-quotidien/190611/dq190611a-eng.htm
Vézina, M. & Houle, R. (2017, May 8). Settlement patterns and social integration of the population with an immigrant background in the Montréal, Toronto and Vancouver metropolitan areas. Ethnicity, Language and Immigration Thematic Series. Statistics Canada Catalogue no. 89-657-X. https://www150.statcan.gc.ca/n1/pub/89-657-x/89-657-x2016002-eng.htm
Notes
- Date modified: